 |
||||
|---|---|---|---|---|
|
|
|
|||
| ACF Home | Services | Working with ACF | Policy/Planning | About ACF | ACF News | HHS Home | ||||
Questions?
|
Privacy
|
Site Index
|
Contact Us
|
Download Reader™
|
|---|
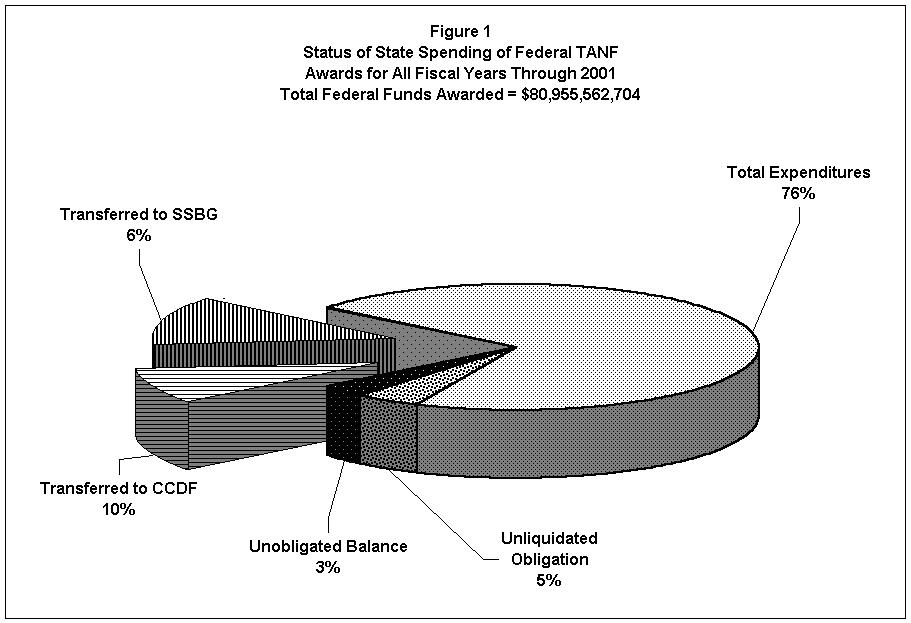
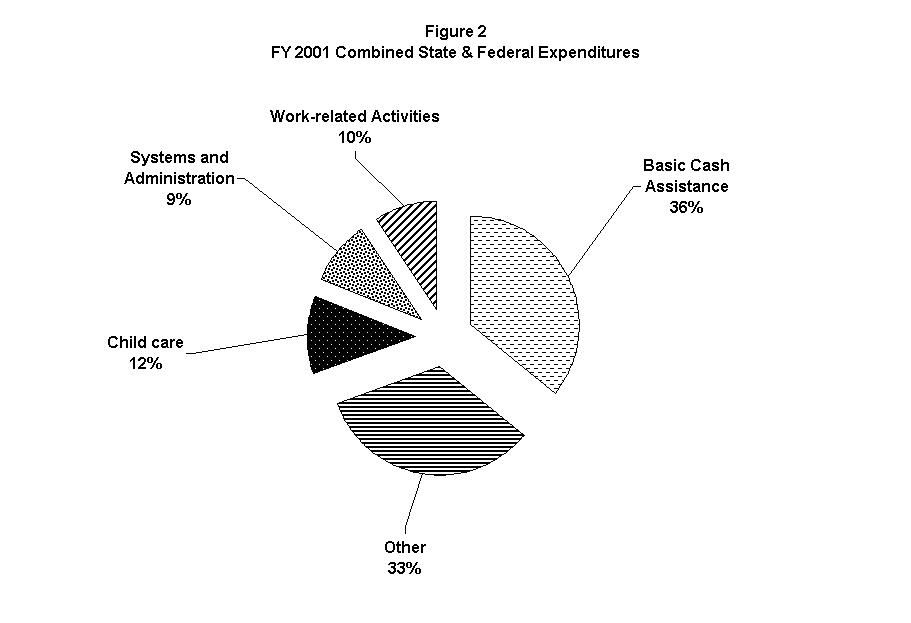
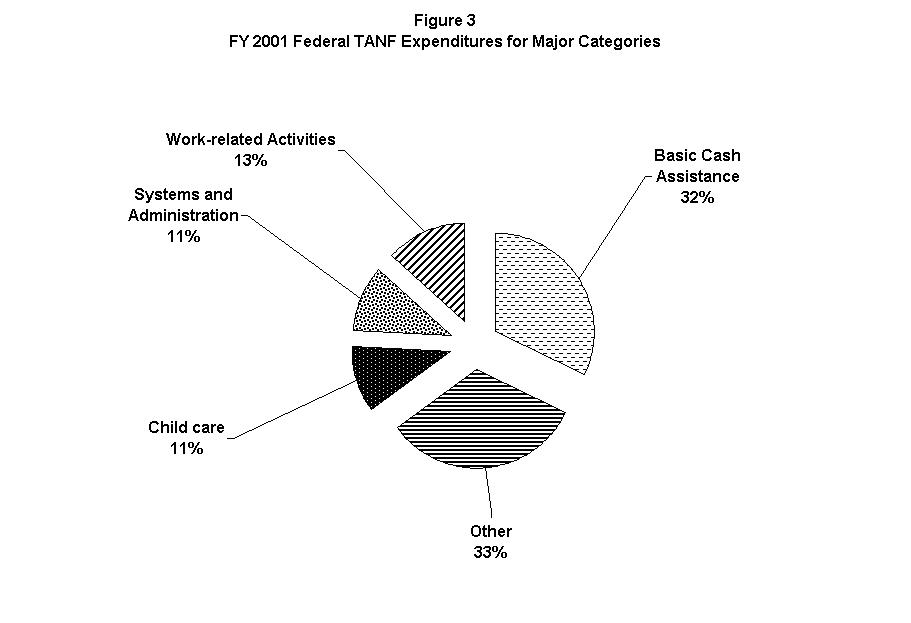
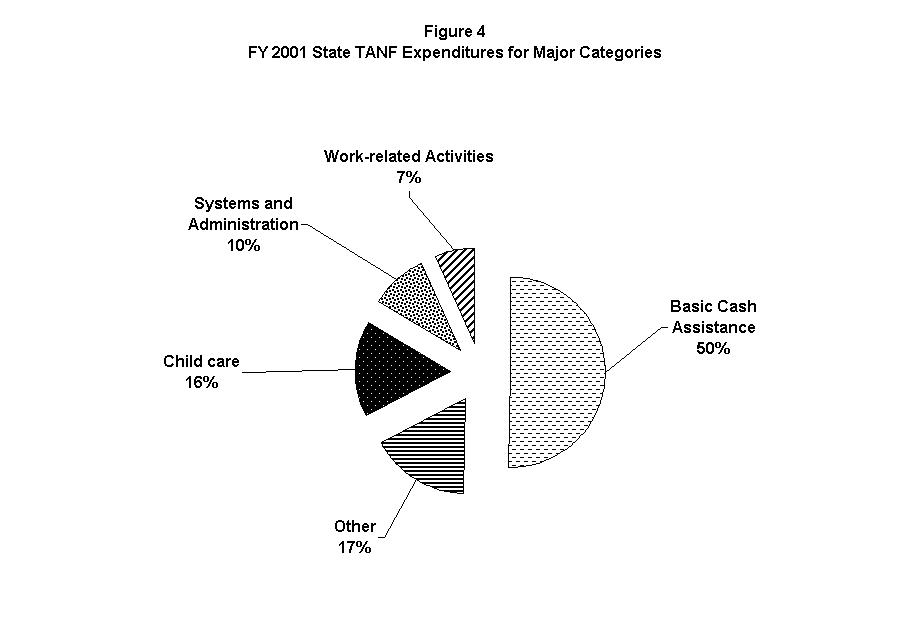
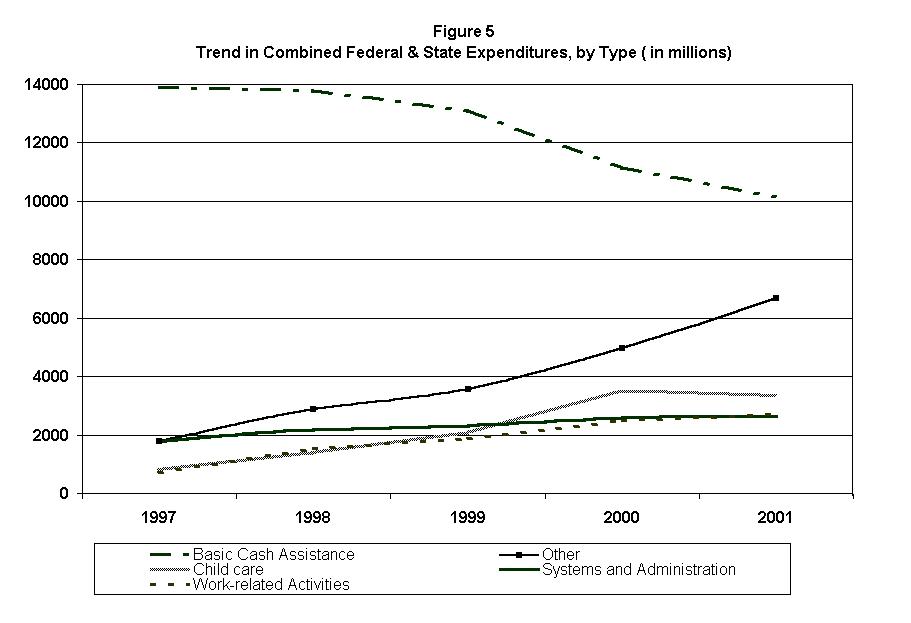
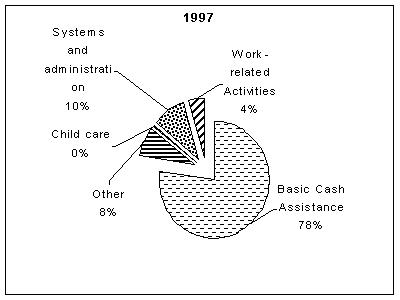
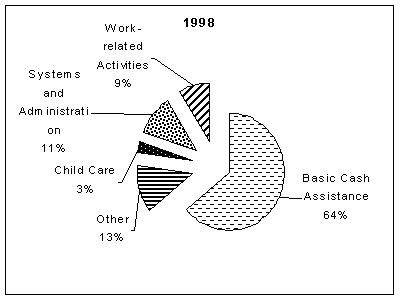
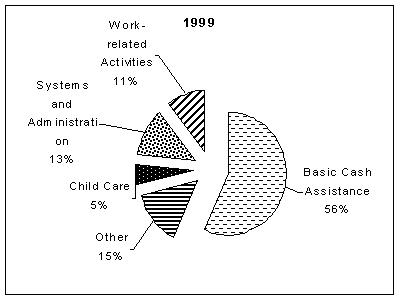
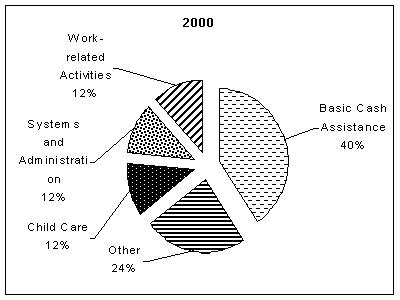
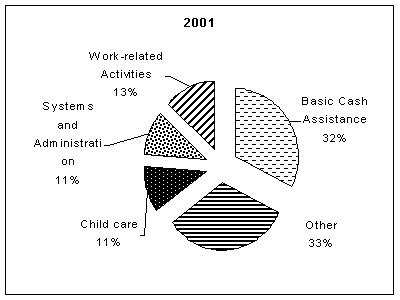
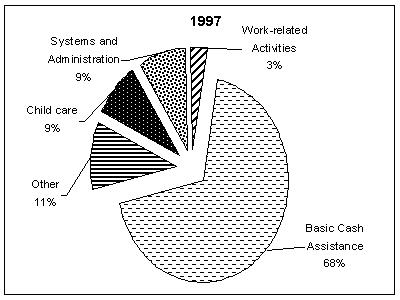
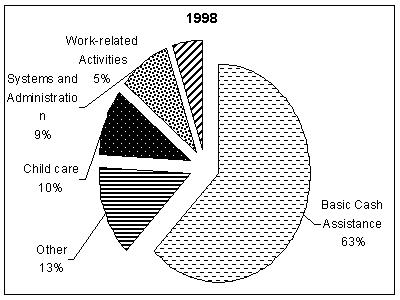
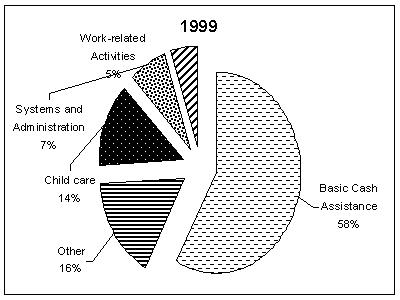
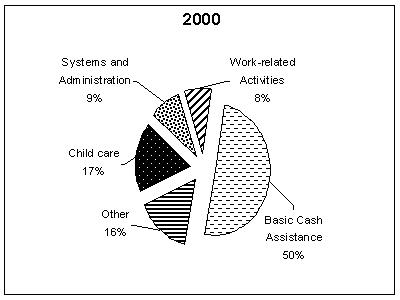
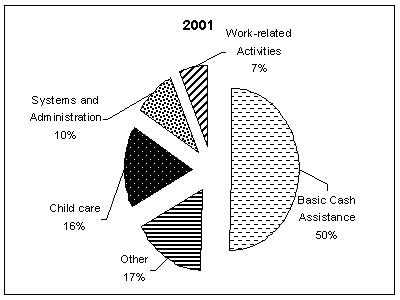
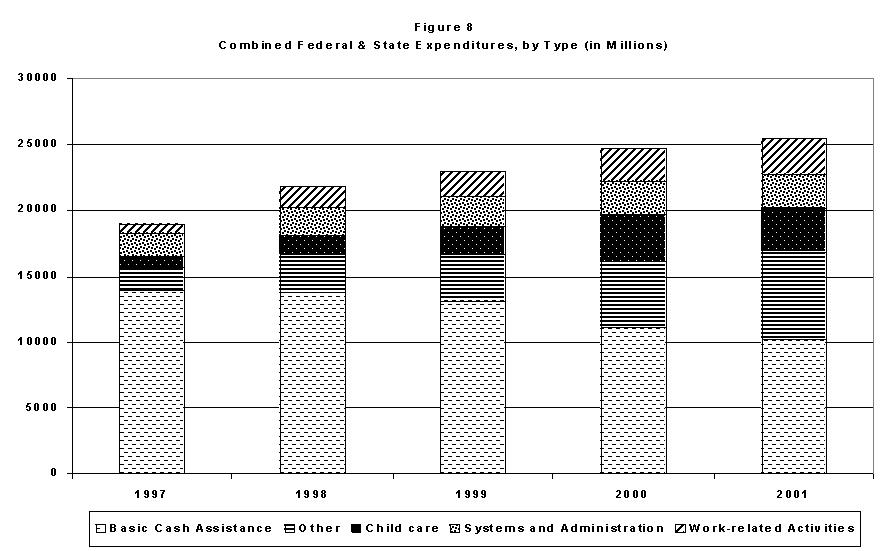
Fifth Annual Report to Congress (February 2003)II. Trends in Caseload and ExpendituresCaseload Data Maintenance of Effort (MOE) Child Care Work Activities Transferring TANF Funds Administrative Costs Separate State Programs Expenditures on Non-Cash Assistance Activities Pregnancy Prevention and Two-Parent Family Formation Caseloads in the Temporary Assistance for Needy Families (TANF) program continued to fall through Fiscal Year (FY) 2001 and into the first half of FY 2002, although at markedly lower rates of decline. At the end of FY 2001, the average monthly number of TANF recipients was 5.4 million, or 57 percent lower than the Aid to Families with Dependent Children (AFDC) caseload in FY 1996. Data for the first half of FY 2002 suggest that the TANF caseload fell again to 5.3 million, for a decrease of 58 percent from FY 1996. From an AFDC peak of 14.4 million in March 1994, the number of recipients dropped by 64 percent to 5.3 million in March 2002. Over three-fourths of the reduction in the U.S. average monthly number of recipients since March 1994 occurred following enactment of TANF. These are the largest caseload declines in the history of U.S. public assistance programs. The 5.4 million persons receiving TANF in FY 2001 was the smallest number since 1961. Over the past five and one-half years, 44 jurisdictions have reduced their caseloads by at least 40 percent; six by 70 percent or more. Post-TANF declines range from 2.9 to 92.1 percent, with a median of 52.3 percent; over two-thirds of the declines were in the 40-70 percent range. See Map 2:1. During this extended period of caseload decline, States continued to process a significant number of applications for assistance. Over the two and one-half year period for which data are available, the volume of applications remained relatively constant: 3.3 million in FY 2000, 3.4 million in FY 2001, and 1.7 million in the first half of FY 2002. This represents an increase of 4.1 percent in the average monthly number of applications between FY 2000 and FY 2001 and a decrease of 2.2 percent between FY 2001 and the first half of FY 2002. During this period, the average monthly number of cases closed also stayed at a fairly consistent level: 2.1 million in FY 2000, 2 million in FY 2001, and 1 million in the first half of FY 2001. In terms of monthly averages, this is a decrease of 3.6 percent between FY 2000 and FY 2001 and a further decrease of 0.5 percent between FY 2001 and the first half of FY 2002. Several factors are believed to have contributed to the dramatic decline in caseloads following enactment of TANF. Recent studies have concluded that, although the robust economy of the 1990’s contributed to the overall success of the program, the reduction in caseload is primarily the result of implementation of welfare reforms. The dramatic decrease in the number of recipients has been accompanied by changes in the composition of TANF cases. In FY 1996, between 62.0 and 75.4 percent of AFDC recipients were children. By FY 2001, children represented from 64.0 to 84.5 percent of all TANF recipients. In FY 1996, 47 States reported that children accounted for 65 to 75 percent of their caseloads; only one State reported a number greater than 75 percent. In FY 2001, the percentage of recipient children in 35 States was in the 65-75 percent range; 12 States were in the 75-80 percent range; and six were over 80 percent. The change in family composition has been directly impacted by the growth in the fraction of cases that are child-only cases. Child-only cases increased from 22 percent of the caseload in FY 1996 to 37 percent in FY 2001. Charts 2:1 through 2:3 and Tables 2:1a through 2.7c provide data on AFDC/TANF families and recipients since FY 1996 but primarily in FY 2001. Expenditures in the TANF Program in Fiscal Year 2001 States submit quarterly reports to the Department of Health and Human Services (HHS) detailing how they are spending Federal and State funds in the TANF program. This section provides information about States’ spending in Fiscal Year (FY) 2001 and earlier. The data shown in Tables 2:8 through 2:18 represent total spending during the period October 1, 2000 through September 30, 2001 and cumulative TANF spending by States since the program's inception. Through the end of FY 2001, States report spending 92 percent of the nearly $81 billion in Federal TANF funds distributed to them since the TANF program began in FY 1997. Of the total funds provided, 76 percent was expended directly through the State TANF programs, ten percent was transferred to the Child Care Development Fund (CCDF), and six percent was transferred to the Social Services Block Grant (SSBG). States have obligated another five percent of the total funds available to them for specific TANF-related activities for contracts or other binding arrangements that have not been expended; these amounts are included as unliquidated obligations in Figure 1. As of the end of FY 2001, $2.56 billion or three percent of all TANF funds provided to States since TANF began in 1997 remain unobligated. For most States these available funds represent a "rainy day" reserve to address contingencies and economic declines. Total TANF expenditures (combined Federal funds and State MOE funds) for FY 2001 were $25.5 billion, $1.5 billion more than the amount spent in FY 2000. This increased spending is in part attributable to investments in supportive services in the TANF program, such as child care and work support activities. In FY 2001, the total spending on basic cash assistance was $10.1 billion compared to $11.5 billion in FY 2000, a decrease of $1.4 billion. States reported spending $5.2 billion of combined Federal and State funds on child care, a $200 million decrease from the prior year. Total spending in work support activities increased $400 million over the prior year, with the States reporting $2.7 billion in FY 2001 for these purposes, as compared to $2.3 billion in FY 2000. Figure 5 shows how the combined funds were spent, by major category, from FY 1997 through FY 2001 and illustrates the fundamental shift in program design that has occurred since the inception of the program. During FY 2001, slightly more than one-third of TANF funds were spent on cash assistance, whereas in FY 1997 cash assistance expenditures represented slightly more than two-thirds of all funds spent. In FY 2001, almost one-third of expenditures ($6.7 billion) was categorized as "other," reflecting increased spending on transportation, family formation, pregnancy prevention, individual development accounts, and refundable tax credits, as compared to FY 1997 when States spent eight percent of expenditures ($862 million) on these activities. The remaining one-third of the combined Federal and State expenditures for TANF in FY 2001 was nearly equally divided among child care, work-related activities, and systems and administration. Figures 2, 3, and 4 provide the same categorical breakdown by combined, Federal and State expenditures for FY 2001 only. Note that for purposes of comparison, expenditures associated with funds transferred to SSBG and CCDF are not included. Figures 6, 7, and 8 show the spending patterns and changing trends over the past five years, by expenditure type. They graphically illustrate the dramatic changes that States are making in their programs to enable families to gain and sustain work. TANF requires States to continue spending State funds on low-income children and families at a level equal to at least 80 percent of their FY 1994 level (or 75 percent if they meet the minimum work participation rates). States reported spending a total of nearly $11 billion in State funds toward their MOE obligation, or about 80% of their 1994 level. Note that actual spending by States in this area may be greater, as States need only report spending sufficient to meet their MOE obligation requirement. If States want to compete for a High Performance Bonus, they must submit a separate annual report regarding their MOE expenditures in the TANF program and any Separate State Programs during the fiscal year. The report enables HHS to learn about the ways States use their own spending to complement their spending of Federal TANF dollars. These reports show that while States have continued to provide the traditional supportive services to families, like child care and transportation, many States have also used their funds to provide preventive services to help youth, young children, and families at risk of either remaining or becoming welfare recipients. Programs for youth and children include: after-school and stay-in-school programs; teen pregnancy prevention programs; and community youth grants. These programs provide services such as tutoring, counseling, job referrals, and community activities as alternatives to drug abuse, gang activity, sexual activity, and dropping out of school. State expenditures on initiatives such as home visiting programs for expectant families, families of newborns, and other at-risk families recognize the need to avert potential child abuse and neglect before it occurs. Some States also targeted services on responsible fatherhood and parenting activities. States also spent their MOE funds to provide services to help overcome barriers to work. These included domestic violence services, substance abuse services, foster and kinship care services, and family preservation services. Other supportive service expenditures that promoted family, work and job preparation included: help with utilities, rent or mortgage assistance; primary and secondary school textbook reimbursement programs for low-income families; tuition and book fees for post-secondary school or training programs; part-time student grant programs; and medical services not met by Medicaid/SCHIP for children in low-income families. A few States provided income supplements by paying out the refundable portion of the State's earned income or working family tax credit. One State also used MOE funds to pay out the refundable portion of its child and dependent care tax credit. Child Care is a critical support for families moving from welfare to work. States continued to spend TANF and State MOE funds directly on child care and through transfers of TANF funds to the Child Care and Development Fund (CCDF). States spent $5.2 billion in TANF and MOE funds in FY 2001 on child care, as compared with $5.4 billion in FY 2000. Although States transferred slightly less funding into the CCDF than they had in the previous year, they increased overall spending on child care in their combined Federal and State TANF programs. These "direct" child care expenditures in the TANF program totaled $3.3 billion, comprised of $1.7 billion of State MOE funds and $1.6 billion of Federal funds. By the end of FY 2001, States had transferred a total of $1.9 billion of Federal funds from the TANF program into the CCDF, which is $200 million less than transferred in FY 2000. A central objective of the TANF program is to move welfare parents into work. In FY 2001, States spent $2.7 billion in combined Federal and State funds on work activities compared to $2.3 billion spent on work activities in FY 2000. This category includes costs for work subsidies, education and training, and other job readiness activities such as employment counseling, job development, and job placement information and referral services. States may transfer up to 30 percent of their Federal award into their CCDF or Social Services Services Block Grant (SSBG) Programs. However, a State may not transfer more than ten percent of its Federal award to its SSBG Program. Forty-eight States reported transferring FY 2001 funds in amounts ranging from less than one percent to 30 percent of their total. In FY 2001, of the total Federal funds awarded, States transferred $1.88 billion or eight percent to States’ CCDF Programs, and $920 million or four percent into State SSBG Programs. Note that the CCDF transfer includes $2.01 billion of the FY 2001 grant, minus small adjustments to transfers from previous years. Total expenditures of both Federal and State funds on administrative costs amounted to $2.3 billion, or nine percent of total expenditures in FY 2001, well within the 15 percent spending cap on administrative costs. Twenty-eight States chose to fund separate programs with State-only funds that could count toward their MOE obligation in FY 2001. Among those 28 States, total expenditures on Separate State Programs ranged from $377 thousand to $449 million. As a percentage of a given State's total State MOE spending, the amounts spent in Separate State Programs ranged from 0.2 percent to 65 percent. States with separate programs spent on average 45 percent of their Separate State Program funds on cash assistance. Most of the remaining funds were spent on child care and non-direct services categorized as other expenditures. The annual MOE reports show that some States provided cash assistance programs to families with specific circumstances. For example, these States used separate State funds to provide financial assistance to: two-parent families; families with physical, mental health, substance abuse, or domestic violence issues; families in which the parent or caretaker is receiving or has applied for Supplemental Security Income; families in which the caretaker relative is not the parent; families in which a parent is attending post-secondary school; or families in which the minor parent is a student. A few States provided financial assistance to families with legal immigrants. States operating such programs generally continued to require individuals to participate in work activities. In the case of Separate State Programs for two-parent families, the work activities usually mirror those in the State's TANF program. The exceptions usually involved families in which the parent or relative is temporarily or permanently incapacitated in some way (e.g., mental health or substance abuse issues, or receipt of Supplemental Security Income) or families that consist of a non-parent caretaker relative. States also used Separate State Program funds to help family members in a variety of other ways. These included the provision of supportive work and employment-related services; utility, rental or mortgage assistance; substance abuse services; family preservation services; medical assistance and/or food assistance to family members who are not qualified aliens; medical services not met by Medicaid/SCHIP for children in low-income families; child care; part-time student grant programs; grants to schools to improve educational achievements of at-risk students; or a refundable earned income or dependent care tax credit. Expenditures on Non-Cash Assistance Activities States reported spending $12.8 billion combined Federal TANF funds and State MOE funds on non-cash assistance services and programs, which included work activities ($2.7 billion), child care expenditures ($2.8 billion), transportation services ($197 million), refundable tax credit programs ($571 million), pregnancy prevention programs ($305 million), two-parent family formation programs ($118 million), State information technology systems ($231 million), administrative costs ($2.3 billion), and miscellaneous other costs ($3.6 billion). Pregnancy Prevention and Two-Parent Family Formation All States have undertaken activities to either reduce the incidence of out-of-wedlock pregnancies or encourage paternal involvement in the lives of their children. Most pregnancy prevention efforts have focused on teenagers. State approaches to preventing teen pregnancy can be divided into several categories: education curricula on sex, abstinence, and relationships; reproductive health services; youth development programs; media campaigns; efforts to prevent repeat teen births; and multiple component interventions. State initiatives directed toward family formation tend to focus on involvement of non-custodial parents in their children’s lives. Other initiatives include parenting education, family crisis counseling, marriage counseling, mentoring, and eliminating eligibility criteria that discourage two-parent families from applying for assistance. Many States have also changed their eligibility rules for two-parent families to provide them equitable access to cash assistance and other benefits. Figure 6.
Figure 7.
This document was last modified on
Dec-17-2008
. |