|
FIGURE D-12 Passenger Crossings into the United States
by Personal Vehicles from Mexico and Canada: 1995-2006
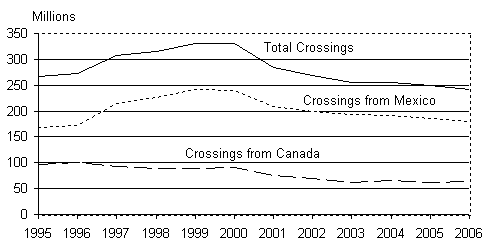
TABLE D-12
Passenger Crossings into the United States by Personal Vehicles from
Mexico and Canada: 1995-2006
Excel | CSV
| 1995 |
169,152,429 |
96,806,745 |
265,959,174 |
| 1996 |
171,522,486 |
101,070,734 |
272,593,220 |
| 1997 |
214,354,991 |
92,646,989 |
307,001,980 |
| 1998 |
226,012,670 |
88,283,187 |
314,295,857 |
| 1999 |
241,522,310 |
89,369,195 |
330,891,505 |
| 2000 |
239,794,552 |
90,046,948 |
329,841,500 |
| 2001 |
209,105,846 |
74,971,105 |
284,076,951 |
| 2002 |
199,020,692 |
68,986,616 |
268,007,308 |
| 2003 |
193,697,482 |
62,136,536 |
255,834,018 |
| 2004 |
190,936,607 |
64,848,466 |
255,785,073 |
| 2005 |
186,067,448 |
62,501,376 |
248,568,824 |
| 2006 |
179,255,014 |
62,986,037 |
242,241,051 |
NOTES: Passengers in
personal vehicles (privately owned vehicles)
include persons arriving by private automobile, pickup truck, motorcycle,
recreational vehicle, taxi, ambulance, hearse, tractor, snowmobile, and other
motorized private ground vehicles.
SOURCE: U.S. Department of
Transportation, Research and Innovative Technology Administration, Bureau of
Transportation Statistics, Border Crossing/Entry Data, available at
http://www.bts.gov/itt/ as of June 2007.
|
|