The Status of Telework in the Federal Government 2005
Introduction
Background
Section 359 of Public Law 106-346 (FY 2001 Department of Transportation and Related Agencies Appropriations Act)
states, "Each executive agency shall establish a policy under which eligible employees of the agency may participate
in telecommuting to the maximum extent possible without diminishing employee performance." The law defines telecommuting
as "any arrangement in which an employee regularly performs officially assigned duties at home or other work sites
geographically convenient to the residence of the employee," and eligible employee as, " ... any satisfactorily performing
employee of the agency whose job may typically be performed at least one day per week at an alternative workplace"
(see Appendix A).
OPM and GSA are partners in the effort to advance telework across all agencies in the Federal Government. Since 2001,
OPM has conducted an annual survey to assess the progress of Federal agencies to implement telework in their organizations.
This report summarizes the findings from the 2004 telework survey and highlights the efforts and activities spearheaded by OPM
and GSA in 2004 to champion the telework initiative.
Data Collection and Results
In December 2004, the Telework Survey was sent to 86 agencies in an effort to gather data to determine the current status
of the Federal telework initiative. An email with a link to the survey was sent directly to the telework coordinator identified
for each agency. Completed surveys were submitted electronically to a password-protected online database, which restricted the
number of submissions to one per agency.
Eighty-two agencies responded to the survey, representing a 95 percent response rate, a 9.5 percent increase from the previous
year. Ten agencies reported results to OPM for the first time in 2004. It is important to note that some of the agencies initially
surveyed in prior years as stand-alone entities have since been realigned. For example, a few years ago, the Department of Homeland
Security did not exist and it currently encompasses nine major components with over 22 subcomponents.

Telework Policies
The majority of agencies (85%) had telework policies in place, and 12 agencies did not. Although agency telework policies often
share some common characteristics, each agency is responsible for developing policy to fit its mission and culture. At the time of
the survey, each had its own eligibility criteria (characteristics of the position) and qualifying criteria (characteristics of the
employee) for their telework programs:
-
Eligibility Criteria
Forty-three agencies (52%) specified occupations that are eligible for telework. Agencies were asked which categories
of employees were excluded from teleworking. Of the 43 agencies that reported, 17 agencies (40%) stated support staff,
16 (37%) stated temporary employees, and 13 (30%) stated executives as being excluded from being eligible to telework.
-
Qualifying Criteria
Fifty-four agencies (66%) reported requiring a minimum performance rating for teleworkers, 43 agencies (52%) excluded
employees with past disciplinary problems from being eligible, and 26 agencies (32%) required employees to have been
in their positions for a minimum amount of time.
-
Health Issues
Fifty-two agencies (63%) allowed employees with health problems to use telework as a means for working while dealing with
personal health matters.
-
Work Schedules
Fifty-three agencies (65%) utilized telework in conjunction with alternative work schedules and 45 agencies (55%) required
teleworkers to adhere to agency-established core hours.
Agency Information
Agencies were asked to report on the mechanisms used to track the prevalence of telework and the equipment provided to
teleworkers. Additionally, they were asked to report on the level of information technology (IT) support provided to those
employees teleworking.
-
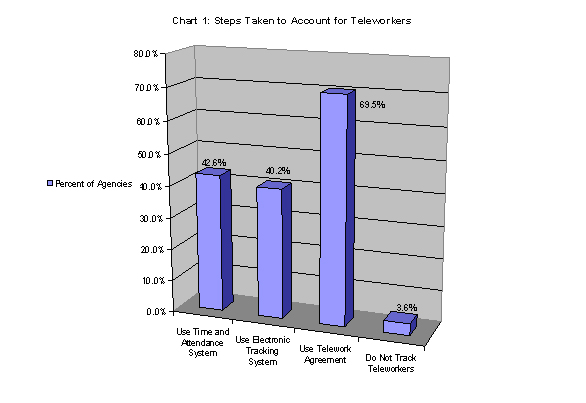
Tracking Systems
Fifty-seven agencies (70%) reported using the telework agreement as the tracking mechanism, 35 agencies (43%) used their
current time and attendance system, and 33 (40%) had electronic tracking systems in place. Three (4%) of agencies did not
track telework (see Chart 1).
-
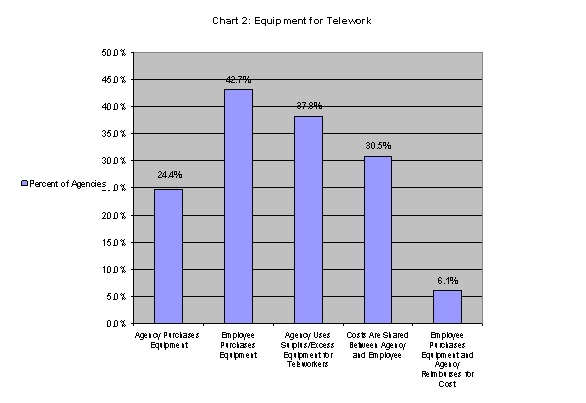
Equipment
Twenty (24%) agencies purchased equipment for their teleworkers, and at 35 agencies (43%) employees are expected to purchase
their own equipment. Thirty-one agencies (38%) reported providing teleworkers with surplus or excess equipment. Of the
agencies reporting, 25 (30%) stated they share the costs, while only 5 agencies (6%) reimbursed teleworkers (see Chart 2).
-
IT Support
Sixty-one agencies (74%) provided help desk support telephonically. Thirty-six agencies (44%) allowed teleworkers to bring
their equipment to the office to be repaired and 3 agencies (4%) provided in-home help desk services. Only 2 agencies (2%)
provided no support.
 d
d
 d
d
Modification of Survey Instrument
In 2004, the survey instrument was modified to capture additional information regarding the eligibility of employees (see Appendix B).
In previous years, survey results failed to provide OPM with the information needed to determine if employees met agency eligibility
criteria. The following question was added to more clearly determine the relationship between those eligible to telework and those who
actually teleworked:
Based on the definition of qualifying criteria (employee-related) given above, how many employees in your agency are eligible
for telework?
- Core Telework ___________________
- Situational Telework ___________________
- Not Eligible ___________________
A second new question was added to collect data on agencies' progress in integrating telework and COOP. As described in the section,
OPM and GSA Efforts to Promote Telework in 2004, OPM and GSA started making agency visits in 2004 to reinforce the connection
between telework and COOP. The additional question read:
What are the ways in which your agency has incorporated telework into its emergency preparedness plans?
- Telework has been incorporated in our agency as well as in our Continuity of Operations Plan (COOP) Yes_______No______
- Telework is currently under consideration for inclusion in our agency emergency preparedness plans. Yes_______No______
- We have provided employees with equipment they need to continue operations during emergencies and closures. Yes_______No______
- Conditions for telework during times of emergencies or agency closures are included in all telework agreements. Yes_______No______
- Teleworking during emergencies is covered in our internal management/supervisory training classes. Yes_______No______
- Other Yes_______No______
- Not Applicable Yes_______No______
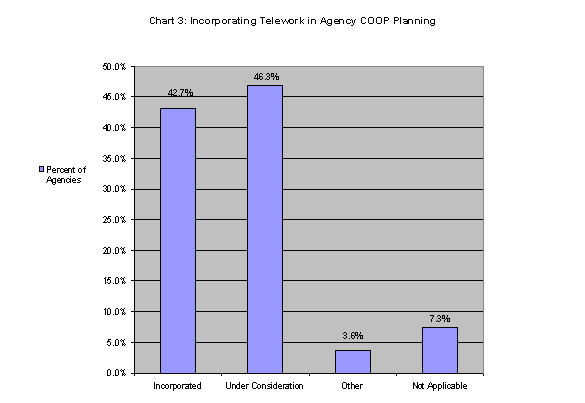
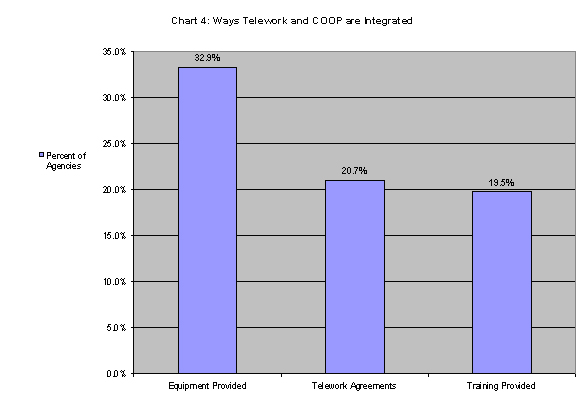
At the time of the survey, telework was incorporated into the COOP plans of 35 (43%) of those agencies responding. Additionally, 38 agencies
(46%) considered incorporating COOP into their emergency preparedness plans. Of those agencies that had integrated telework into their COOP
planning, 27 agencies (33%) provided equipment, 17 agencies (21%) included COOP planning as a component of their telework agreements, and 16
agencies (20%) provided related training (see Charts 3 and 4).
 d
d
 d
d
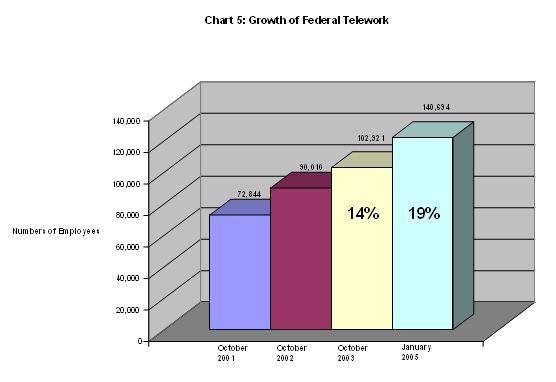
Growth of Federal Telework
Overall, telework continues to grow in the Federal Government. From 2003 to 2004, there was a 37% increase in the number of teleworkers
(102,921 to 140,694). The number of employees teleworking as a percentage of those eligible to telework increased from 14% in 2003 to 19% in
2004 (see Chart 5). Approximately 41% of Federal employees were eligible to telework during 2004 (see Table 1).
Thirty-eight agencies, 46 percent, reported that more than 25 percent of their workforce participated in telework during 2004 (see Table 2).
 d
d
Table 1: % of Eligible Employees Teleworking
Department/Agency |
# of Employees 2004 |
# of Eligible Employees 2004 |
Total Number of Employees Teleworking |
2004 % of Eligible Employees Teleworking |
2003 % of Eligible Employees Teleworking |
Change from 2003 |
| Access Board |
27 |
24 |
19 |
79.2% |
- |
New |
| Agency for International Development |
2,256 |
1,016 |
299 |
29.4% |
14.7% |
Increase |
| Appraisal Subcommittee |
- |
|
- |
- |
50.0% |
no response in 2004 |
| Architectural and Transportation Barriers Compliance Board |
- |
|
- |
- |
72.0% |
no response in 2004 |
| Armed Forces Retirement Home |
503 |
503 |
10 |
2.0% |
0.0% |
Increase |
| Board of Governors, Federal Reserve |
1,600 |
49 |
49 |
100.0% |
- |
New |
| Broadcasting Board of Governors |
1,809 |
589 |
60 |
10.2% |
- |
New |
| Central Intelligence Agency |
- |
34 |
- |
- |
- |
no response in 2004 |
| Chemical Safety and Hazard Investigation Board |
36 |
34 |
8 |
23.5% |
0.0% |
Increase |
| Commission on Civil Rights |
65 |
57 |
0 |
0% |
- |
New |
| Committee for Purchase from the Blind and Severely Disabled |
29 |
21 |
4 |
19.0% |
28.6% |
Decrease |
| Commodity Futures Trading Commission |
500 |
500 |
50 |
10.0% |
9.4% |
Increase |
| Consumer Product Safety Commission |
452 |
411 |
209 |
50.9% |
49.5% |
Increase |
| Corporation for National and Community Service |
601 |
464 |
54 |
11.6% |
- |
New |
| Court Services and Offender Supervision Agency |
1,077 |
1,016 |
205 |
20.2% |
6.3% |
Increase |
| Defense Nuclear Facilities Safety Board |
95 |
3 |
3 |
100.0% |
100.0% |
No Change |
| Department of Agriculture |
94,454 |
71,034 |
4,066 |
5.7% |
4.6% |
Increase |
| Department of Commerce |
36,944 |
24,779 |
9,627 |
38.9% |
38.7% |
Increase |
| Department of Defense |
662,519 |
183,844 |
21,318 |
11.6% |
9.3% |
Increase |
| Department of Education |
4,929 |
3,859 |
1,576 |
40.8% |
50.8% |
Decrease |
| Department of Energy |
14,004 |
12,468 |
1,246 |
10.0% |
100.0% |
Decrease |
| Department of Health and Human Services |
63,429 |
59,654 |
11,331 |
19.0% |
18.3% |
Increase |
| Department of Homeland Security |
158,606 |
38,573 |
1,938 |
5.0% |
1.5% |
Increase |
| Department of Housing and Urban Development |
9,842 |
7,168 |
1,088 |
15.2% |
88.9% |
Decrease |
| Department of Interior |
70,477 |
31,548 |
3,580 |
11.3% |
3.3% |
Increase |
| Department of Justice |
102,882 |
46,127 |
18,604 |
40.3% |
4.4% |
Increase |
| Department of Labor |
15,649 |
15,649 |
7,845 |
50.1% |
38.2% |
Increase |
| Department of State |
18,751 |
1,240 |
1,019 |
82.2% |
1.5% |
Increase |
| Department of Transportation |
57,404 |
26,445 |
3,553 |
13.4% |
10.0% |
Increase |
| Department of Treasury |
105,981 |
100,439 |
29,362 |
29.2% |
70.2% |
Decrease |
| Department of Veterans Affairs |
230,472 |
40,704 |
1,716 |
4.2% |
1.1% |
Increase |
| Environmental Protection Agency |
17,697 |
12,894 |
3,585 |
27.8% |
28.7% |
Decrease |
| Equal Employment Opportunity Commission |
2,461 |
1,692 |
727 |
43.0% |
39.8% |
Increase |
| Executive Office of the President (Office of Science and Technology Policy) |
40 |
1 |
1 |
100.0% |
- |
New |
| Export-Import Bank |
400 |
400 |
0 |
0% |
0.2% |
Decrease |
| Farm Credit Administration |
287 |
287 |
128 |
44.6% |
38.2% |
Increase |
| Federal Communications Commission |
1,969 |
1,969 |
634 |
32.2% |
29.8% |
Increase |
| Federal Deposit Insurance Corporation |
5,092 |
5,092 |
2,195 |
43.1% |
9.8% |
Increase |
| Federal Elections Commission |
384 |
10 |
10 |
100.0% |
- |
New |
| Federal Energy Regulatory Commission |
1,253 |
1,183 |
336 |
28.4% |
26.8% |
Increase |
| Federal Housing Finance Board |
118 |
105 |
0 |
0% |
37.8% |
Decrease |
| Federal Labor Relations Authority |
184 |
97 |
14 |
14.4% |
0.0% |
Increase |
| Federal Maritime Commission |
128 |
128 |
10 |
7.8% |
8.0% |
Decrease |
| Federal Mediation and Conciliation Service |
274 |
238 |
120 |
50.4% |
46.5% |
Increase |
| Federal Retirement Thrift Investment Board |
90 |
0 |
0 |
0% |
0.0% |
No Change |
| Federal Trade Commission |
1,082 |
815 |
31 |
3.8% |
3.1% |
Increase |
| General Services Administration |
12,690 |
11,219 |
2,874 |
25.6% |
24.5% |
Increase |
| Government Accountability Office |
- |
|
- |
- |
- |
no response in 2004 |
| Inter-American Foundation |
47 |
47 |
13 |
27.7% |
14.3% |
Increase |
| International Boundary and Water Commission |
243 |
60 |
0 |
0% |
1.4% |
Decrease |
| International Trade Commission |
371 |
371 |
45 |
12.1% |
10.4% |
Increase |
| Japan US Friendship Commission |
4 |
3 |
3 |
100.0% |
100.0% |
No Change |
| Marine Mammal Commission |
11 |
10 |
5 |
50.0% |
- |
New |
| Merit Systems Protection Board |
225 |
176 |
44 |
25.0% |
27.0% |
Decrease |
| National Aeronautics and Space Administration |
19,583 |
17,058 |
1,186 |
7.0% |
5.8% |
Increase |
| National Archives and Records Administration |
3,062 |
1,767 |
170 |
9.6% |
5.3% |
Increase |
| National Capital Planning Commission |
48 |
48 |
3 |
6.3% |
- |
New |
| National Council on Disability |
12 |
12 |
7 |
58.3% |
72.7% |
Decrease |
| National Credit Union Administration |
926 |
407 |
80 |
19.7% |
25.6% |
Decrease |
| National Endowment for the Arts |
164 |
164 |
44 |
26.8% |
33.3% |
Decrease |
| National Endowment for the Humanities |
170 |
170 |
67 |
39.4% |
32.4% |
Increase |
| National Labor Relations Board |
1,913 |
1,319 |
447 |
33.9% |
33.9% |
No change |
| National Mediation Board |
52 |
52 |
16 |
30.8% |
28.8% |
Increase |
| National Science Foundation |
1,364 |
1,296 |
276 |
21.3% |
17.9% |
Increase |
| Nuclear Regulatory Commission |
3,169 |
3,138 |
789 |
25.1% |
29.2% |
Decrease |
| Occupational Safety and Health Review Commission |
59 |
52 |
6 |
11.5% |
16.4% |
Decrease |
| Office of Federal Housing Enterprise Oversight |
195 |
181 |
181 |
100.0% |
- |
New |
| Office of Government Ethics |
78 |
77 |
6 |
7.8% |
7.8% |
No Change |
| Office of National Drug Control Policy |
109 |
0 |
0 |
0% |
3.7% |
Decrease |
| Office of Personnel Management |
3,594 |
2,803 |
1,910 |
68.1% |
53.2% |
Increase |
| Office of Special Counsel |
105 |
87 |
15 |
17.2% |
16.9% |
Increase |
| Overseas Private Investment Corporation |
198 |
135 |
61 |
45.2% |
25.7% |
Increase |
| Peace Corps |
825 |
825 |
15 |
1.8% |
0.0% |
Increase |
| Pension Benefit Guaranty Corporation |
786 |
516 |
192 |
37.2% |
100.0% |
Decrease |
| Postal Rate Commission |
47 |
0 |
0 |
0% |
100.0% |
Decrease |
| Railroad Retirement Board |
1,023 |
343 |
100 |
29.2% |
37.5% |
Decrease |
| Securities and Exchange Commission |
3,883 |
3,883 |
648 |
16.7% |
9.5% |
Increase |
| Selective Service System |
153 |
115 |
4 |
3.5% |
0.0% |
Increase |
| Small Business Administration |
3,390 |
3,323 |
328 |
9.9% |
8.6% |
Increase |
| Smithsonian Institution |
- |
|
- |
- |
- |
no response in 2004 |
| Social Security Administration |
64,579 |
10,628 |
4,441 |
41.8% |
29.9% |
Increase |
| Tennessee Valley Authority |
12,790 |
0 |
0 |
0% |
0.0% |
No Change |
| Trade and Development Agency |
41 |
40 |
0 |
0% |
0.0% |
No Change |
| U.S. Holocaust Memorial Museum |
400 |
300 |
73 |
24.3% |
18.3% |
Increase |
| U.S. Nuclear Waste Technical Review Board |
16 |
16 |
15 |
93.8% |
100.0% |
Decrease |
| U.S. Trade Representative |
- |
|
- |
- |
- |
no response in 2004 |
| |
|
|
|
|
|
|
Totals |
1,818,397 |
752,337 |
140,694 |
18.65% |
13.70% |
|
Table 2: 2004 Survey Agencies with Over 25% Utilization Rate
Department/Agency |
# Number of Employees 2004 |
Total Number of Eligible Employees 2004 |
Total Number of Employees Teleworking 2004 |
% of Eligible Employees Teleworking 2004 |
Board of Governors, Federal Reserve |
1,600 |
49 |
49 |
100.0% |
Defense Nuclear Facilities Safety Board |
95 |
3 |
3 |
100.0% |
Executive Office of the President (Office of Science and Technology Policy) |
40 |
1 |
1 |
100.0% |
Federal Elections Commission |
384 |
10 |
10 |
100.0% |
Japan US Friendship Commission |
4 |
3 |
3 |
100.0% |
Office of Federal Housing Enterprise Oversight |
195 |
181 |
181 |
100.0% |
U.S. Nuclear Waste Technical Review Board |
16 |
16 |
15 |
93.8% |
Department of State |
18,751 |
1,240 |
1,019 |
82.2% |
Access Board |
27 |
24 |
19 |
79.2% |
Office of Personnel Management |
3,594 |
2,803 |
1,910 |
68.1% |
National Council on Disability |
12 |
12 |
7 |
58.3% |
Consumer Product Safety Commission |
452 |
411 |
209 |
50.9% |
Federal Mediation and Conciliation Service |
274 |
238 |
120 |
50.4% |
Department of Labor |
15,649 |
15,649 |
7,845 |
50.1% |
Marine Mammal Commission |
11 |
10 |
5 |
50.0% |
Overseas Private Investment Corporation |
198 |
135 |
61 |
45.2% |
Farm Credit Administration |
287 |
287 |
128 |
44.6% |
Federal Deposit Insurance Corporation |
5,092 |
5,092 |
2,195 |
43.1% |
Equal Employment Opportunity Commission |
2,461 |
1,692 |
727 |
43.0% |
Social Security Administration |
64,579 |
10,628 |
4,441 |
41.8% |
Department of Education |
4,929 |
3,859 |
1,576 |
40.8% |
Department of Justice |
102,882 |
46,127 |
18,604 |
40.3% |
National Endowment for the Humanities |
170 |
170 |
67 |
39.4% |
Department of Commerce |
36,944 |
24,779 |
9,627 |
38.9% |
Pension Benefit Guaranty Corporation |
786 |
516 |
192 |
37.2% |
National Labor Relations Board |
1,913 |
1,319 |
447 |
33.9% |
Federal Communications Commission |
1,969 |
1,969 |
634 |
32.2% |
National Mediation Board |
52 |
52 |
16 |
30.8% |
Agency for International Development |
2,256 |
1,016 |
299 |
29.4% |
Department of Treasury |
105,981 |
100,439 |
29,362 |
29.2% |
Railroad Retirement Board |
1,023 |
343 |
100 |
29.2% |
Federal Energy Regulatory Commission |
1,253 |
1,183 |
336 |
28.4% |
Environmental Protection Agency |
17,697 |
12,894 |
3,585 |
27.8% |
Inter-American Foundation |
47 |
47 |
13 |
27.7% |
National Endowment for the Arts |
164 |
164 |
44 |
26.8% |
General Services Administration |
12,690 |
11,219 |
2,874 |
25.6% |
Nuclear Regulatory Commission |
3,169 |
3,138 |
789 |
25.1% |
Merit Systems Protection Board |
225 |
176 |
44 |
25.0% |
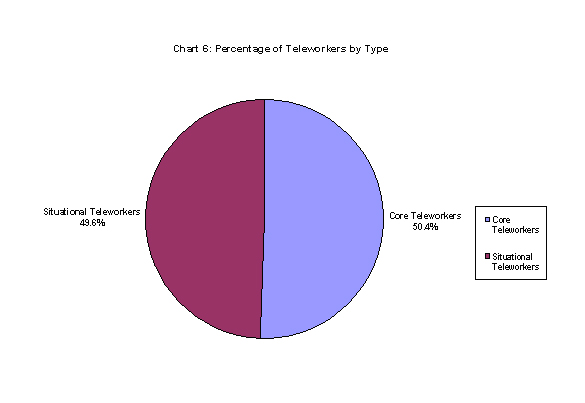
Core and Situational Telework
Fifty percent (50%) of those reported as having teleworked in the Federal workforce were reported as core teleworkers. Core is
defined as "Telework that occurs on a routine, regular, and recurring basis away from an employee's principal place of duty
(e.g., at home, at a telework center, at an alternate location) one or more days per week." Almost fifty percent (49.6%) teleworked
on a situational basis, defined as all non-core telework (see Chart 6). In 2004, the number of core teleworkers decreased, while
the number of situational teleworkers increased. The average number of days per month that employees teleworked on a core and
situational basis were 6 and 3, respectively. This remains identical to data collected in the 2003 survey.
 d
d
Health-Related Telework
One of the ways in which situational telework best serves agencies is in conjunction with cases of reasonable accommodation
for health-related matters, such as a qualified disability, temporary disability, or temporary medical issue. In 2004, 3,300
employees were identified as using telework to deal with health-related issues. In 2003, there were 3,849 employees utilizing
telework for these same reasons (see Table 3).
Table 3: 2004 Survey- Reasonable Accommodation Telework
Department/Agency |
Number of Eligible Employees |
Total Number of Teleworkers |
# of Employees Using Telework for a Disability |
# of Employees Using Telework for Temporary Medical Reasons |
Access Board |
24 |
19 |
1 |
3 |
Agency for International Development |
1,016 |
299 |
0 |
39 |
Appraisal Subcommittee* |
- |
- |
- |
- |
Architectural and Transportation Barriers Compliance Board* |
- |
- |
- |
- |
Armed Forces Retirement Home |
503 |
10 |
0 |
2 |
Board of Governors, Federal Reserve |
49 |
49 |
2 |
2 |
Broadcasting Board of Governors |
589 |
60 |
0 |
0 |
Chemical Safety and Hazard Investigation Board |
34 |
8 |
0 |
0 |
Commission on Civil Rights |
57 |
0 |
0 |
0 |
Committee for Purchase from the Blind and Severely Disabled |
21 |
4 |
0 |
0 |
Commodity Futures Trading Commission |
500 |
50 |
1 |
4 |
Consumer Product Safety Commission |
411 |
209 |
0 |
3 |
Corporation for National and Community Service |
464 |
54 |
0 |
7 |
Court Services and Offender Supervision Agency |
1,016 |
205 |
1 |
7 |
Defense Nuclear Facilities Safety Board |
3 |
3 |
0 |
3 |
Department of Agriculture |
71,034 |
4,066 |
36 |
252 |
Department of Commerce |
24,779 |
9,627 |
9 |
104 |
Department of Defense |
183,844 |
21,318 |
147 |
649 |
Department of Education |
3,859 |
1,576 |
20 |
99 |
Department of Energy |
12,468 |
1,246 |
17 |
121 |
Department of Health and Human Services |
59,654 |
11,331 |
72 |
275 |
Department of Homeland Security |
38,573 |
1,938 |
7 |
59 |
Department of Housing and Urban Development |
7,168 |
1,088 |
10 |
3 |
Department of Interior |
31,548 |
3,580 |
20 |
192 |
Department of Justice |
46,127 |
18,604 |
31 |
159 |
Department of Labor |
15,649 |
7,845 |
13 |
26 |
Department of State |
1,240 |
1,019 |
3 |
3 |
Department of Transportation |
26,445 |
3,553 |
13 |
92 |
Department of Treasury |
100,439 |
29,362 |
198 |
704 |
Department of Veterans Affairs* |
40,704 |
1,716 |
- |
- |
Environmental Protection Agency |
12,894 |
3,585 |
16 |
70 |
Equal Employment Opportunity Commission |
1,692 |
727 |
13 |
26 |
Executive Office of the President (Office of Science and Technology Policy) |
1 |
1 |
0 |
0 |
Export-Import Bank |
400 |
0 |
0 |
0 |
Farm Credit Administration |
287 |
128 |
1 |
1 |
Federal Communications Commission |
1,969 |
634 |
1 |
8 |
Federal Deposit Insurance Corporation |
5092 |
2,195 |
0 |
0 |
Federal Elections Commission |
10 |
10 |
0 |
10 |
Federal Energy Regulatory Commission |
1,183 |
336 |
0 |
2 |
Federal Housing Finance Board |
105 |
0 |
0 |
0 |
Federal Labor Relations Authority |
97 |
14 |
0 |
0 |
Federal Maritime Commission |
128 |
10 |
0 |
0 |
Federal Mediation and Conciliation Service |
238 |
120 |
0 |
1 |
Federal Retirement Thrift Investment Board |
0 |
0 |
0 |
0 |
Federal Trade Commission |
815 |
31 |
3 |
2 |
General Services Administration |
11,219 |
2,874 |
5 |
47 |
Government Accountability Office* |
- |
- |
- |
- |
Inter-American Foundation |
47 |
13 |
0 |
1 |
International Boundary and Water Commission |
60 |
0 |
0 |
0 |
International Trade Commission |
371 |
45 |
0 |
4 |
Japan US Friendship Commission |
3 |
3 |
0 |
0 |
Marine Mammal Commission |
10 |
5 |
|
1 |
Merit Systems Protection Board |
176 |
44 |
0 |
0 |
National Aeronautics and Space Administration |
17,058 |
1,186 |
11 |
101 |
National Archives and Records Administration |
1,767 |
170 |
1 |
0 |
National Capital Planning Commission |
48 |
3 |
0 |
0 |
National Council on Disability |
12 |
7 |
0 |
2 |
National Credit Union Administration |
407 |
80 |
0 |
0 |
National Endowment for the Arts |
164 |
44 |
0 |
1 |
National Endowment for the Humanities |
170 |
67 |
0 |
3 |
National Labor Relations Board |
1,319 |
447 |
2 |
15 |
National Mediation Board |
52 |
16 |
0 |
1 |
National Science Foundation |
1,296 |
276 |
0 |
4 |
Nuclear Regulatory Commission |
3,138 |
789 |
3 |
26 |
Occupational Safety and Health Review Commission |
52 |
6 |
0 |
1 |
Office of Federal Housing Enterprise Oversight |
181 |
181 |
0 |
2 |
Office of Government Ethics |
77 |
6 |
0 |
0 |
Office of National Drug Control Policy |
0 |
0 |
0 |
0 |
Office of Personnel Management |
2,803 |
1,910 |
8 |
40 |
Office of Special Counsel |
87 |
15 |
0 |
0 |
Overseas Private Investment Corporation |
135 |
61 |
0 |
1 |
Peace Corps |
825 |
15 |
0 |
0 |
Pension Benefit Guaranty Corporation |
516 |
192 |
2 |
3 |
Postal Rate Commission |
0 |
0 |
0 |
0 |
Railroad Retirement Board |
343 |
100 |
0 |
6 |
Securities and Exchange Commission |
3,883 |
648 |
6 |
25 |
Selective Service System |
115 |
4 |
0 |
0 |
Small Business Administration |
3,323 |
328 |
2 |
4 |
Smithsonian Institution* |
- |
- |
- |
- |
Social Security Administration |
10,628 |
4,441 |
23 |
76 |
Tennessee Valley Authority |
0 |
0 |
0 |
0 |
Trade and Development Agency |
40 |
0 |
0 |
0 |
U.S. Holocaust Memorial Museum |
300 |
73 |
0 |
7 |
U.S. Nuclear Waste Technical Review Board |
16 |
15 |
1 |
1 |
U.S. Trade Representative* |
- |
- |
- |
- |
|
|
|
|
|
Totals |
753,770 |
140,694 |
699 |
3,300 |
* Did not report this data in 2004
Status of Agencies with Less than 2 percent Teleworkers
In House Report 107-575 of the Treasury, Postal Service and General Government Appropriations Act, 2003, the conferees
directed OPM "to target executive agencies where less than 2 percent of employees telecommute" (see Appendix C). Of the
13 agencies reported in this category in 2003, only 7 (8%) remain under the 2 percent threshold. Some agencies failed to
submit data, leaving OPM unable to evaluate their progress. OPM and GSA will continue efforts to assist these agencies to
increase their participation rates.
Telework Centers
In Fall 2004, staff of the Washington Metropolitan Telework Centers boosted their current marketing efforts in an attempt to attract a wider audience of Federal agencies and employees. These efforts included the distribution of email information and updates and e-newsletters targeting Federal telework coordinators; direct residential mailings to citizens in the regions the Telework Centers serve; and participation in public events such as "Earth Day" and the Loudoun County, Virginia, Economic Summit. The Telework Centers joined forces with the Metropolitan Washington Council of Governments and placed numerous media advertisements in both local and regional venues such as newspapers, radio stations, cable television stations, websites, and on roadside billboards viewed by tens of thousands of Federal commuters.
A 60-day free trial period for first-time Federal telework center users was offered, and resulted in 35 new Federal Telework Center workers. Twenty-four of these employees continued to use the Center after the trial period ended. As a direct result of the free trial offer, seven new agencies "tested" the use of the Telework Centers as remote worksites for their employees. Additionally, the Telework Center directors gave frequent tours of the Center facilities, and they traveled to various Federal agencies to present information to interested groups of employees and supervisors.
The Telework Centers were represented at all four of the 2004 quarterly Telework Coordinators' Meetings hosted by OPM and GSA, and staff provided updates to the meeting attendees on important trends and events. The Centers were represented at numerous agency-specific events, such as human resources fairs and exhibits, work-life events, and other venues which provided the opportunity to showcase the benefits the Centers had to offer.
During 2004, the Telework Centers were beginning to see a surge of activity as the Continuity of Operations (COOP) planning community considered the valuable part that telework in general, and the Telework Centers specifically, could play during COOP activities and events. During COOP, the Centers can serve as alternative worksites for agency personnel.
Telework Center usage by agency is listed in Table 4.
Table 4: Telework Center Usage by Department /Agency *
Department/Agency |
# of employees 2004 |
# of employees 2003 |
Change |
Total Centers |
2004 Total Fees |
2003 Total Fees |
Change |
Department of Agriculture |
36 |
49 |
-13 |
12 |
$69,512 |
$98,000 |
($28,488) |
Department of Commerce |
42 |
15 |
27 |
13 |
$52,532 |
$20,318 |
$32,214 |
Department of Homeland Security |
11 |
|
|
5 |
$65,514 |
|
|
Department of Defense |
125 |
168 |
-43 |
15 |
$259,706 |
$304,066 |
($44,360) |
Department of Education |
35 |
34 |
1 |
14 |
$91,786 |
$71,139 |
$20,647 |
Department of Energy |
5 |
6 |
-1 |
2 |
$7,548 |
$7,968 |
($420) |
Environmental Protection Agency |
5 |
3 |
2 |
5 |
$11,608 |
$9,916 |
$1,692 |
Federal Emergency Management Agency |
|
1 |
|
|
$720 |
- |
- |
General Services Administration |
29 |
34 |
-5 |
9 |
$77,272 |
$88,620 |
($11,348) |
Department of Health and Human Services |
36 |
32 |
4 |
12 |
$69,598 |
$63,910 |
$5,688 |
House of Representatives |
3 |
3 |
0 |
3 |
$6,408 |
$5,763 |
$645 |
Department of Housing and Urban Development |
2 |
1 |
1 |
2 |
$5,706 |
$5,544 |
$162 |
Department of Interior |
4 |
4 |
0 |
4 |
$3,122 |
$6,496 |
($3,374) |
Department of Justice |
1 |
11 |
-10 |
3 |
$12,240 |
$19,520 |
($7,280) |
Nuclear Regulatory Commission |
1 |
1 |
0 |
1 |
$1,400 |
$1,200 |
$200 |
Office of Government Ethics |
1 |
2 |
-1 |
1 |
$3,600 |
$3,912 |
($312) |
Office Of Personnel Management |
11 |
10 |
1 |
7 |
$30,440 |
$32,678 |
($2,238) |
Securities and Exchange Commission |
1 |
|
|
1 |
$520 |
- |
- |
Department of Transportation |
35 |
45 |
-10 |
12 |
$56,517 |
$66,382 |
($9,865) |
Department of Treasury |
1 |
13 |
-12 |
1 |
$1,296 |
$67,152 |
($65,856) |
Veterans Affairs |
2 |
3 |
-1 |
2 |
$11,040 |
$16,000 |
($4,960) |
Grand Total |
386 |
435 |
-49 |
124 |
$838,085 |
$889,304 |
($51,219) |
| |
Decrease -11.26% |
|
|
|
|
Decrease -5.7% |
* Source for Telework Center Data- General Services Administration
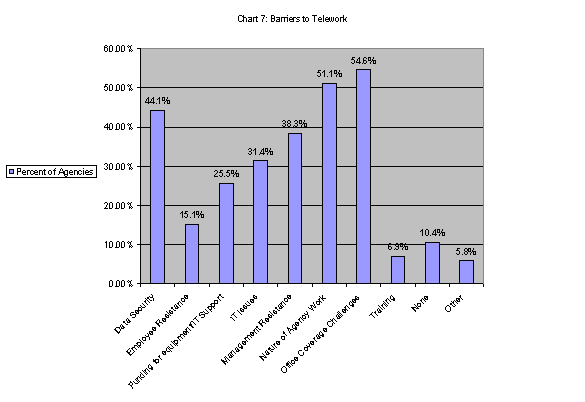
Barriers to Telework
According to survey results, the most prevalent barrier to the successful implementation of telework was office coverage challenges. Next were the nature of the agency's work and data security issues, respectively. These results differ from last year's in that the most prevalent barrier to telework implementation in 2003 was the nature of the agency work, followed by office coverage challenges. The third most prevalent barrier, data security issues, remained third in both 2004 and 2003 (see Chart 7).
To overcome these barriers, OPM and GSA have provided substantial technical assistance to those agencies requesting guidance and consultation (see Chart 8). Additionally, results showed agencies addressed these and other barriers in their organizations using the following techniques:
30 agencies (37%) provided increased opportunities for telework training to employees and managers;
20 agencies (24%) established electronic telework reporting systems;
13 agencies (16%) increased the budget for IT support of telework;
20 agencies (24%) conducted initiatives to increase management support of telework; and
25 agencies (30%) intensified their telework program marketing efforts.
 d
d
 d
d
OPM and GSA Efforts to Promote Telework in 2004
OPM and GSA, as partners in telework, were involved in several projects and began several initiatives which served to further the prevalence and use of telework among Federal employees governmentwide. These initiatives included:
Agency Visits. In an effort to be more proactive, OPM and GSA made several agency visits to discuss telework programs, policies, and practices within the agencies, particularly as they relate to COOP. OPM and GSA understood the value of educating the agencies on using the flexibility that telework offers for COOP and emergency planning. These visits laid the foundation that will continue into the future as OPM and GSA provide additional guidance on integrating telework and COOP planning.
Training. To address the barriers sometimes associated with implementing telework programs, two training sessions are available on www.USALearning.gov. The courses are Telework 101 for Managers: Making Telework Work for You and Telework 101 for Employees: Making Telework Work for You. These sessions provide an overview of telework from the perspective of the supervisor and the organization, and from the perspective of the individual employee.
OPM/GSA Telework Website. This joint website, www.telework.gov , provides employees, telework coordinators and managers with an array of telework resources. In addition to displaying telework laws, the website highlights agency policies, helpful guides for implementation and information about telework centers.
Webinars. Introduced in 2004, webinars offer a unique, interactive venue for highlighting the benefits of resolving the problems associated with telework. Viewed on one's computer and heard through the telephone, webinars are geared to supervisors who are struggling with barriers in implementing telework in their work units. Three webinars were held in 2004, with over 200 supervisors receiving training and feedback on their current and future telework practices.
Quarterly Telework Coordinators Meetings. Used to inform and educate the telework coordinators on important information they need to perform their telework responsibilities, these meetings were used to discuss the annual survey and results, review important new or proposed legislation, network among peers, and share best practices. The average number of attendees was 70.
Conference Presentations. Telework presentations were delivered at two important conferences - International Telework Advisory Council (ITAC) 2004 Annual Conference and the OPM Federal Workforce Conference 2004. The presentation at ITAC was on "Federal Telework Progress, Problems, and Possibilities" focused not only on telework progress and problems, but also on its importance as a flexible tool that supervisors and agencies can use in their COOP planning. The OPM Federal Workforce Conference 2004 presentation provided a general overview of telework in the Federal Government.
Conclusion
OPM and GSA remain committed to advancing telework in the Federal Government. To this end, agency visits and quarterly coordinators meetings will proceed into the future; new resources for agency use will be developed; and consulting and technical assistance will continue. Additionally, we will forge ahead with activities such as presentations at conferences, participation in events, and on-going dialogue at important meetings; and we will develop new strategies to further increase telework within the Federal workforce.
Numerous research studies tout the benefits of telework, and support the notion that telework serves to satisfy individual, organizational, and global objectives. The positive impact telework can have on an employee's reduced commuting time, effort, and costs; increased productivity; and increased control over the delicate act of balancing work and personal responsibilities is tremendous. Benefits to the organization, including the increased ability to recruit and retain valuable employees, gain higher productivity, and experience boosted morale, are clearly documented. Reduced commuting serves to benefit the environment by fewer pollutants being dispersed into the air, and less wear and tear to roads and vehicles.
In summary, the prevalence of telework continues to grow and progress in the Federal Government with over 140,000 eligible Federal employees (19% of the total workforce) taking advantage of the opportunity to work from alternative worksites. Telework is an important human capital tool, presenting agencies with significant opportunities for increased organizational effectiveness. For those Federal agencies maximizing its application, telework can reap substantial benefits when integrated into the routine business practices of the organization.