
2005
Large Truck
Crash Overview
Analysis Division
Federal Motor Carrier Safety Administration
U.S. Department of Transportation
Publication No. FMCSA-RI-07-045
January 2007
The mission of the Federal Motor Carrier Safety Administration (FMCSA) is to promote the safe operation of commercial vehicles on our Nation’s highways. Of all the people killed in motor vehicle crashes in 2005, 12% (5,212) died in crashes that involved a large truck. Another 114,000 people were injured in crashes involving large trucks. Only about 15% of those killed and 24% of those injured in large truck crashes were occupants of large trucks.
Trends
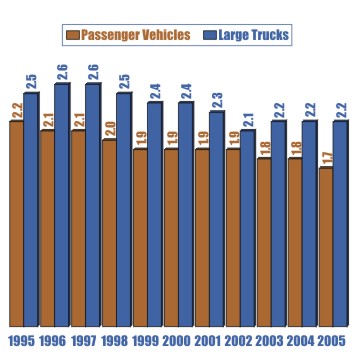
- Fatal Crashes. From 1995 to 2005, the number of large trucks involved in fatal crashes increased from 4,472 to 4,932—up 10%. The number of large trucks in fatal crashes per 100 million vehicle miles traveled declined in these years from 2.5 to 2.2—down 12%. The same rate for passenger vehicles fell from 2.2 to 1.7—down 23% (Figure 1).
Figure 1. Vehicles Involved in Fatal Crashes per 100 Million Vehicle Miles Traveled
- Injury Crashes. From 1995 to 2005, the number of large trucks involved in injury crashes per 100 million vehicle miles traveled declined by 21%, while the rate for passenger vehicles dropped by 36% (Figure 2).
Figure 2. Vehicles Involved in Injury Crashes per 100 Million Vehicle Miles Traveled

Vehicles
- In 2005, large trucks accounted for 7% of all vehicle miles traveled and 3% of all registered vehicles in the United States. In motor vehicle crashes, large trucks represented:
- 8% of vehicles in fatal crashes
- 3% of vehicles in injury crashes
- 5% of vehicles in property-damage-only crashes.
- Large truck tractors pulling semi-trailers accounted for 62% of the large trucks involved in fatal crashes and about one-half of the large trucks involved in nonfatal crashes.
- Doubles (truck tractors pulling a semi-trailer and a full trailer) were only 3% of large trucks involved in fatal crashes and 2% of large trucks involved in nonfatal crashes. Triples (truck tractors pulling three trailers) accounted for 0.1% of all large trucks involved.
- Only 4% of large trucks involved in fatal crashes and 2% of large trucks involved in nonfatal crashes were carrying hazardous materials (HM). HM was released from the cargo compartment in 13% of these crashes.
Drivers
- Only 1% of the drivers of large trucks involved in fatal crashes in 2005 were legally intoxicated (blood alcohol content of 0.08 grams per deciliter or higher), as compared with 22% of passenger car drivers and 21% of light truck drivers in fatal crashes. Only 2% of the drivers of large trucks involved in fatal crashes had any alcohol in their bloodstream.
- Seventy-seven percent of the drivers of large trucks involved in fatal crashes were reported by police as wearing their safety belts, compared with 61% of passenger vehicle drivers involved in fatal crashes.
- In fatal crashes involving large trucks, driver-related factors were cited for 39% of the large truck drivers. In comparison, driver-related factors were noted for 66% of passenger vehicle drivers involved in fatal crashes. Some of the most common factors cited for drivers of large trucks and drivers of passenger vehicles were the same: driving too fast, failure to keep in proper lane, inattention, and failure to yield the right of way.
Crash Environment
- Speeding (exceeding the speed limit or driving too fast for conditions) was a factor in 22% of the fatal crashes involving a large truck, compared with 32% of all fatal crashes.
- No adverse weather conditions were reported for 86% of the fatal crashes and for 88% of the nonfatal crashes involving large trucks. Rain was the most common adverse weather condition.
- For 76% of the fatal crashes and for 69% of the nonfatal crashes involving large trucks, the first harmful event was a collision with another vehicle in transport.
- In two-vehicle fatal rear-end crashes, passenger vehicles struck large trucks in the rear three times more often than large trucks struck passenger vehicles in the rear—16% versus 5% (Figure 3).
Figure 3. Large Trucks Involved in Fatal Crashes with Passenger Vehicles by Crash Type

- In all two-vehicle fatal crashes involving a large truck and a passenger vehicle, the passenger vehicle struck the large truck more often than the reverse—54% versus 40%.
- Rollover was the first harmful event for only 5% of the fatal crashes and only 2% of the nonfatal crashes involving large trucks.
- One-quarter (25%) of fatal crashes that took place in work zones—areas of construction, maintenance, or utility activity—involved a large truck.
Definitions
Large Trucks: Trucks over 10,000 pounds gross vehicle weight rating (GVWR).
Passenger Vehicles: Passenger cars and light trucks—such as vans, sport utility vehicles, and pickup trucks—with 10,000 pounds GVWR or less.
Data Sources
Fatal Crash Data: National Highway Traffic Safety Administration, Fatality Analysis Reporting System (FARS).
Nonfatal Crash Data: National Highway Traffic Safety Administration, General Estimates System (GES); and FMCSA, Motor Carrier Management Information System (MCMIS) crash file.
Vehicle Miles Traveled: Federal Highway Administration.
For more information, contact the Analysis Division at (202) 366-0324, or visit our web sites at www.fmcsa.dot.gov and ai.fmcsa.dot.gov.
MC-RAA/12(5M)EV
|
 Print
Print