
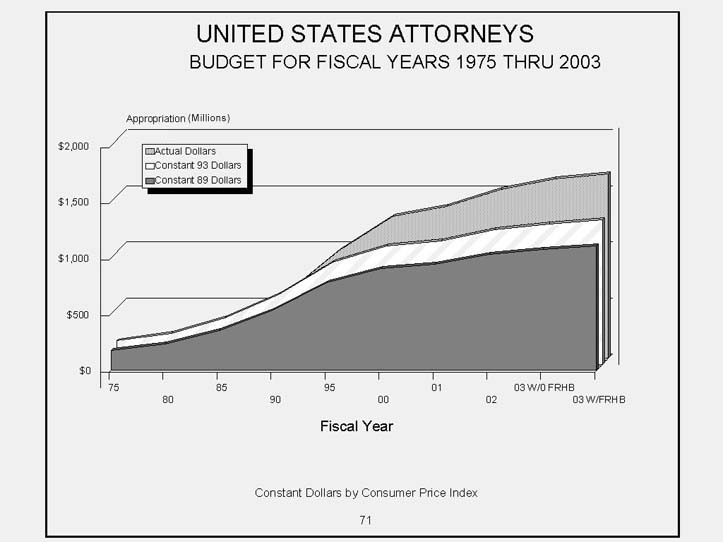
| U.S. ATTORNEYS BUDGET* 1975 - 2003 |
|||||||||||||
| FISCAL YEAR | POSITIONS | USA BUDGET (Millions) |
CPI INDEXED TO 1993 |
USA BUDGET IN 1993 $ (Millions) |
USA BUDGET REAL PERCENT GROWTH FROM 1993 |
USA BUDGET APPARENT PERCENT GROWTH FROM 1993 |
|||||||
|---|---|---|---|---|---|---|---|---|---|---|---|---|---|
| 1975 | 3,067 | 77.8 | 37.4 | 208.0 | -76.2 | -91.1 | |||||||
| 1976 | 3,394 | 89.7 | 39.6 | 226.7 | -74.1 | -89.7 | |||||||
| 1977 | 3,545 | 104.0 | 42.1 | 247.0 | -71.8 | -88.1 | |||||||
| 1978 | 3,687 | 117.4 | 45.3 | 258.9 | -70.4 | -86.6 | |||||||
| 1979 | 3,757 | 128.9 | 50.4 | 255.5 | -70.8 | -85.3 | |||||||
| 1980 | 4,394 | 155.2 | 57.3 | 271.0 | -69.0 | -82.3 | |||||||
| 1981 | 4,417 | 177.9 | 63.2 | 281.5 | -67.8 | -79.7 | |||||||
| 1982 | 4,527 | 198.3 | 67.1 | 295.6 | -66.2 | -77.3 | |||||||
| 1983 | * | 4,685 | 239.2 | 69.2 | 345.5 | -60.5 | -72.7 | ||||||
| 1984 | * | 4,753 | 271.3 | 72.2 | 375.8 | -57.0 | -69.0 | ||||||
| 1985 | 5,723 | 306.3 | 74.8 | 409.7 | -53.2 | -65.0 | |||||||
| 1986 | 5,823 | 307.9 | 76.2 | 404.1 | -53.8 | -64.8 | |||||||
| 1987 | 5,958 | 357.3 | 79.0 | 452.4 | -48.3 | -59.2 | |||||||
| 1988 | 5,958 | 380.3 | 82.1 | 463.0 | -47.1 | -56.5 | |||||||
| 1989 | 6,730 | 460.2 | 85.9 | 535.6 | -38.8 | -47.4 | |||||||
| 1990 | * | 7,961 | 564.1 | 91.2 | 618.8 | -29.3 | -35.5 | ||||||
| 1991 | * @ | 8,434 | 741.6 | 94.5 | 784.5 | -10.3 | -15.2 | ||||||
| 1992 | * | 8,418 | 808.2 | 97.4 | 830.0 | -5.1 | -7.6 | ||||||
| 1993 | * & % | 8,362 | 875.0 | 100.0 | 875.0 | 0.0 | 0.0 | ||||||
| 1994 | * $ % | 8,239 | 896.5 | 103.0 | 870.4 | -0.5 | 2.5 | ||||||
| 1995 | * V % | 8,302 | 956.1 | 105.6 | 905.6 | 3.5 | 9.3 | ||||||
| 1996 | * V % B | 8,595 | 1,014.9 | 108.7 | 933.3 | 6.7 | 16.0 | ||||||
| 1997 | * V % C | 8,652 | 1,069.0 | 111.1 | 961.9 | 9.9 | 22.2 | ||||||
| 1998 | * V % | 8,948 | 1,119.3 | 112.8 | 992.3 | 13.4 | 27.9 | ||||||
| 1999 | * V Y % | 9,044 | 1,216.7 | 115.7 | 1,051.3 | 20.1 | 39.0 | ||||||
| 2000 | * V % R | 9,120 | 1,261.7 | 119.8 | 1,053.3 | 20.4 | 44.2 | ||||||
| 2001 | * % R | 9,439 | 1,349.3 | 122.9 | 1,097.9 | 25.5 | 54.2 | ||||||
| 2002 | * D | 9,962 | 1500 | 125.1 | 1,198.9 | 37.0 | 71.4 | ||||||
| 2003 W/O FRHB | * | 9,990 | 1,598.4 | 127.9 | 1,250.1 | 42.9 | 82.7 | ||||||
| 2003 W/ FRHB | * | 9,990 | 1,642.9 | 127.9 | 1,284.5 | 46.8 | |||||||
| U.S. ATTORNEYS BUDGET* 1975 - 2003 |
|||||||||||||
| FISCAL YEAR |
POSITIONS | USA BUDGET (Millions) |
CPI INDEXED TO 1989 |
USA BUDGET IN 1989 $ (Millions) |
USA BUDGET REAL PERCENT GROWTH FROM 1989 |
USA BUDGET APPARENT PERCENT GROWTH FROM 1989 |
|||||||
|---|---|---|---|---|---|---|---|---|---|---|---|---|---|
| 1975 | 3,067 | 77.8 | 43.5 | 178.7 | -61.2 | -83.1 | |||||||
| 1976 | 3,394 | 89.7 | 46.0 | 194.8 | -57.7 | -80.5 | |||||||
| 1977 | 3,545 | 104.0 | 49.0 | 212.2 | -53.9 | -77.4 | |||||||
| 1978 | 3,687 | 117.4 | 52.8 | 222.5 | -51.7 | -74.5 | |||||||
| 1979 | 3,757 | 128.9 | 58.7 | 219.6 | -52.3 | -72.0 | |||||||
| 1980 | 4,394 | 155.2 | 66.6 | 232.9 | -49.4 | -66.3 | |||||||
| 1981 | 4,417 | 177.9 | 73.6 | 241.8 | -47.4 | -61.3 | |||||||
| 1982 | 4,527 | 198.3 | 78.1 | 254.0 | -44.8 | -56.9 | |||||||
| 1983 | * | 4,685 | 239.2 | 80.6 | 296.8 | -35.5 | -48.0 | ||||||
| 1984 | * | 4,753 | 271.3 | 84.0 | 322.9 | -29.8 | -41.0 | ||||||
| 1985 | 5,723 | 306.3 | 87.0 | 352.0 | -23.5 | -33.4 | |||||||
| 1986 | 5,823 | 307.9 | 88.7 | 347.2 | -24.6 | -33.1 | |||||||
| 1987 | 5,958 | 357.3 | 91.9 | 388.7 | -15.5 | -22.4 | |||||||
| 1988 | 5,958 | 380.3 | 95.6 | 397.8 | -13.6 | -17.4 | |||||||
| 1989 | 6,730 | 460.2 | 100.0 | 460.2 | 0.0 | 0.0 | |||||||
| 1990 | * | 7,961 | 564.1 | 106.1 | 531.6 | 15.5 | 22.6 | ||||||
| 1991 | * @ | 8,434 | 741.6 | 110.0 | 674.1 | 46.5 | 61.2 | ||||||
| 1992 | * | 8,418 | 808.2 | 113.3 | 713.1 | 55.0 | 75.6 | ||||||
| 1993 | * & % | 8,362 | 875.0 | 116.4 | 751.8 | 63.4 | 90.1 | ||||||
| 1994 | * $ % | 8,239 | 896.5 | 119.9 | 747.8 | 62.5 | 94.8 | ||||||
| 1995 | * V % | 8,302 | 956.1 | 122.9 | 778.1 | 69.1 | 107.8 | ||||||
| 1996 | * V % B | 8,595 | 1,014.9 | 126.6 | 801.9 | 74.3 | 120.5 | ||||||
| 1997 | * V % C | 8,652 | 1,069.0 | 129.3 | 826.5 | 79.6 | 132.3 | ||||||
| 1998 | * V % | 8,948 | 1,119.3 | 131.3 | 852.6 | 85.3 | 143.2 | ||||||
| 1999 | * V Y % | 9,044 | 1,216.7 | 134.7 | 903.3 | 96.3 | 164.4 | ||||||
| 2000 | * V % R | 9,120 | 1,261.7 | 139.4 | 905.0 | 96.7 | 174.2 | ||||||
| 2001 | * % R | 9,439 | 1,349.3 | 143.0 | 943.3 | 105.0 | 193.2 | ||||||
| 2002 | * D | 9,962 | 1500 | 145.6 | 1,030.1 | 123.8 | 225.9 | ||||||
| 2003 W/O FRHB | * | 9,990 | 1,598.4 | 148.8 | 1,074.1 | 133.4 | 247.3 | ||||||
| 2003 W/ FRHB | * | 9,990 | 1,642.9 | 148.8 | 1,104.0 | 139.9 | 257.0 | ||||||