|
 d
d
 d
d
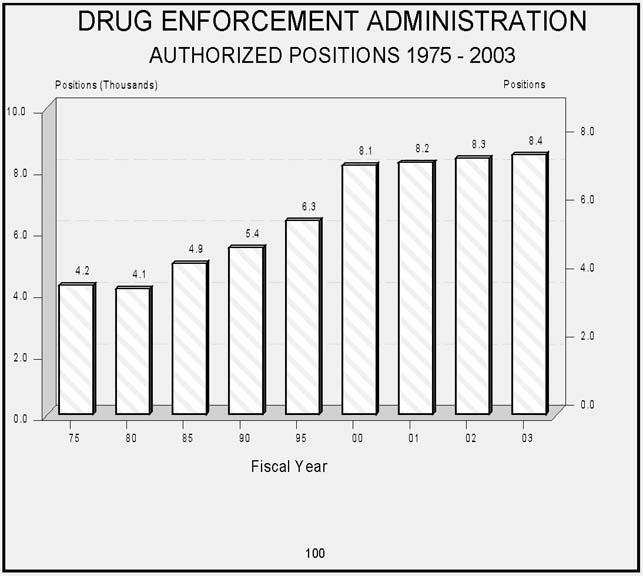
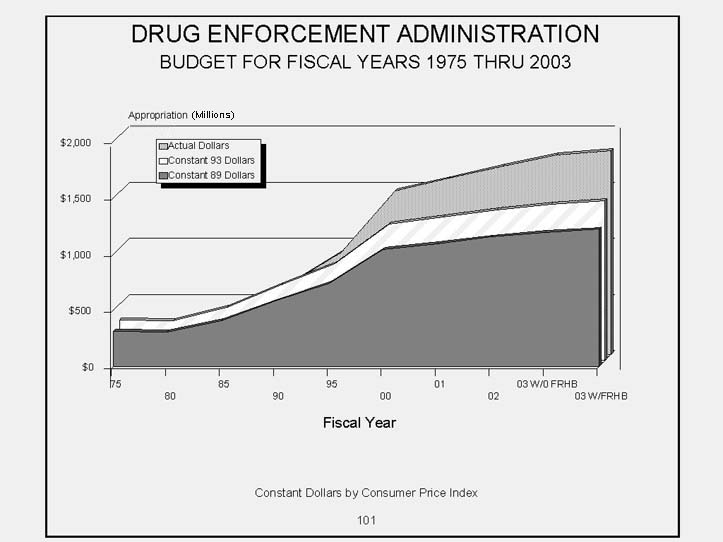
DRUG ENFORCEMENT ADMINISTRATION
BUDGET
1975 - 2003
|
| FISCAL YEAR |
|
POSITIONS |
DEA BUDGET
(Millions) |
CPI INDEXED
TO 1993 |
DEA BUDGET
IN 1993 $
(Millions) |
DEA BUDGET
REAL PERCENT
GROWTH
FROM 1993 |
DEA BUDGET
APPARENT PERCENT
GROWTH
FROM 1993 |
| |
|
|
|
|
|
|
|
|
|
|
|
|
|
| 1975 |
|
4,186 |
|
$135.7 |
|
37.4 |
|
362.8 |
|
-57.5 |
|
-84.1 |
|
| 1976 |
|
4,263 |
|
155.0 |
|
39.6 |
|
391.8 |
|
-54.1 |
|
-81.8 |
|
| 1977 |
|
4,365 |
|
168.2 |
|
42.1 |
|
399.4 |
|
-53.2 |
|
-80.3 |
|
| 1978 |
|
4,365 |
|
188.3 |
|
45.3 |
|
415.3 |
|
-51.4 |
|
-77.9 |
|
| 1979 |
|
4,213 |
|
193.7 |
|
50.4 |
|
384.0 |
|
-55.0 |
|
-77.3 |
|
| 1980 |
|
4,074 |
|
204.0 |
|
57.3 |
|
356.2 |
|
-58.3 |
|
-76.1 |
|
| 1981 |
|
4,092 |
|
216.2 |
|
63.2 |
|
342.1 |
|
-59.9 |
|
-74.7 |
|
| 1982 |
|
3,953 |
|
241.7 |
|
67.1 |
|
360.3 |
|
-57.8 |
|
-71.7 |
|
| 1983 |
* |
3,953 |
|
280.5 |
|
69.2 |
|
405.1 |
|
-52.5 |
|
-67.1 |
|
| 1984 |
* |
4,083 |
|
324.5 |
|
72.2 |
|
449.5 |
|
-47.3 |
|
-62.0 |
|
| 1985 |
|
4,906 |
|
353.8 |
|
74.8 |
|
473.2 |
|
-44.6 |
|
-58.6 |
|
| 1986 |
|
4,895 |
|
363.7 |
|
76.2 |
|
477.3 |
|
-44.1 |
|
-57.4 |
|
| 1987 |
|
5,680 |
|
490.2 |
|
79.0 |
|
620.6 |
|
-27.3 |
|
-42.6 |
|
| 1988 |
|
5,710 |
|
494.1 |
|
82.1 |
|
601.5 |
|
-29.5 |
|
-42.1 |
|
| 1989 |
|
5,896 |
|
534.5 |
|
85.9 |
|
622.1 |
|
-27.1 |
|
-37.4 |
|
| 1990 |
* |
5,407 |
|
617.3 |
|
91.2 |
|
677.1 |
|
-20.7 |
|
-27.7 |
|
| 1991 |
* |
6,077 |
|
788.9 |
|
94.5 |
|
834.5 |
|
-2.3 |
|
-7.6 |
|
| 1992 |
* |
6,208 |
|
825.1 |
|
97.4 |
|
847.4 |
|
-0.7 |
|
-3.4 |
|
| 1993 |
* @ |
6,027 |
|
853.7 |
|
100.0 |
|
853.7 |
|
0.0 |
|
0.0 |
|
| 1994 |
* # |
5,933 |
|
886.4 |
|
103.0 |
|
860.5 |
|
0.8 |
|
3.8 |
|
| 1995 |
* # |
6,287 |
|
910.0 |
|
105.6 |
|
861.9 |
|
1.0 |
|
6.6 |
|
| 1996 |
* #
V |
6,365 |
|
963.8 |
|
108.7 |
|
886.3 |
|
3.8 |
|
12.9 |
|
| 1997 |
* #
V |
6,829 |
|
1,172.0 |
|
111.1 |
|
1,054.5 |
|
23.5 |
|
37.3 |
|
| 1998 |
* #
V |
7,387 |
|
1,312.0 |
|
112.8 |
|
1,163.1 |
|
36.2 |
|
53.7 |
|
| 1999 |
* #
V Y |
8,022 |
|
1,415.5 |
|
115.7 |
|
1,223.1 |
|
43.3 |
|
65.8 |
|
| 2000 |
*
# V
R |
8,095 |
|
1,456.4 |
|
119.8 |
|
1,215.8 |
|
42.4 |
|
70.6 |
|
| 2001 |
* #
R |
8,176 |
|
1,568.0 |
|
122.9 |
|
1,275.8 |
|
49.4 |
|
83.7 |
|
| 2002 |
* # |
8,310 |
|
1,679.2 |
|
125.1 |
|
1,342.2 |
|
57.2 |
|
96.7 |
|
| 2003 W/O FRHB |
* # |
8,426 |
|
1,780.0 |
|
127.9 |
|
1,392.1 |
|
63.1 |
|
108.5 |
|
| 2003 W/ FRHB |
* # |
8,426 |
|
1,819.0 |
|
127.9 |
|
1,422.2 |
|
66.6 |
|
113.1 |
|
| |
| Footnote: |
| * |
Includes ICDE Dollars, appropriated separately. Does
not include ICDE reimbursable positions. In 2000, includes 1000 positions
and $103,996,000 |
| @ |
Includes $2,575,000 from the Assets Forfeiture Fund
Capital Surplus, $13,094,000 from High Intensity Drug Trafficking
Areas' (HIDTA) funds, $12,000,000 from Diversion Control Fees and
$2,000,000 from the Office of National Drug Control Policy's Special
Forfeiture Fund. |
| # |
1994 includes 525 FTE and $47,871,000 from Diversion
Control Fees, $13,334,000 from High Intensity Drug Trafficking Areas'
funds. and $4,000,000 from the Office of National Drug Control Policy's
Special Forfeiture Fund.
1995 includes 536 FTE and $43,107,000 from Diversion Control Fees,
and $15,015.000 from HIDTA funds.
1996 includes 591 FTE and $47,189,000 from Diversion Control Fees,
and $13,539,000 from HIDTA funds.
1997 includes 594 FTE and $52,824,000 from Diversion Control Fees,
and $13,278,000 from HIDTA funds.
1998 includes 613 FTE and $58,268,000 from Diversion Control Fees,
and $15,539,000 from HIDTA funds.
1999 includes 631 FTE and $76,710,000 from Diversion Control Fees,
16,005,000 from HIDTA funds, and the transfer out of $4,225,000 for
Japanese Redress Payments (which was reimbursed from the WCF unobligated
balance).
2000 includes 643 FTE and $74,121,000 from Diversion Control Fees;
$17,017,530 from HIDTA funds, and $300,500 from USAID.
2001 includes 656 FTE and $83,543,000 from Diversion Control Fees,
and $17,270,000 from, HIDTA funds.
2002 includes 656 FTE and $86,021,000 from Diversion Control Fees.
2003 without FRHB includes 722 FTE and $113,645,000 from Diversion
Control Fees, 2003 with FRHB includes 722 FTE and $116,462,000. |
| V |
Includes positions and dollars from the Violent
Crime Reduction Programs. See page 126 for details. |
| Y |
1999 reflects the reduction of $1,967,000 offset
by the transfer of $10,278,000 for Y2K requirements. |
| R |
2000 includes the DEA portion, $24,000 of the government-wide
recission of 0.38 percent pursuant to P.L. 106-113. 2001 includes
$2,999,000 for the government-wide rescission of 0.22 percent pursuant
to P.L. 106-554. |
| |
|
| Page 102 |
|
DRUG ENFORCEMENT ADMINISTRATION
BUDGET
1975 - 2003
|
| FISCAL YEAR |
|
POSITIONS |
DEA BUDGET
(Millions) |
CPI INDEXED
TO 1989 |
DEA BUDGET
IN 1989 $
(Millions) |
DEA BUDGET
REAL PERCENT
GROWTH
FROM 1989 |
DEA BUDGET
APPARENT PERCENT
GROWTH
FROM 1989 |
|
|
|
|
|
|
|
|
|
|
|
|
|
|
| 1975 |
|
4,186 |
|
$135.7 |
|
43.5 |
|
$311.7 |
|
-41.7 |
|
-74.6 |
|
| 1976 |
|
4,263 |
|
155.0 |
|
46.0 |
|
336.6 |
|
-37.0 |
|
-71.0 |
|
| 1977 |
|
4,365 |
|
168.2 |
|
49.0 |
|
343.2 |
|
-35.8 |
|
-68.5 |
|
| 1978 |
|
4,365 |
|
188.3 |
|
52.8 |
|
356.8 |
|
-33.2 |
|
-64.8 |
|
| 1979 |
|
4,213 |
|
193.7 |
|
58.7 |
|
329.9 |
|
-38.3 |
|
-63.8 |
|
| 1980 |
|
4,074 |
|
204.0 |
|
66.6 |
|
306.1 |
|
-42.7 |
|
-61.8 |
|
| 1981 |
|
4,092 |
|
216.2 |
|
73.6 |
|
293.9 |
|
-45.0 |
|
-59.6 |
|
| 1982 |
|
3,953 |
|
241.7 |
|
78.1 |
|
309.6 |
|
-42.1 |
|
-54.8 |
|
| 1983 |
* |
3,953 |
|
280.5 |
|
80.6 |
|
348.1 |
|
-34.9 |
|
-47.5 |
|
| 1984 |
* |
4,083 |
|
324.5 |
|
84.0 |
|
386.3 |
|
-27.7 |
|
-39.3 |
|
| 1985 |
|
4,906 |
|
353.8 |
|
87.0 |
|
406.6 |
|
-23.9 |
|
-33.8 |
|
| 1986 |
|
4,895 |
|
363.7 |
|
88.7 |
|
410.1 |
|
-23.3 |
|
-32.0 |
|
| 1987 |
|
5,680 |
|
490.2 |
|
91.9 |
|
533.3 |
|
-0.2 |
|
-8.3 |
|
| 1988 |
|
5,710 |
|
494.1 |
|
95.6 |
|
516.8 |
|
-3.3 |
|
-7.6 |
|
| 1989 |
|
5,896 |
|
534.5 |
|
100.0 |
|
534.5 |
|
0.0 |
|
0.0 |
|
| 1990 |
* |
5,407 |
|
617.3 |
|
106.1 |
|
581.8 |
|
8.8 |
|
15.5 |
|
| 1991 |
* |
6,077 |
|
788.9 |
|
110.0 |
|
717.0 |
|
34.1 |
|
47.6 |
|
| 1992 |
* |
6,208 |
|
825.1 |
|
113.3 |
|
728.1 |
|
36.2 |
|
54.4 |
|
| 1993 |
* @ |
6,027 |
|
853.7 |
|
116.4 |
|
733.5 |
|
37.2 |
|
59.7 |
|
| 1994 |
*
# |
5,933 |
|
886.4 |
|
119.9 |
|
739.4 |
|
38.3 |
|
65.8 |
|
| 1995 |
* # |
6,287 |
|
910.0 |
|
122.9 |
|
740.6 |
|
38.6 |
|
70.3 |
|
| 1996 |
* #
V |
6,365 |
|
963.8 |
|
126.6 |
|
761.6 |
|
42.5 |
|
80.3 |
|
| 1997 |
* #
V |
6,829 |
|
1,172.0 |
|
129.3 |
|
906.1 |
|
69.5 |
|
119.3 |
|
| 1998 |
* #
V |
7,387 |
|
1,312.0 |
|
131.3 |
|
999.3 |
|
87.0 |
|
145.5 |
|
| 1999 |
* #
V Y |
8,022 |
|
1,415.5 |
|
134.7 |
|
1,050.9 |
|
96.6 |
|
164.8 |
|
| 2000 |
*
# V
R |
8,095 |
|
1,456.4 |
|
139.4 |
|
1,044.7 |
|
95.4 |
|
172.5 |
|
| 2001 |
* #
R |
8,176 |
|
1,568.0 |
|
143.0 |
|
1,096.2 |
|
105.1 |
|
193.4 |
|
| 2002 |
* # |
8,310 |
|
1,679.2 |
|
145.6 |
|
1,153.2 |
|
115.8 |
|
214.2 |
|
| 2003 W/O FRHB |
* # |
8,426 |
|
1,780.0 |
|
148.8 |
|
1,196.1 |
|
123.8 |
|
233.0 |
|
| 2003 W/ FRHB |
* # |
8,426 |
|
1,819.0 |
|
148.8 |
|
1,222.3 |
|
128.7 |
|
240.3 |
|
|
| Footnote: |
| * |
Includes ICDE Dollars, appropriated separately. Does
not include ICDE reimbursable positions. In 2000, includes 1000 positions
and $103,996,000 |
| @ |
Includes $2,575,000 from the Assets Forfeiture Fund
Capital Surplus, $13,094,000 from High Intensity Drug Trafficking
Areas' (HIDTA) funds, $12,000,000 from Diversion Control Fees and
$2,000,000 from the Office of National Drug Control Policy's Special
Forfeiture Fund. |
| # |
1994 includes 525 FTE and $47,871,000 from Diversion
Control Fees, $13,334,000 from High Intensity Drug Trafficking Areas'
funds. and $4,000,000 from the Office of National Drug Control Policy's
Special Forfeiture Fund.
1995 includes 536 FTE and $43,107,000 from Diversion Control Fees,
and $15,015.000 from HIDTA funds.
1996 includes 591 FTE and $47,189,000 from Diversion Control Fees,
and $13,539,000 from HIDTA funds.
1997 includes 594 FTE and $52,824,000 from Diversion Control Fees,
and $13,278,000 from HIDTA funds.
1998 includes 613 FTE and $58,268,000 from Diversion Control Fees,
and $15,539,000 from HIDTA funds.
1999 includes 631 FTE and $76,710,000 from Diversion Control Fees,
16,005,000 from HIDTA funds, and the transfer out of $4,225,000 for
Japanese Redress Payments (which was reimbursed from the WCF unobligated
balance).
2000 includes 643 FTE and $74,121,000 from Diversion Control Fees;
$17,017,530 from HIDTA funds, and $300,500 from USAID.
2001 includes 656 FTE and $83,543,000 from Diversion Control Fees,
and $17,270,000 from, HIDTA funds.
2002 includes 656 FTE and $86,021,000 from Diversion Control Fees.
2003 without FRHB includes 722 FTE and $113,645,000 from Diversion
Control Fees, 2003 with FRHB includes 722 FTE and $116,462,000. |
| V |
Includes positions and dollars from the Violent
Crime Reduction Programs. See page 126 for details. |
| Y |
1999 reflects the reduction of $1,967,000 offset
by the transfer of $10,278,000 for Y2K requirements. |
| R |
2000 includes the DEA portion, $24,000 of the government-wide
recission of 0.38 percent pursuant to P.L. 106-113. 2001 includes
$2,999,000 for the government-wide rescission of 0.22 percent pursuant
to P.L. 106-554. |
| |
|
| |
Page 103 |
|
|