The U.S. Equal Employment Opportunity Commission
DIVERSITY IN THE MEDIA:
A CHART BOOK FOR SELECTED INDUSTRIES
PREFACE
This chart book responds to the public's request for data
regarding diversity in employment among some of the key media
industries in the nation. The data provided here can be used by
employers in these industries to evaluate their employment
practices. This effort is consistent with the emphasis on proactive
prevention in the Commission's Five Point Plan. These data
come from EEO-1 reports filed in 2002 and information for the three
industry groups are based on the North American Industrial
Classification System. This publication provides a brief graphical
overview of the three industry groups:
- Newspaper/Periodical/Book/Database Publishers
- Radio and Television Broadcasting
- Cable Networks and Program Distribution
Graphs are followed by data tables displaying detailed
employment statistics for each of these industry groups nationwide
and for the ten most populous metropolitan areas.(1) The areas are, in order of population:
New York, Los Angeles, Chicago, Philadelphia, Dallas, Miami,
Washington, Houston, Detroit and Boston. Data regarding these most
important "markets" seem particularly important in these
industries. (Note that, in some metropolitan areas, it was not
possible to provide data for each industry group due to
confidentiality restrictions.)
The EEOC encourages readers to utilize this chart book as one
resource ensuring that the diversity of America's workers is
effectively utilized in the industries examined.
EXECUTIVE SUMMARY
- Newspaper publishing and broadcasting have a similar proportion
of employees of color; cable networks and distributors show greater
diversity in this respect.
- Women and men of color are similarly employed.
- African American employment is higher in the cable industry
than in the other two media industry groups. Hispanic employment is
also higher in the cable industry but the difference is not as
dramatic.
- Asian American employment is relatively uniform with slightly
lower employment in broadcasting.
Newspaper/Periodical/Book/Database Publishers (Publishing)
- For both African Americans and Hispanics the proportion of
professionals and officials and managers are similar but there are
more than twice as many Asian professionals as Asian officials and
managers.
- African Americans and Hispanics are more highly represented in
the lower paying job groups.
Radio and Television Broadcasting (Broadcasting)
- In broadcasting, in contrast to publishing, Asian employment as
officials and managers is similar to their employment as
professionals. Larger disparities in employment between the two job
groups can be seen for African Americans and Hispanics.
- African American and Hispanic employment is fairly similar in
all job groups except operatives and service workers with a much
higher proportion of African Americans.
Cable Networks and Program Distribution (Cable)
- As in the publishing industry, the disparities between Asian
American employment as officials and managers and as professionals
is much greater that those observed for other minority groups.
- While Hispanic employment as officials and managers is
consistent between the broadcasting and cable industries, African
American employment in this job group increases from 7.7 percent in
broadcasting to 10.9 percent in the cable industry.
Top Metropolitan Area and Industry Groups for People of Color
- When examining the top ten metropolitan areas and examined
media industries, the top five areas and markets (based on percent
of employment) for people of color with respect to total employment
are: Miami and cable (70.5 percent), Miami and broadcasting (61.9
percent), Los Angeles and cable (50.5 percent), Washington, D.C.
and cable (47.1 percent) and Los Angeles and publishing (46.1
percent).
- The top five areas for women of color with respect to total
employment are: Miami and broadcasting (26.0 percent), Miami and
cable (25.6 percent), Los Angeles and publishing (20.2 percent),
Washington, D.C. and cable (20.2 percent) and Los Angeles and cable
(19.5 percent).
- The top five areas for people of color with respect to
employment as officials and managers are: Miami and cable (56.5
percent), Miami and broadcasting (46.1 percent), Houston and
broadcasting (31.7 percent), Los Angeles and cable (30.7 percent)
and Miami and publishing (28.4 percent).
- The top five areas for women of color with respect to
employment as officials and managers are: Miami and cable (23.9
percent), Miami and broadcasting (21.9 percent), Washington, D.C.
and broadcasting (15.9 percent), Los Angeles and broadcasting (14.1
percent) and Houston and broadcasting (13.7 percent).
- The top five areas for African Americans with respect to total
employment are: Washington, D.C. and cable (34.7 percent), Miami
and cable (28.5 percent), Washington, D.C. and broadcasting (27.2
percent), Detroit and broadcasting (24.8 percent) and New York and
cable (21.8 percent). With respect to employment as officials and
managers the top areas are: Washington, D.C. and broadcasting (20.9
percent), Washington, D.C. and cable (18.9 percent), Miami and
cable (15.7 percent), Detroit and broadcasting (14.7 percent) and
Dallas and broadcasting (12.3 percent).
- The top five areas for Hispanics with respect to total
employment are: Miami and broadcasting (52.0 percent), Miami and
cable (40.5 percent), Los Angeles and publishing (27.9 percent),
Los Angeles and cable (25.5 percent) and Houston and broadcasting
(23.6 percent). With respect to employment as officials and
managers the top areas are: Miami and broadcasting, cable and
publishing respectively at 39.9 percent, 38.9 percent and 18.9
percent, Houston and broadcasting (18.5 percent) and Los Angeles
and publishing (13.3 percent).
- The top five areas for Asians with respect to total employment
are: Los Angeles and cable, publishing and broadcasting
respectively at 10.6 percent, 8.6 percent and 6.9 percent, New York
and publishing (5.8 percent) and Washington, D.C. and cable (5.7 percent).
With respect to employment as officials and managers the top areas
are: Los Angeles and cable, broadcasting and publishing
respectively at 8.3 percent, 6.1 percent and 5.6 percent, New York
cable and publishing respectively at 4.3 percent and 3.8
percent.
- The top five areas for Native Americans with respect to total
employment are: Los Angeles and broadcasting (0.8 percent), Dallas
and broadcasting (0.7 percent), Los Angeles and cable (0.6
percent), Dallas and publishing (0.4 percent) and Houston and broadcasting (0.4
percent). With respect to employment as officials and managers the
top areas are: Los Angeles and broadcasting (1.1 percent), Dallas
and broadcasting (0.9 percent), Miami and cable (0.7 percent),
Detroit and broadcasting (0.5 percent) and Los Angeles and cable
(0.5 percent).
DIVERSITY BY INDUSTRY GROUP
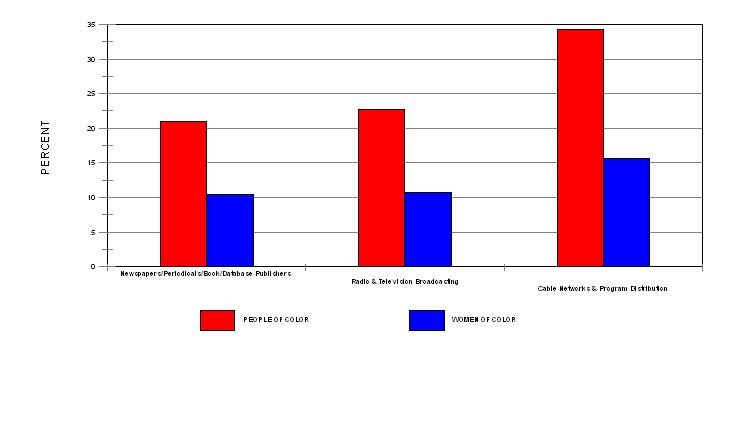
| Industry Group |
People of Color |
Women of Color |
| (Percentages) |
| Newspapers/Periodicals/Book/Database Publishers |
21.0 |
10.5 |
| Radio & Television Broadcasting |
22.7 |
10.7 |
| Cable Networks & Program Distribution |
34.3 |
15.6 |
- Newspaper publishing and broadcasting have a similar proportion
of employees of color.
- Cable networks and distributors show greater diversity in this
respect.
- Women and men of color are similarly employed.
RACE/ETHNICITY BY INDUSTRY GROUP
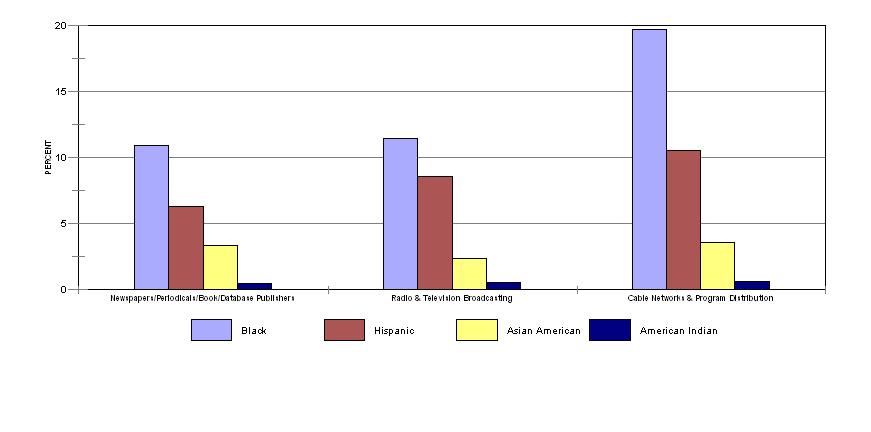
| Race/Ethnic Group |
Newspapers/Periodicals/Book/ Database
Publishers |
Radio & Television Broadcasting |
Cable Networks & Program Distribution |
| Black |
10.9 |
11.4 |
19.7 |
| Hispanic |
6.3 |
8.5 |
10.5 |
| Asian American |
3.3 |
2.3 |
3.5 |
| American Indian |
0.4 |
0.5 |
0.6 |
- African American employment is higher in the cable industry
than in the other two media industry groups. Hispanic employment is
also higher in the cable industry but the difference is not as
dramatic.
- Asian American employment is relatively uniform with slightly
lower employment in broadcasting.
NEWSPAPERS/PERIODICALS/BOOK/DATABASE PUBLISHERS
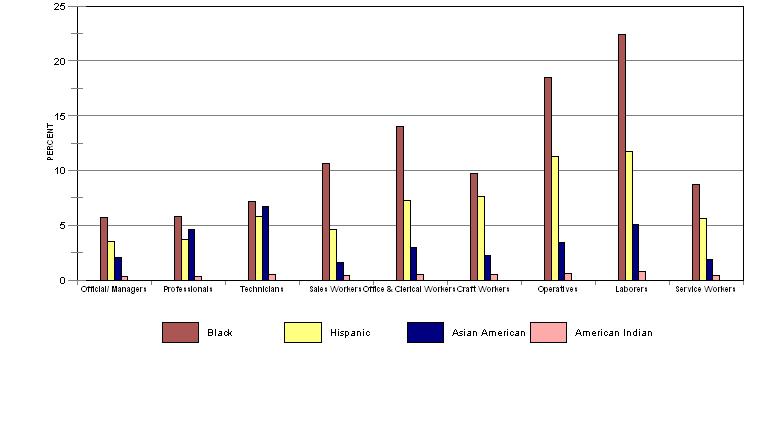
| Race/Ethnic Group |
Officials/Managers |
Professionals |
Technicians |
Sales Workers |
Office & Clerical Workers |
Craft Workers |
Operatives |
Laborers |
Service Workers |
| Black |
5.7 |
5.8 |
7.2 |
10.6 |
14.0 |
9.7 |
18.5 |
22.4 |
8.7 |
| Hispanic |
3.5 |
3.7 |
5.8 |
4.6 |
7.3 |
7.6 |
11.3 |
11.7 |
5.6 |
| Asian American |
2.1 |
4.6 |
6.7 |
1.6 |
3.0 |
2.2 |
3.4 |
5.1 |
1.9 |
| American Indian |
0.3 |
0.3 |
0.5 |
0.4 |
0.5 |
0.5 |
0.6 |
0.8 |
0.4 |
- For both African Americans and Hispanics the proportion of
professionals and officials and managers are similar but there are
more than twice as many Asian professionals as Asian officials and
managers.
- African Americans and Hispanics are more highly represented in
the lower paying job groups.
RADIO & TELEVISION BROADCASTING
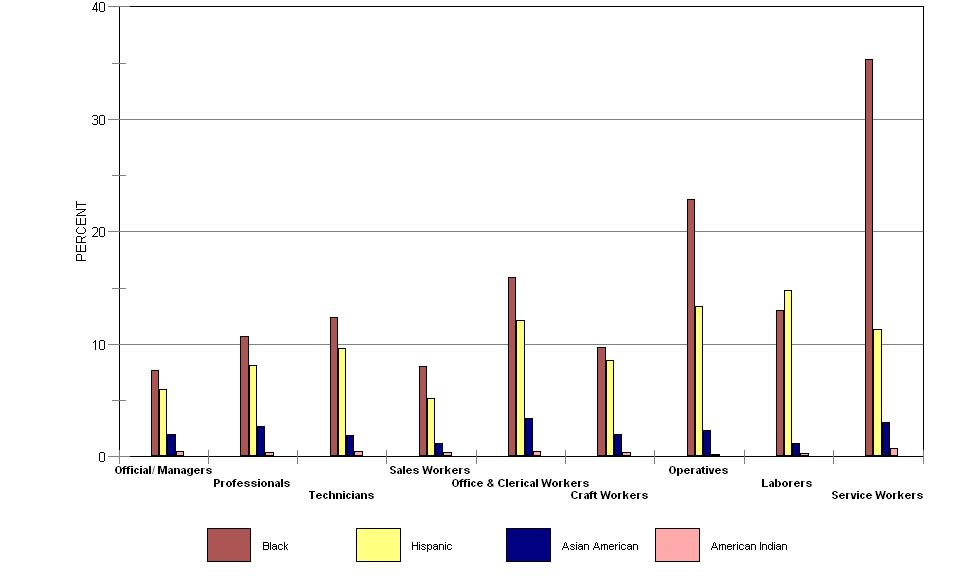
| Race/Ethnic Group |
Officials/Managers |
Professionals |
Technicians |
Sales Workers |
Office & Clerical Workers |
Craft Workers |
Operatives |
Laborers |
Service Workers |
| Black |
7.7 |
10.7 |
12.4 |
8.0 |
15.9 |
9.7 |
22.9 |
13.0 |
35.3 |
| Hispanic |
6.0 |
8.1 |
9.6 |
5.2 |
12.1 |
8.5 |
13.4 |
14.8 |
11.3 |
| Asian American |
2.0 |
2.7 |
1.9 |
1.2 |
3.4 |
2.0 |
2.3 |
1.2 |
3.0 |
| American Indian |
0.5 |
0.4 |
0.5 |
0.4 |
0.5 |
0.4 |
0.2 |
0.3 |
0.7 |
- In broadcasting, in contrast to publishing, Asian employment as
officials and managers is similar to their employment as
professionals. Larger disparities in employment between the two job
groups can be seen for African Americans and Hispanics.
- African American and Hispanic employment is fairly similar in
all job groups except operatives and service workers with a much
higher proportion of African Americans.
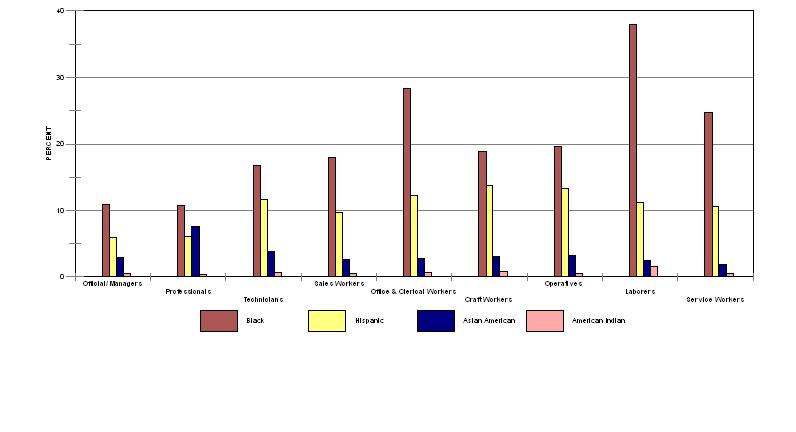
CABLE NETWORKS & PROGRAM DISTRIBUTION
| Racial/Ethnic Group |
Officials/Managers |
Professionals |
Technicians |
Sales Workers |
Office & Clerical Workers |
Craft Workers |
Operatives |
Laborers |
Service Workers |
| Black |
10.9 |
10.8 |
16.7 |
18.0 |
28.3 |
18.8 |
19.6 |
37.9 |
24.8 |
| Hispanic |
6.0 |
6.1 |
11.6 |
9.7 |
12.2 |
13.7 |
13.3 |
11.2 |
10.5 |
| Asian American |
2.9 |
7.6 |
3.8 |
2.6 |
2.8 |
3.0 |
3.2 |
2.5 |
1.8 |
| American Indian |
0.5 |
0.4 |
0.6 |
0.5 |
0.6 |
0.8 |
0.5 |
1.5 |
0.5 |
- As in the publishing industry, the disparities between Asian
American employment as officials and managers and as professionals
is much greater that those observed for other minority groups.
- While Hispanic employment as officials and managers is
consistent between the broadcasting and cable industries, African
American employment in this job group increases from 7.7 percent in
broadcasting to 10.9 percent in the cable industry.
Tables
U.S. Totals
Ten Largest Metropolitan Areas
- Boston-Cambridge-Quincy, MA-NH
- Chicago-Naperville-Joliet, IL-IN-WI
- Dallas-Fort Worth-Arlington, TX
- Detroit-Warren-Livonia, MI
- Houston-Baytown-Sugar Land, TX
- Los Angeles-Long Beach-Santa Ana, CA
- Miami-Fort Lauderdale-Miami Beach, FL
- New York-Newark-Edison, NY-NJ-PA
- Philadelphia-Camden-Wilmington, PA-NJ-DE-MD
- Washington-Arlington-Alexandria, DC-VA-MD-WV
1. OMB Bulletin No. 03-04 2003.
"Metropolitan Statistical Areas, Micropolitan Statistical Areas,
Combined Statistical Areas, New England City and Town Areas,
Combined New England City and Town Areas" Statistical and Science
Policy Branch, Office of Information and Regulatory Affairs, Office
of Management and Budget.
This page was last modified on August 5, 2004.
 Return to Home Page