 |
|
|||
State Energy Profile - MarylandEnergy Information Administration - State Energy Profileshttp://tonto.eia.doe.gov/state |
||||||
|---|---|---|---|---|---|---|
|
||||||
|
Last Update: March 5, 2009
Next Update: March 19, 2009 |
||||||
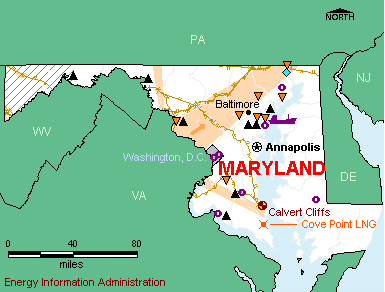
OverviewResources and ConsumptionMaryland has few energy resources. Minor coal reserves are found in the Appalachian Mountains in western Maryland. Wind power potential is found in the Chesapeake Bay, off the Atlantic Coast, and in the Appalachian Mountains. The Susquehanna River in the north is a source of hydroelectric power. Maryland’s economy is not energy-intensive, and per capita energy consumption is low. PetroleumMaryland relies on petroleum product deliveries from other States and abroad. The Colonial Pipeline from the Gulf Coast region supplies Maryland markets as it passes through the State on the way to major Northeast population centers. The Port of Baltimore receives petroleum products delivered via the Chesapeake Bay. Maryland requires motor gasoline blended with ethanol across the center of the State, including the Baltimore-Washington metropolitan area. Natural GasMaryland relies on interstate natural gas deliveries and imports from abroad to meet demand. Several major pipelines from the Gulf Coast region supply natural gas to Maryland markets. One of five existing U.S. liquefied natural gas (LNG) import facilities is located at Cove Point on the Chesapeake Bay’s western shore. The Cove Point terminal receives its LNG supply primarily from Trinidad and Tobago. Maryland’s residential and commercial sectors dominate State natural gas consumption. Nearly one-half of Maryland households use natural gas for home heating. Coal, Electricity, and RenewablesMaryland’s coal-fired power plants typically supply more than one-half of the electricity generation within the State. Nuclear power typically supplies more than one-fourth of generation, and petroleum- and natural gas-fired plants supply much of the remainder. Although Maryland produces a small amount of coal in the West, most of the State’s coal-fired power plants burn coal shipped from West Virginia. The State’s only nuclear plant, the dual-unit Calvert Cliffs facility, supplies all of Maryland’s nuclear power. The Conowingo hydroelectric plant on the Susquehanna River, one of Maryland's largest generation facilities, provides almost all of the State’s hydroelectricity. Approximately one-third of Maryland households use electricity as their main source of energy for home heating. |
|
| Economy | ||||
| Population and Employment | Maryland | U.S. Rank | Period | |||||||
| Population | 5.6 million | 19 |
2008 | |||||||
| Civilian Labor Force | 3.0 million | 18 |
Dec-08 | |||||||
| Per Capita Personal Income | $46,021 | 6 |
2007 | |||||||
| Industry | Maryland | U.S. Rank | Period | |||||||
| Gross Domestic Product by State | $268.7 billion | 15 | 2007 | |||||||
| Land in Farms | 2.1 million acres | 40 |
2002 | |||||||
| Market Value of Agricultural Products Sold | $1.3 billion | 36 |
2002 | |||||||
| Prices | ||||
| Petroleum | Maryland | U.S. Avg. | Period | |||||||
| Domestic Crude Oil First Purchase | — | $36.75/barrel | Dec-08 | |||||||
| No. 2 Heating Oil, Residential | $2.54/gal | $2.45/gal | Dec-08 | |||||||
| Regular Motor Gasoline Sold Through Retail Outlets (Excluding Taxes) | $1.22/gal | $1.195/gal | Dec-08 | |||||||
| State Tax Rate on Motor Gasoline (other taxes may apply) |
$0.235/gal | $0.2159/gal | Aug-08 | |||||||
| No. 2 Diesel Fuel Sold Through Retail Outlets (Excluding Taxes) | $1.959/gal | $1.902/gal | Dec-08 | |||||||
| State Tax Rate on On-Highway Diesel (other taxes may apply) |
$0.2425/gal | $0.2214/gal | Aug-08 | |||||||
| Natural Gas | Maryland | U.S. Avg. | Period | |||||||
| Wellhead | NA | $6.37/thousand cu ft | 2007 | |||||||
| City Gate | $9.57/thousand cu ft | $8.16/thousand cu ft | Dec-08 | |||||||
| Residential | $15.14/thousand cu ft | $12.64/thousand cu ft | Dec-08 | |||||||
| Coal | Maryland | U.S. Avg. | Period | |||||||
| Average Open Market Sales Price | $33.02/short ton | $26.20/short ton | 2007 | |||||||
| Delivered to Electric Power Sector | $ 3.42/million Btu | $ 2.13 /million Btu | Nov-08 | |||||||
| Electricity | Maryland | U.S. Avg. | Period | |||||||
| Residential | 13.84 cents/kWh | 11.47 cents/kWh | Nov-08 | |||||||
| Commercial | 12.25 cents/kWh | 10.13 cents/kWh | Nov-08 | |||||||
| Industrial | 9.35 cents/kWh | 7.06 cents/kWh | Nov-08 | |||||||
|
|||||||||||||||||||||||||
| Reserves | Maryland | Share of U.S. | Period | ||||||||||||||||||||||
| Crude Oil | — | — | 2007 | ||||||||||||||||||||||
| Dry Natural Gas | — | — | 2007 | ||||||||||||||||||||||
| Natural Gas Liquids | — | — | 2007 | ||||||||||||||||||||||
| Recoverable Coal at Producing Mines | 24 million short tons | 0.1 % | 2007 | ||||||||||||||||||||||
| Rotary Rigs & Wells | Maryland | Share of U.S. | Period | ||||||||||||||||||||||
| Rotary Rigs in Operation | 0 | 0.0% | 2008 | ||||||||||||||||||||||
| Crude Oil Producing Wells | 0 | 0.0% | 2008 | ||||||||||||||||||||||
| Natural Gas Producing Wells | 7 | 0.0% | 2007 | ||||||||||||||||||||||
| Production | Maryland | Share of U.S. | Period | ||||||||||||||||||||||
| Total Energy | 317 trillion Btu | 0.4% | 2006 | ||||||||||||||||||||||
| Crude Oil | — | — | Oct-08 | ||||||||||||||||||||||
| Natural Gas - Marketed | 35 million cu ft | 0.0% | 2007 | ||||||||||||||||||||||
| Coal | 2,301 thousand short tons | NA | 2007 | ||||||||||||||||||||||
| Capacity | Maryland | Share of U.S. | Period | ||||||||||||||||||||||
| Crude Oil Refinery Capacity (as of Jan. 1) | 0 barrels/calendar day | 0.0% | 2008 | ||||||||||||||||||||||
| Electric Power Industry Net Summer Capability | 12,486 MW | 1.3% | 2007 | ||||||||||||||||||||||
| Net Electricity Generation | Maryland | Share of U.S. | Period | ||||||||||||||||||||||
| Total Net Electricity Generation | 3,478 thousand MWh | 1.1% | Nov-08 | ||||||||||||||||||||||
| Petroleum-Fired | 15 thousand MWh | 0.7% | Nov-08 | ||||||||||||||||||||||
| Natural Gas-Fired | 175 thousand MWh | 0.3% | Nov-08 | ||||||||||||||||||||||
| Coal-Fired | 1,891 thousand MWh | 1.2% | Nov-08 | ||||||||||||||||||||||
| Nuclear | 1,261 thousand MWh | 2.0% | Nov-08 | ||||||||||||||||||||||
| Hydroelectric | 68 thousand MWh | 0.4% | Nov-08 | ||||||||||||||||||||||
| Other Renewables | 46 thousand MWh | 0.5% | Nov-08 | ||||||||||||||||||||||
| Stocks | Maryland | Share of U.S. | Period | ||||||||||||||||||||||
| Motor Gasoline (Excludes Pipelines) | — | — | Dec-08 | ||||||||||||||||||||||
| Distillate Fuel Oil (Excludes Pipelines) | — | — | Dec-08 | ||||||||||||||||||||||
| Natural Gas in Underground Storage | 60,688 million cu ft | 0.9% | Dec-08 | ||||||||||||||||||||||
| Petroleum Stocks at Electric Power Producers | W | W | Nov-08 | ||||||||||||||||||||||
| Coal Stocks at Electric Power Producers | W | W | Nov-08 | ||||||||||||||||||||||
| Production Facilities | Maryland | ||||||||||||||||||||||||
| Major Coal Mines | None | ||||||||||||||||||||||||
| Petroleum Refineries | None | ||||||||||||||||||||||||
| Major Non-Nuclear Electricity Generating Plants | Chalk Point LLC (Mirant Chalk Point LLC) • Morgantown Generating Plant (Mirant Mid-Atlantic LLC) • Brandon Shores (Constellation Power Source Gen) • Herbert A Wagner (Constellation Power Source Gen) • Dickerson (Mirant Mid-Atlantic LLC) | ||||||||||||||||||||||||
| Nuclear Power Plants | Calvert Cliffs Nuclear Power Plant (Calvert Cliffs Nuclear PP Inc) | ||||||||||||||||||||||||
| Distribution & Marketing | ||||
| Distribution Centers | Maryland | |||||||||
| Oil Seaports/Oil Import Sites | Baltimore. | |||||||||
| Natural Gas Market Centers | None | |||||||||
| Major Pipelines | Maryland | |||||||||
| Crude Oil | None | |||||||||
| Petroleum Product | Colonial | |||||||||
| Liquefied Petroleum Gases | None | |||||||||
| Interstate Natural Gas Pipelines | Columbia Gas Transmission Corp. • Dominion Transmission Co. • Eastern Shore Natural Gas Co. • Texas Eastern Transmission Corp. • Transcontinental Gas Pipeline Co. | |||||||||
| Fueling Stations | Maryland | Share of U.S. | Period | |||||||
| Motor Gasoline | 2,339 | 1.4% | 2007 | |||||||
| Liquefied Petroleum Gases | 13 | 0.6% | 2009 | |||||||
| Compressed Natural Gas | 13 | 1.7% | 2009 | |||||||
| Ethanol | 13 | 0.8% | 2009 | |||||||
| Other Alternative Fuels | 10 | 0.8% | 2009 | |||||||
| Consumption | ||||
| per Capita | Maryland | U.S. Rank | Period | |||||||
| Total Energy | 259 million Btu | 43 | 2006 | |||||||
| by Source | Maryland | Share of U.S. | Period | |||||||
| Total Energy | 1,452 trillion Btu | 1.5% | 2006 | |||||||
| Total Petroleum | 103,353 thousand barrels | 1.4% | 2006 | |||||||
| Motor Gasoline | 66,263 thousand barrels | 2.0% | 2007 | |||||||
| Distillate Fuel | 21,699 thousand barrels | 1.4% | 2007 | |||||||
| Liquefied Petroleum Gases | 3,111 thousand barrels | 0.4% | 2006 | |||||||
| Jet Fuel | 3,522 thousand barrels | 0.6% | 2007 | |||||||
| Natural Gas | 201,078 million cu ft | 0.9% | 2007 | |||||||
| Coal | 12,939 thousand short tons | 1.2% | 2006 | |||||||
| by End-Use Sector | Maryland | Share of U.S. | Period | |||||||
| Residential | 399,866 billion Btu | 1.9% | 2006 | |||||||
| Commercial | 402,422 billion Btu | 2.3% | 2006 | |||||||
| Industrial | 184,779 billion Btu | 0.6% | 2006 | |||||||
| Transportation | 465,310 billion Btu | 1.6% | 2006 | |||||||
| for Electricity Generation | Maryland | Share of U.S. | Period | |||||||
| Petroleum | 34 thousand barrels | 0.9% | Nov-08 | |||||||
| Natural Gas | 1,663 million cu ft | 0.3% | Nov-08 | |||||||
| Coal | 768 thousand short tons | 0.9% | Nov-08 | |||||||
| for Home Heating (share of households) | Maryland | U.S. Avg. | Period | |||||||
| Natural Gas | 46% | 51.2% | 2000 | |||||||
| Fuel Oil | 16% | 9.0% | 2000 | |||||||
| Electricity | 33% | 30.3% | 2000 | |||||||
| Liquefied Petroleum Gases | 3% | 6.5% | 2000 | |||||||
| Other/None | 2% | 1.8% | 2000 | |||||||
| Environment | ||||
| Special Programs | Maryland | |||||||||
| Clean Cities Coalitions | State of Maryland | |||||||||
| Alternative Fuels | Maryland | Share of U.S. | Period | |||||||
| Alternative-Fueled Vehicles in Use | 11,624 | 2.0% | 2006 | |||||||
| Ethanol Plants | 0 | 0.0% | 2008 | |||||||
| Ethanol Plant Capacity | 0 million gal/year | 0.0% | 2008 | |||||||
| Ethanol Use in Gasohol | 303 thousand gal | 0.0% | 2004 | |||||||
| Electric Power Industry Emissions | Maryland | Share of U.S. | Period | |||||||
| Carbon Dioxide |
30,496,968 metric tons | 1.2% | 2006 | |||||||
| Sulfur Dioxide |
270,870 metric tons | 2.8% | 2006 | |||||||
| Nitrogen Oxide |
62,065 metric tons | 1.6% | 2006 | |||||||
| — = No data reported; NA = Not available;
W = Withheld to avoid disclosure of individual company data. NM = Not meaningful due to large relative standard error or excessive percentage change. |
|
|||||||||||||||||||||||||||||||||||||||||||||||||||||||||||||||||||||||||||||||||||||||||||||||||||||||||||||||||||||||||||||||||||||||||||||||||||||||||||