|
| April 19, 2007 |
|
In 2005, most youths aged 12 to 17 (92.4 percent) participated in at least one activity during the past year. Over four fifths (82.0 percent) participated in at least one school-based activity, 71.9 percent in at least one community-based activity, 64.1 percent in at least one church- or faith-based activity, and 42.7 percent in at least one other type of activity.
One third of youths aged 12 to 17 participated in seven or more activities in the past year (33.9 percent), 31.4 percent participated in four to six activities, and 27.1 percent participated in one to three activities. Demographic groups varied in the number of activities reported (Table 1). Females were more likely than males to participate in seven or more activities in the past year (39.6 vs. 28.3 percent), and youths aged 12 or 13 were more likely to participate in seven or more activities than those aged 14 or 15 and those aged 16 or 17 (35.7 vs. 33.4 and 32.6 percent, respectively). Youths from households with higher family incomes were more likely to participate in a greater number of activities than those from households with lower family incomes.
| Demographic Characteristic | Number of Activities | |||
|---|---|---|---|---|
| No Activities |
1-3 Activities |
4-6 Activities |
7 or More Activities |
|
| Age Group | ||||
| 12 or 13 | 5.8 | 26.4 | 32.2 | 35.7 |
| 14 or 15 | 7.6 | 27.0 | 32.0 | 33.4 |
| 16 or 17 | 9.5 | 27.9 | 30.0 | 32.6 |
| Gender | ||||
| Male | 8.5 | 30.4 | 32.8 | 28.3 |
| Female | 6.7 | 23.7 | 30.0 | 39.6 |
| Family Income | ||||
| Less Than $20,000 | 13.0 | 33.7 | 30.5 | 22.9 |
| $20,000 to $49,999 | 9.4 | 30.7 | 31.5 | 28.4 |
| $50,000 to $74,999 | 6.1 | 25.1 | 31.4 | 37.4 |
| $75,000 or More | 3.6 | 20.7 | 31.8 | 43.9 |
| Source: SAMHSA, 2005 NSDUH. |
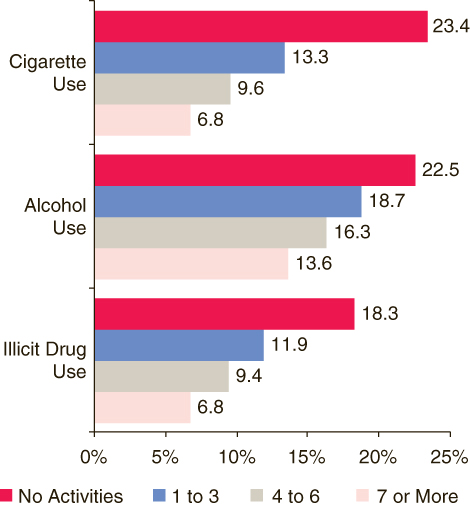
Youths aged 12 to 17 who participated in a greater number of past year activities were less likely to have used cigarettes, alcohol, and illicit drugs in the past month than those who participated in fewer past year activities (Figure 1). For example, 6.8 percent of youths who participated in seven or more activities during the past year used an illicit drug in the past month compared with 18.3 percent of youths who did not participate in any activities.
 |
| No activities | 1 to 3 | 4 to 6 | 7 or More | |
|---|---|---|---|---|
| Cigarette Use | 23.4 | 13.3 | 9.6 | 6.8 |
| Alcohol Use | 22.5 | 18.7 | 16.3 | 13.6 |
| Illicit Drug Use | 18.3 | 11.9 | 9.4 | 6.8 |
| Source: SAMHSA, 2005 NSDUH. |
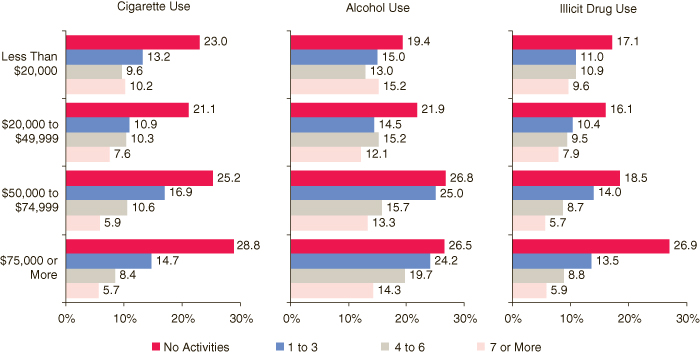
Regardless of family income level, youths aged 12 to 17 who did not participate in any activities had higher rates of cigarette and illicit drug use than those who participated in four to six or seven or more activities (Figure 2). For example, among youths from families with incomes of less than $20,000, 23.0 percent of those with no past year activities and 10.2 percent of those with seven or more activities smoked cigarettes in the past month; similarly, among youths from families with incomes of $75,000 or more, 28.8 percent of those with no past year activities and 5.7 percent of those with seven or more activities smoked cigarettes in the past month.
Among youths aged 12 to 17 who participated in any activities, those with higher family incomes showed a consistent pattern of decreasing rates of past month cigarette, alcohol, and illicit drug use with increasing numbers of activities, whereas the relationship between substance use and number of activities was less clear among youths with lower family incomes (Figure 2). For example, the rate of past month alcohol use among youths from families with incomes of $75,000 or more was 24.2 percent for those with one to three past year activities, 19.7 percent for those with four to six activities, and 14.3 percent for those with seven or more activities. In comparison, among youths from families with incomes of less than $20,000, 15.0 percent of those with one to three past year activities, 13.0 percent of those with four to six activities, and 15.2 percent of those with seven or more activities drank alcohol in the past month.
 |
| No Activities | 1 to 3 | 4 to 6 | 7 or More | |
|---|---|---|---|---|
| Cigarettes | ||||
| Less Than $20,000 | 23.0 | 13.2 | 9.6 | 10.2 |
| $20,000 to $49,999 | 21.1 | 10.9 | 10.3 | 7.6 |
| $50,000 to $74,999 | 25.2 | 16.9 | 10.6 | 5.9 |
| $75,000 or More | 28.8 | 14.7 | 8.4 | 5.7 |
| Alcohol Use | ||||
| Less Than $20,000 | 19.4 | 15.0 | 13.0 | 15.2 |
| $20,000 to $49,999 | 21.9 | 14.5 | 15.2 | 12.1 |
| $50,000 to $74,999 | 26.8 | 25.0 | 15.7 | 13.3 |
| $75,000 or More | 26.5 | 24.2 | 19.7 | 14.3 |
| Illicit Drug Use | ||||
| Less Than $20,000 | 17.1 | 11.0 | 10.9 | 9.6 |
| $20,000 to $49,999 | 16.1 | 10.4 | 9.5 | 7.9 |
| $50,000 to $74,999 | 18.5 | 14.0 | 8.7 | 5.7 |
| $75,000 or More | 26.9 | 13.5 | 8.8 | 5.9 |
| Source: SAMHSA, 2005 NSDUH. |
|
The National Survey on Drug Use and Health (NSDUH) is an annual survey sponsored by the Substance Abuse and Mental Health Services Administration (SAMHSA). Prior to 2002, this survey was called the National Household Survey on Drug Abuse (NHSDA). The 2005 data used in this report are based on information obtained from 22,534 youths aged 12 to 17. The survey collects data by administering questionnaires to a representative sample of the population through face-to-face interviews at their place of residence. The NSDUH Report is prepared by the Office of Applied Studies (OAS), SAMHSA, and by RTI International in Research Triangle Park, North Carolina. (RTI International is a trade name of Research Triangle Institute.) Information on NSDUH used in compiling data for this report is available in the following publication: Office of Applied Studies. (2006). Results from the 2005 National Survey on Drug Use and Health: National findings (DHHS Publication No. SMA 06-4194, NSDUH Series H-30). Rockville, MD: Substance Abuse and Mental Health Services Administration. Also available online: http://www.oas.samhsa.gov. Because of improvements and modifications to the 2002 NSDUH, estimates from the 2002, 2003, 2004, and 2005 surveys should not be compared with estimates from the 2001 or earlier versions of the survey to examine changes over time. |
|
This page was last updated on July 11, 2008. |
|
SAMHSA, an agency in the Department of Health and Human Services, is the Federal Government's lead agency for improving the quality and availability of substance abuse prevention, addiction treatment, and mental health services in the United States. 
* PDF formatted files require that Adobe Acrobat Reader® program is installed on your computer. Click here to download this FREE software now from Adobe. |