
|
| May 31, 2007 |
|
| 1995 | 1996 | 1997 | 1998 | 1999 | 2000 | 2001 | 2002 | 2003 | 2004 | 2005 | |
|---|---|---|---|---|---|---|---|---|---|---|---|
| Admissions Aged 65 or Older (thousands) | 12.1 | 11.7 | 11.4 | 11.6 | 11.7 | 12.2 | 11.5 | 11.6 | 11.5 | 11.7 | 11.3 |
| Primary Substance | Percent | ||||||||||
| Alcohol | 84.7 | 84.8 | 83.6 | 83.1 | 80.5 | 80.4 | 78.7 | 77.8 | 78.5 | 74.4 | 75.9 |
| Opiates | 6.6 | 6.5 | 7.3 | 7.5 | 7.9 | 8.2 | 9.2 | 9.2 | 9.3 | 8.8 | 10.5 |
| Cocaine | 2.1 | 2.0 | 1.9 | 2.3 | 2.6 | 2.9 | 2.6 | 2.9 | 3.2 | 3.9 | 4.4 |
| Sedatives | 0.5 | 0.5 | 0.7 | 0.3 | 0.2 | 0.3 | 0.4 | 0.4 | 0.4 | 0.8 | 1.3 |
| Marijuana | 0.9 | 0.9 | 1.0 | 0.9 | 1.2 | 1.2 | 1.0 | 1.2 | 1.4 | 1.3 | 1.0 |
| Stimulants | 0.3 | 0.3 | 0.3 | 0.2 | 0.5 | 0.5 | 0.4 | 0.8 | 0.6 | 0.6 | 0.8 |
| Tranquilizers | 0.7 | 0.8 | 0.7 | 0.7 | 0.7 | 0.8 | 1.2 | 0.9 | 0.8 | 0.6 | 0.6 |
| Other | 4.2 | 4.2 | 4.5 | 5.0 | 6.4 | 5.7 | 6.5 | 6.8 | 5.8 | 9.6 | 5.5 |
| Source: 2005 SAMHSA Treatment Episode Data Set (TEDS). |
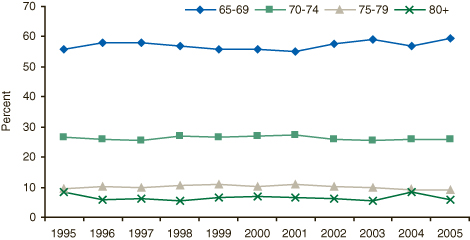
While the total substance abuse treatment population increased by 10 percent between 1995 and 2005, the number of substance abuse treatment admissions among persons aged 65 or older decreased by 7 percent, from 12,100 to 11,300 admissions (Table 1). Adults aged 65 to 69 made up the largest part of this group, increasing from 56 percent of older adults in treatment in 1995 to 59 percent in 2005 (Figure 1).
 |
| Year | 65-69 | 70-74 | 75-79 | 80+ |
|---|---|---|---|---|
| 1995 | 55.79% | 26.44% | 9.37% | 8.38% |
| 1996 | 58.04% | 25.75% | 10.23% | 5.96% |
| 1997 | 58.11% | 25.65% | 9.92% | 6.29% |
| 1998 | 56.87% | 26.93% | 10.74% | 5.44% |
| 1999 | 55.69% | 26.62% | 11.11% | 6.57% |
| 2000 | 55.73% | 27.09% | 10.33% | 6.84% |
| 2001 | 55.19% | 27.18% | 11.05% | 6.56% |
| 2002 | 57.76% | 25.80% | 10.23% | 6.19% |
| 2003 | 59.00% | 25.46% | 9.97% | 5.55% |
| 2004 | 56.78% | 25.72% | 9.06% | 8.43% |
| 2005 | 59.25% | 25.81% | 9.19% | 5.72% |
| Source: 2005 SAMHSA Treatment Episode Data Set (TEDS). |
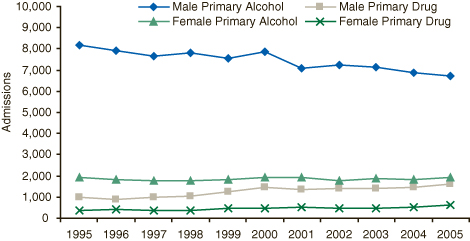
In each year from 1995 to 2005, alcohol was the most frequently reported primary substance of abuse5 for substance abuse treatment admissions aged 65 or older. However, the proportion of older admissions reporting alcohol as their primary substance declined from 84.7 percent in 1995 to 75.9 percent in 2005 (Table 1). The number of primary alcohol admissions among older men decreased by 18 percent from 8,200 in 1995 to 6,700 in 2005 (Figure 2). The number of primary alcohol admissions among older women was nearly the same in 1995 and 2005, around 1,900 admissions.
 |
| Year | Male Primary Alcohol |
Male Primary Drug |
Female Primary Alcohol |
Female Primary Drug |
|---|---|---|---|---|
| 1995 | 8,152 | 998 | 1,943 | 382 |
| 1996 | 7,892 | 904 | 1,840 | 416 |
| 1997 | 7,671 | 994 | 1,747 | 390 |
| 1998 | 7,790 | 1,059 | 1,752 | 365 |
| 1999 | 7,546 | 1,264 | 1,806 | 488 |
| 2000 | 7,852 | 1,474 | 1,940 | 454 |
| 2001 | 7,102 | 1,377 | 1,908 | 509 |
| 2002 | 7,264 | 1,410 | 1,775 | 462 |
| 2003 | 7,135 | 1,403 | 1,874 | 476 |
| 2004 | 6,887 | 1,462 | 1,843 | 505 |
| 2005 | 6,694 | 1,590 | 1,916 | 600 |
| Source: 2005 SAMHSA Treatment Episode Data Set (TEDS). |
By contrast, treatment admissions for abuse of primary substances other than alcohol among older adults increased over the same time period, from 1,000 men and 400 women in 1995 to 1,600 men and 600 women in 2005—despite the decrease in overall substance abuse treatment admissions in this age group.
Increases in admissions for abuse of opiates, cocaine, and sedatives contributed to the growth in primary drug abuse treatment admissions among admissions aged 65 or older. Between 1995 and 2005, primary opiate admissions increased from 6.6 to 10.5 percent of admissions aged 65 or older (Table 1). Most of these primary opiate admissions were for heroin, but admissions for non-heroin opiates—including codeine, Dilaudid, morphine, oxycodone, and Demerol—accounted for 1.4 percent of admissions aged 65 or older in 1995 and 2.4 percent in 2005. During the same time period, primary cocaine admissions increased from 2.1 to 4.4 percent of admissions aged 65 or older, and primary sedative admissions (especially barbiturates) increased from 0.5 to 1.3 percent of admissions in this age group.
In 2005, 76 percent of substance abuse treatment admissions aged 65 or older were male. Sixty-four percent of substance abuse treatment admissions aged 65 or older were White, 18 percent were Black, 14 percent were Hispanic, and 4 percent were other race/ethnicities. Most admissions aged 65 or older were between 65 and 69 years of age (59 percent), while 26 percent were between 70 and 74 years of age, 9 percent were between 75 and 79 years of age, and 6 percent were 80 years of age or older.
In 2005, 44 percent of substance abuse treatment admissions aged 65 or older were referred to treatment by themselves or another individual, and 26 percent were referred through the criminal justice system.6 Fifty-two percent of admissions aged 65 or older reported no prior substance abuse treatment episodes, 40 percent reported one to four prior treatment episodes, and 8 percent reported five or more prior treatment episodes.
Seventy-nine percent of substance abuse treatment admissions aged 65 or older in 2005 were not in the labor force (i.e., not employed and not looking for work), 10 percent were unemployed, 7 percent were employed full time, and 4 percent were employed part time.7 Among those adults aged 65 or older not in the labor force, 72 percent were retired and 17 percent were disabled.8 Twenty-six percent of older admissions reported as their source of payment that they expected to pay for treatment themselves.9
In 2005, the most populous States tended to have the largest numbers of older adults entering substance abuse treatment, but not necessarily the highest admission rates per 100,000 population (Table 2). Admission rates among adults aged 65 or older tended to be highest in northern and northeastern States.
| State | Number | State | Rate per 100,000 Aged 65 or Older |
|---|---|---|---|
| New York | 3,140 | Colorado | 166 |
| California | 908 | New York | 125 |
| Colorado | 773 | South Dakota | 111 |
| Arizona | 395 | Oregon | 78 |
| Minnesota | 393 | Connecticut | 75 |
| Oregon | 365 | Maine | 72 |
| Connecticut | 356 | Minnesota | 63 |
| Pennsylvania | 325 | Vermont | 61 |
| Illinois | 310 | Arizona | 52 |
| Maryland | 305 | Montana | 51 |
| Massachusetts | 283 | Maryland | 47 |
| Washington | 270 | Nebraska | 42 |
| New Jersey | 244 | Washington | 37 |
| Georgia | 223 | Iowa | 36 |
| Ohio | 210 | Kentucky | 35 |
| Source: 2005 SAMHSA Treatment Episode Data Set (TEDS). |
|
The Drug and Alcohol Services Information System (DASIS) is an integrated data system maintained by the Office of Applied Studies, Substance Abuse and Mental Health Services Administration (SAMHSA). One component of DASIS is the Treatment Episode Data Set (TEDS). TEDS is a compilation of data on the demographic characteristics and substance abuse problems of those admitted for substance abuse treatment. The information comes primarily from facilities that receive some public funding. Information on treatment admissions is routinely collected by State administrative systems and then submitted to SAMHSA in a standard format. TEDS records represent admissions rather than individuals, as a person may be admitted to treatment more than once. State admission data are reported to TEDS by the Single State Agencies (SSAs) for substance abuse treatment. There are significant differences among State data collection systems. Sources of State variation include completeness of reporting, facilities reporting TEDS data, clients included, and treatment resources available. See the annual TEDS reports for details. Approximately 1.8 million records are included in TEDS each year. The DASIS Report is prepared by the Office of Applied Studies, SAMHSA; Synectics for Management Decisions, Inc., Arlington, Virginia; and by RTI International in Research Triangle Park, North Carolina (RTI International is a trade name of Research Triangle Institute). Information and data for this issue are based on data reported to TEDS through February 1, 2006. Access the latest TEDS reports at: |
| The DASIS Report is published periodically by the Office of Applied Studies, Substance Abuse and Mental Health Services Administration (SAMHSA). All material appearing in this report is in the public domain and may be reproduced or copied without permission from SAMHSA. Additional copies of this report or other reports from the Office of Applied Studies are available on-line: http://www.oas.samhsa.gov. Citation of the source is appreciated. For questions about this report please e-mail: shortreports@samhsa.hhs.gov. |
|
This page was last updated on July 11, 2008. |
|
SAMHSA, an agency in the Department of Health and Human Services, is the Federal Government's lead agency for improving the quality and availability of substance abuse prevention, addiction treatment, and mental health services in the United States. 
* PDF formatted files require that Adobe Acrobat Reader® program is installed on your computer. Click here to download this FREE software now from Adobe. |