July 19, 2007

Demographic and Geographic Variations in Injection Drug Use

In Brief
  • Combined 2002 to 2005 data indicate that males were twice as likely as females to have used needles to inject heroin, cocaine, methamphetamine, or other stimulants in the past year (0.24 vs. 0.11 percent)

  • Persons living in the West were twice as likely to have injected stimulants in the past year as persons living in the Midwest and South

  • Over two fifths of past year heroin users injected heroin in that period compared with less than a tenth of past year users of cocaine, methamphetamine, and other stimulants who injected these drugs

Research indicates that the use of injectable drugs, like the use of other illicit drugs, varies by demographic group and geographic area.1 Methamphetamine use from 2002 to 2004, for example, was more prevalent in the West than in other regions of the country.2 Analysis of 2003 treatment admissions involving clients who injected their drugs of abuse showed that their profiles by race/ethnicity, gender, and region varied depending on the types of drugs they injected.3 These findings suggest that there are differences in the rates of injection drug use depending on demographic and geographic characteristics.

The National Survey on Drug Use and Health (NSDUH) asks respondents aged 12 or older to report whether they ever used a needle to inject heroin, cocaine, methamphetamine, other stimulants, or other drugs that were not prescribed for them or that they took only for the feeling or experience they caused. Respondents who injected heroin, cocaine, methamphetamine, or other stimulants are asked when they last injected these drugs, including injection in the past year.

This issue of The NSDUH Report examines variation in the rates of past year injection drug use among persons aged 12 or older by gender, age, race/ethnicity,4 county type,5 and region.6 Because these variations in rates of injection use may be driven by patterns in overall use, this report also examines variations in the proportion of users who inject a drug. Because past year injection drug use rates remained relatively stable from 2002 through 2005, this report focuses on combined annual averages of 2002 to 2005 NSDUH data.


Injection Drug Use

Combined data from 2002 to 2005 indicate that an annual average of 0.18 percent of persons aged 12 or older (an estimated 424,000 persons annually) injected heroin, cocaine, methamphetamine, or other stimulants in the past year. Males were twice as likely as females to have injected these drugs in the past year (0.24 vs. 0.11 percent). Rates of injection of these drugs in the past year among adults aged 18 to 34 were 3 times higher than the rates among youths aged 12 to 17 or adults aged 35 or older (0.34 vs. 0.10 and 0.12 percent, respectively). Past year injection of these drugs varied significantly among racial/ethnic groups, with the lowest rate among Asians (Figure 1). Whites were more likely than blacks to have injected these drugs in the past year. Overall injection drug use rates in the past year did not vary by county type or region.
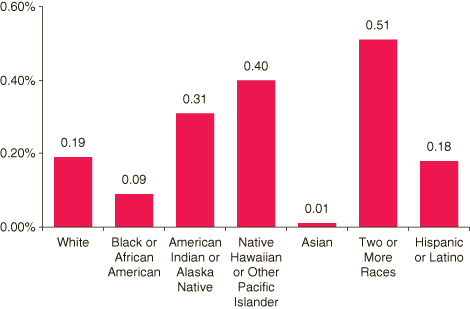
Figure 1. Past Year Injection Use of Heroin, Cocaine, Stimulants, or Methamphetamine among Persons Aged 12 or Older, by Race/Ethnicity*,**: Percentages, 2002-2005
This figure is a vertical bar graph comparing past year injection use of heroin, cocaine, stimulants, or methamphetamine among persons aged 12 or older, by race/ethnicity*,**: percentages, 2002-2005.

Figure 1 Table. Past Year Injection Use of Heroin, Cocaine, Stimulants, or Methamphetamine among Persons Aged 12 or Older, by Race/Ethnicity*,**: Percentages, 2002-2005
Race/Ethnicity Percent
White 0.19%
Black or African American 0.09%
American Indian or Alaska Native 0.31%
Native Hawaiian or Other Pacific Islander 0.40%
Asian 0.01%
Two or More Races 0.51%
Hispanic or Latino 0.18%
Source: SAMHSA, 2002-2005 NSDUHs.


Type of Drug Injected

Combined data from 2002 to 2005 indicate that an annual average of 0.09 percent of persons aged 12 or older (an estimated 206,000 persons annually) injected stimulants (which could include methamphetamine) in the past year, while 0.08 percent injected cocaine, 0.08 percent injected heroin, and 0.07 percent injected methamphetamine. Gender and age differences in injection use rates for the four respective drug types generally followed the overall patterns observed for injection of any of the drugs.

Persons living in non-metropolitan areas were approximately twice as likely to have injected stimulants or methamphetamine in the past year compared with persons living in large or small metropolitan areas (Table 1). Rates of past year injection of the four drug types also varied by region. Persons living in the Northeast were more likely to inject heroin than persons living in the Midwest or South; however, persons living in the Northeast were less likely to have injected methamphetamine in the past year than persons living in other regions. Rates of stimulant injection were higher in the West than in the Midwest or South and lower in the Northeast than in other regions.


Table 1. Past Year Injection Drug Use among Persons Aged 12 or Older, by Geographic Characteristics: Percentages, 2002-2005
Characteristics Heroin Cocaine Stimulants Methamphetamine
Metropolitan Area***          
Large Metropolitan Area 0.09% 0.07% 0.07% 0.05%
Small Metropolitan Area 0.07% 0.07% 0.08% 0.06%
Non-Metropolitan Area 0.05% 0.10% 0.15% 0.13%
Region+        
Northeast 0.13% 0.07% 0.05% 0.02%
Midwest 0.05% 0.07% 0.08% 0.05%
South 0.07% 0.10% 0.08% 0.06%
West 0.09% 0.06% 0.14% 0.12%
Source: SAMHSA, 2002-2005 NSDUHs.


Injection Use among Persons Using Specific Types of Drugs

Combined data for 2002 through 2005 indicate that over two fifths of past year heroin users injected heroin in that period compared with a tenth or fewer of past year users of cocaine, methamphetamine, and other stimulants who injected these drugs (Figure 2). Among past year users of specific types of drugs, there were no gender differences in injection use. Among past year heroin users, for example, males and females were similar in the proportion who injected the drug in the past year (42.0 and 40.7 percent, respectively). Past year users of cocaine, stimulants, or methamphetamine who were aged 12 to 17 were less likely than past year users in other age groups to have injected these drugs in the past year. In addition, persons aged 26 to 34 who used cocaine or stimulants in the past year were more likely to have injected these drugs than were their counterparts who were aged 18 to 25 (cocaine: 4.3 vs. 2.1 percent; stimulants: 8.5 vs. 4.1 percent).
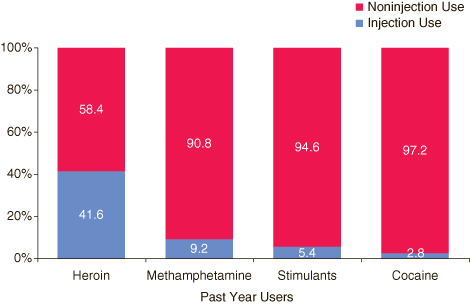
Figure 2. Past Year Injection Drug Use among Past Year Illicit Drug Users Aged 12 or Older, by Type of Drug Injected: Percentages, 2002-2005
This figure is a vertical bar graph comparing past year injection drug use among past year illicit drug users aged 12 or older, by type of drug injected: percentages, 2002-2005.  Accessible table located below this figure.

Figure 2 Table. Past Year Injection Drug Use among Past Year Illicit Drug Users Aged 12 or Older, by Type of Drug Injected: Percentages, 2002-2005
  Heroin Methamphetamine Stimulants Cocaine
Noninjection Use 58.4% 90.8% 94.6% 97.2%
Injection Use 41.6%   9.2%   5.4%   2.8%
Source: SAMHSA, 2002-2005 NSDUHs.

Among past year users of stimulants, those living in non-metropolitan areas were almost twice as likely to have injected the drug as users in large or small metropolitan areas (8.6 vs. 4.6 and 4.7 percent, respectively). Past year stimulant users in the West were more than 4 times more likely than users in the Northeast to have injected stimulants in that period (7.4 vs. 1.6 percent).


End Notes
1 Office of Applied Studies. (2006). Results from the 2005 National Survey on Drug Use and Health: National findings (DHHS Publication No. SMA 06-4194, NSDUH Series H-30). Rockville, MD: Substance Abuse and Mental Health Services Administration.
2 Colliver, J. D., Kroutil, L. A., Dai, L., & Gfroerer, J. C. (2006). Misuse of prescription drugs: Data from the 2002, 2003, and 2004 National Surveys on Drug Use and Health (DHHS Publication No. SMA 06-4192, Analytic Series A-28). Rockville, MD: Substance Abuse and Mental Health Services Administration, Office of Applied Studies.
3 Substance Abuse and Mental Health Services Administration, Office of Applied Studies. (September 23, 2005). The DASIS Report: Treatment Admissions for Injection Drug Use: 2003. Rockville, MD.
4 Race/ethnicity categories are determined by combining the responses from two separate questions. For this report, respondents identifying themselves as Hispanic were assigned to the Hispanic group regardless of their racial identification. Respondents identifying themselves as non-Hispanic were grouped according to their racial identification. Thus, "white" refers to those identifying themselves as non-Hispanic and white.
5 Counties are classified as being in large metropolitan areas, small metropolitan areas, or non-metropolitan areas. Large metropolitan areas have a population of 1 million or more. Small metropolitan areas have a population of fewer than 1 million. Non-metropolitan areas are outside metropolitan statistical areas (MSAs), as defined by the Office of Management and Budget in the June 6, 2003, Revised Definitions of Metropolitan Statistical Areas, New Definitions of Micropolitan Statistical Areas and Combined Statistical Areas, and Guidance on Uses of the Statistical Definitions of These Areas (OMB Bulletin No. 03-04, available at http://www.whitehouse.gov/omb/bulletins/b03-04.html). Also see the U.S. Census Bureau's June 12, 2003, About Metropolitan and Micropolitan Statistical Areas (available at http://www.census.gov/population/www/estimates/aboutmetro.html).
6 The four U.S. geographic regions defined by the U.S. Census Bureau consist of the following groups of States: Northeast Region—CT, MA, ME, NH, NJ, NY, PA, RI, and VT; Midwest Region—IA, IL, IN, KS, MI, MN, MO, ND, NE, OH, SD, and WI; South Region—AL, AR, DE, FL, GA, KY, LA, MD, MS, NC, OK, SC, TN, TX, VA, WV, and DC; and West Region—AK, AZ, CA, CO, HI, ID, MT, NM, NV, OR, UT, WA, and WY.


Figure and Table Notes
* See End Note 4.
** Statistically significant differences were only found between Asians and all other race/ethnicity groups, and between whites and blacks/African Americans. Larger variability in the estimates among the American Indian/Alaska Native, Native Hawaiian/Pacific Islander, two or more races, and Hispanics precluded significant differences between these groups and any other groups.
*** See End Note 5.
+ See End Note 6.


Suggested Citation
Substance Abuse and Mental Health Services Administration, Office of Applied Studies. (July 19, 2007). The NSDUH Report: Demographic and Geographic Variations in Injection Drug Use. Rockville, MD.

The National Survey on Drug Use and Health (NSDUH) is an annual survey sponsored by the Substance Abuse and Mental Health Services Administration (SAMHSA). Prior to 2002, this survey was called the National Household Survey on Drug Abuse (NHSDA). The 2002, 2003, 2004, and 2005 data used in this report are based on information obtained from 271,978 persons aged 12 or older. The survey collects data by administering questionnaires to a representative sample of the population through face-to-face interviews at their place of residence.

The NSDUH Report is prepared by the Office of Applied Studies (OAS), SAMHSA, and by RTI International in Research Triangle Park, North Carolina. (RTI International is a trade name of Research Triangle Institute.)

Information on NSDUH used in compiling data for this issue is available in the following publications:

Office of Applied Studies. (2006). Results from the 2005 National Survey on Drug Use and Health: National findings (DHHS Publication No. SMA 06-4194, NSDUH Series H-30). Rockville, MD: Substance Abuse and Mental Health Services Administration.

Office of Applied Studies. (2005). Results from the 2004 National Survey on Drug Use and Health: National findings (DHHS Publication No. SMA 05-4062, NSDUH Series H-28). Rockville, MD: Substance Abuse and Mental Health Services Administration.

Office of Applied Studies. (2004). Results from the 2003 National Survey on Drug Use and Health: National findings (DHHS Publication No. SMA 04-3964, NSDUH Series H-25). Rockville, MD: Substance Abuse and Mental Health Services Administration.

Office of Applied Studies. (2003). Results from the 2002 National Survey on Drug Use and Health: National findings (DHHS Publication No. SMA 03-3836, NSDUH Series H-22). Rockville, MD: Substance Abuse and Mental Health Services Administration.

Also available online: http://www.oas.samhsa.gov.

Because of improvements and modifications to the 2002 NSDUH, estimates from the 2002, 2003, 2004, and 2005 surveys should not be compared with estimates from the 2001 or earlier versions of the survey to examine changes over time.


(formerly The NHSDA Report) is published periodically by the Office of Applied Studies, Substance Abuse and Mental Health Services Administration (SAMHSA). All material appearing in this report is in the public domain and may be reproduced or copied without permission from SAMHSA. Additional copies of this report or other reports from the Office of Applied Studies are available online: http://www.oas.samhsa.gov. Citation of the source is appreciated. For questions about this report, please e-mail: shortreports@samhsa.hhs.gov.

This is the page footer.

This page was last updated on July 11, 2008.

SAMHSA, an agency in the Department of Health and Human Services, is the Federal Government's lead agency for improving the quality and availability of substance abuse prevention, addiction treatment, and mental health services in the United States.

This is a line.

   Site Map | Contact Us | AccessibilityPrivacy PolicyFreedom of Information Act
 Disclaimer | Department of Health and Human ServicesSAMHSAWhite HouseUSA.gov

* PDF formatted files require that Adobe Acrobat ReaderĀ® program is installed on your computer. Click here to download this FREE software now from Adobe.