 |
| April 26, 2007 |
Heroin—Changes In How It Is Used: 1995-2005
In Brief
- The proportion of primary heroin admissions who injected the drug declined from 69 percent in 1995 to 63 percent in 2005, while the proportion of primary heroin admissions who inhaled the drug increased from 27 percent in 1995 to 33 percent in 2005
- The proportion of admissions for which medication-assisted opioid therapy was planned fell from 55 percent of primary heroin injection admissions in 1995 to 31 percent in 2005, but remained stable at around 30 percent of primary heroin inhalation admissions
- From 1995 to 2005, the proportion of primary heroin admissions—whether inhalation or injection admissions—receiving ambulatory treatment decreased, while the proportions admitted to residential/rehabilitation treatment or detoxification increased
|
The National Survey on Drug Use and Health (NSDUH) estimates that 379,000 Americans aged 12 or older used heroin in 2005, including 108,000 who used the drug for the first time.1 Routes of administration for heroin include inhalation, injection, smoking, and other means such as oral ingestion. Prior DASIS reports indicated increased inhalation among primary heroin admissions to substance abuse treatment during the 1990s, but also suggested that users may have progressed from inhalation to injection during that time.2 Similarly, this report shows a trend toward inhalation versus injection, although the proportion of users who inhaled the drug has been fairly stable since 2001, at about one third.
Trends in heroin treatment admissions can be monitored with the Treatment Episode Data Set (TEDS), an annual compilation of data on the demographic characteristics and substance abuse problems of those admitted to substance abuse treatment, primarily at facilities that receive some public funding. TEDS records represent admissions rather than individuals, as a person may be admitted to treatment more than once during a single year.3 This report compares trends in primary4 heroin inhalation and injection admissions between 1995 and 2005.
Heroin Treatment Admissions
Annual admissions to substance abuse treatment for primary heroin abuse increased from 228,000 in 1995 to 254,000 in 2005; however, the proportion of primary heroin admissions remained steady at about 14 to 15 percent of all admissions. Between 1995 and 2005, inhalation and injection accounted for at least 94 percent of annual primary heroin admissions.
In every year from 1995 to 2005, most TEDS admissions for primary heroin addiction injected the drug. However, the proportion of primary heroin admissions who injected the drug declined from 69 percent in 1995 to 63 percent in 2005 (despite an 8 percent increase in the number of such admissions over this time period). Although inhalation has remained the second most frequent route of administration, the proportion of primary heroin admissions who inhaled the drug increased from 27 percent in 1995 to 33 percent in 2005.
Demographics
The racial/ethnic composition of primary heroin injection and inhalation admissions to substance abuse treatment changed between 1995 and 2005. During this time, the general increase in the proportion of White primary heroin admissions was observed for both heroin inhalation admissions (from 25 to 30 percent) and heroin injection admissions (from 50 to 61 percent) (Figure 1). Over the same time period, the proportion of admissions who were Black declined for both heroin inhalation admissions (from 47 to 44 percent) and heroin injection admissions (from 20 to 12 percent).
Figure 1. Primary Heroin Admissions, by Race/Ethnicity and Route of Administration: 1995 and 2005
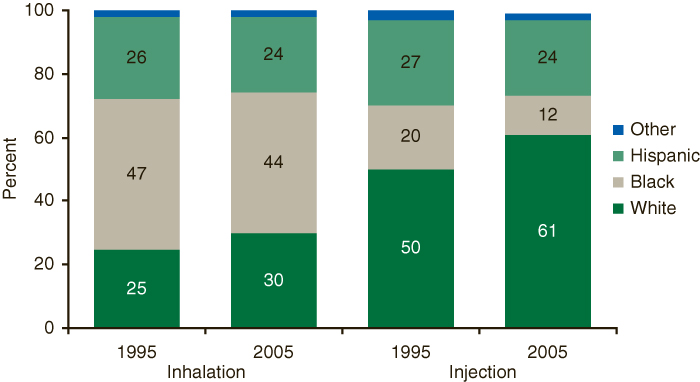 |
Figure 1 Table. Primary Heroin Admissions, by Race/Ethnicity and Route of Administration: 1995 and 2005
| |
Inhalation |
Injection |
| 1995 |
2005 |
1995 |
2005 |
| White |
25% |
30% |
50% |
61% |
| Black |
47% |
44% |
20% |
12% |
| Hispanic |
26% |
24% |
27% |
24% |
| Other |
2% |
2% |
3% |
2% |
| Source: 2005 SAMHSA Treatment Episode Data Set (TEDS). |
There was also a shift in the age at admission of primary heroin injection versus inhalation admissions. In 1995, 37 percent of primary heroin inhalation admissions were younger than 30 years of age at admission; by 2005, this proportion decreased to 22 percent (Figure 2). In contrast, 18 percent of primary heroin injection admissions were younger than 30 years of age at admission in 1995; by 2005, this proportion increased to 36 percent.
Figure 2. Primary Heroin Admissions, by Age Group and Route of Administration: 1995 and 2005
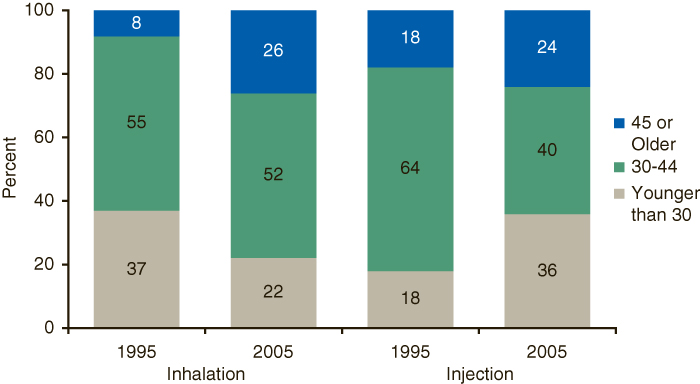 |
Figure 2 Table. Primary Heroin Admissions, by Age Group and Route of Administration: 1995 and 2005
| |
Inhalation |
Injection |
| 1995 |
2000 |
1995 |
2000 |
| Younger than 30 |
37% |
22% |
18% |
36% |
| 30-44 |
55% |
52% |
64% |
40% |
| 45 or Older |
8% |
26% |
18% |
24% |
| Source: 2005 SAMHSA Treatment Episode Data Set (TEDS). |
Service Setting
From 1995 to 2005, the proportion of primary heroin admissions—whether inhalation or injection admissions—receiving ambulatory treatment decreased, while the proportions admitted to other service settings increased.5 Specifically, from 1995 to 2005, the proportion of primary heroin admissions receiving ambulatory treatment decreased by 23 percentage points (from 71 to 48 percent) for injection admissions and by 5 percentage points (from 59 to 54 percent) for inhalation admissions (Figure 3). Necessarily, the proportion of primary heroin admissions using other service settings—residential/rehabilitation or detoxification—rose sharply for injection admissions, and less dramatically for inhalation admissions.
Figure 3. Primary Heroin Admissions, by Service Setting and Route of Administration: 1995 and 2005
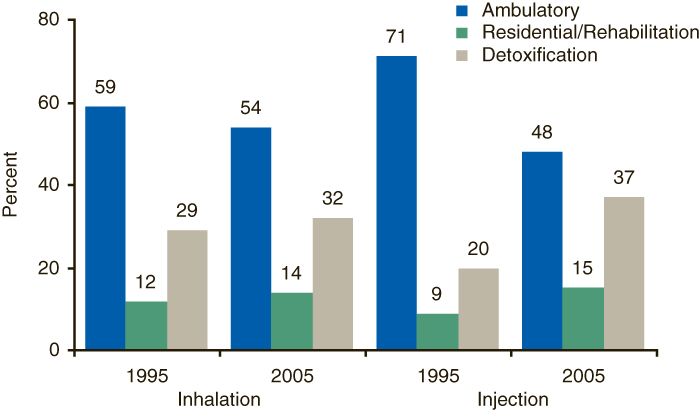 |
Figure 3 Table. Primary Heroin Admissions, by Service Setting and Route of Administration: 1995 and 2005
| |
Inhalation |
Injection |
| 1995 |
2005 |
1995 |
2005 |
| Ambulatory |
59% |
54% |
71% |
48% |
| Residential/Rehabilitation |
12% |
14% |
9% |
15% |
| Detoxification |
29% |
32% |
20% |
37% |
| Source: 2005 SAMHSA Treatment Episode Data Set (TEDS). |
Prior Treatment
The proportion of primary heroin injection admissions entering substance abuse treatment for the first time was relatively steady from 1995 to 2004, varying between 18 and 20 percent before increasing to 23 percent in 2005. However, the proportion of primary heroin inhalation admissions entering treatment for the first time decreased from 33 percent in 1995 to 29 percent in 2005.
Admissions with five or more prior admissions showed a different trend than admissions entering treatment for the first time. From 1995 to 2005, the proportion of admissions with five or more prior admissions decreased slightly among primary heroin injection admissions (from 32 to 30 percent), while that proportion increased among primary heroin inhalation admissions (from 10 to 14 percent).
Opioid Treatment
The proportion of primary heroin injection admissions planning medication-assisted opioid therapy—using methadone, levo-alpha acetyl methadol (LAAM), or buprenorphine—as part of substance abuse treatment declined from 1995 to 2005. In contrast, the proportion planning such therapy remained relatively stable among inhalation admissions (Figure 4).6 While heroin inhalation admissions were consistently less likely than heroin injection admissions to have methadone or buprenorphine included as part of their treatment plan, this difference narrowed in recent years. The proportion of admissions for which medication-assisted opioid therapy was planned fell from 55 percent of primary heroin injection admissions in 1995 to 31 percent in 2005, but remained stable at around 30 percent of primary heroin inhalation admissions.
Figure 4. Medication-assisted Opioid Therapy among Primary Heroin Admissions, by Route of Administration: 1995-2005
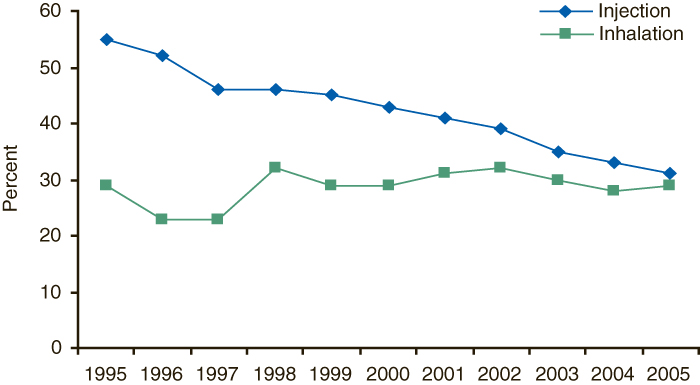 |
Figure 4 Table. Medication-assisted Opioid Therapy among Primary Heroin Admissions, by Route of Administration: 1995-2005
| |
Inhalation |
Injection |
| 1995 |
29% |
55% |
| 1996 |
23% |
52% |
| 1997 |
23% |
46% |
| 1998 |
32% |
46% |
| 1999 |
29% |
45% |
| 2000 |
29% |
43% |
| 2001 |
31% |
41% |
| 2002 |
32% |
39% |
| 2003 |
30% |
35% |
| 2004 |
28% |
33% |
| 2005 |
29% |
31% |
| Source: 2005 SAMHSA Treatment Episode Data Set (TEDS). |
End Notes
1 Substance Abuse and Mental Health Services Administration, Office of Applied Studies. (2006). Results from the 2005 National Survey on Drug Use and Health: National findings (NSDUH Series H-30, DHHS Publication No. SMA 06-4194). Rockville, MD, tables G.3, G.28.
2 Substance Abuse and Mental Health Services Administration, Office of Applied Studies (Rockville, MD), The DASIS report: Heroin—changes in how it is used (July 20, 2001) and Heroin—changes in how it is used: 1992-2002 (December 17, 2004).
3 In 2005, TEDS collected data on 1.8 million admissions to substance abuse treatment facilities. Four States and jurisdictions (AK, DC, NM, and WY) did not submit data for 2005.
4 The primary substance of abuse is the main substance reported at the time of admission.
5 Service settings are of three types: ambulatory, residential/rehabilitative, and detoxification. Ambulatory settings include intensive outpatient, non-intensive outpatient, and ambulatory detoxification. Residential/rehabilitative settings include hospital (other than detoxification), short-term (30 days or fewer), and long-term (more than 30 days). Detoxification includes 24-hour hospital inpatient and 24-hour free-standing residential.
6 Federal treatment standards for the use of methadone or buprenorphine in opioid treatment programs is regulated by SAMHSA under 42 CFR Part 8, as administered by the Center for Substance Abuse Treatment (CSAT). The use of buprenorphine in office-based treatment became possible under the Drug Addiction Treatment Act of 2000 (DATA 2000—21 U.S.C. § 823(g)(2)), also as administered by CSAT. TEDS collects data on whether, at the time of admission, the use of such regulated opioids was planned as part of treatment. TEDS included levo-alpha acetyl methadol (LAAM) as one of these regulated opioids through 2003, but as of 2004 only includes methadone and buprenorphine. Although LAAM is still a legal opioid treatment option, it is no longer on the market due to cardiac side effects. Data to confirm that the plan was implemented and methadone or buprenorphine was used are not available.
Suggested Citation
Substance Abuse and Mental Health Services Administration, Office of Applied Studies. (April 26, 2007). The DASIS Report: Heroin—Changes In How It Is Used: 1995-2005. Rockville, MD.
The Drug and Alcohol Services Information System (DASIS) is an integrated data system maintained by the Office of Applied Studies, Substance Abuse and Mental Health Services Administration (SAMHSA). One component of DASIS is the Treatment Episode Data Set (TEDS). TEDS is a compilation of data on the demographic characteristics and substance abuse problems of those admitted for substance abuse treatment. The information comes primarily from facilities that receive some public funding. Information on treatment admissions is routinely collected by State administrative systems and then submitted to SAMHSA in a standard format. TEDS records represent admissions rather than individuals, as a person may be admitted to treatment more than once. State admission data are reported to TEDS by the Single State Agencies (SSAs) for substance abuse treatment. There are significant differences among State data collection systems. Sources of State variation include completeness of reporting, facilities reporting TEDS data, clients included, and treatment resources available. See the annual TEDS reports for details. Approximately 1.8 million records are included in TEDS each year.
The DASIS Report is prepared by the Office of Applied Studies, SAMHSA; Synectics for Management Decisions, Inc., Arlington, Virginia; and by RTI International in Research Triangle Park, North Carolina (RTI International is a trade name of Research Triangle Institute).
Information and data for this issue are based on data reported to TEDS through February 1, 2006.
Access the latest TEDS reports at:
http://www.oas.samhsa.gov/dasis.htm
Access the latest TEDS public use files at:
http://www.oas.samhsa.gov/SAMHDA.htm
Other substance abuse reports are available at:
http://www.oas.samhsa.gov
|
| The DASIS Report is published periodically by the Office of Applied Studies, Substance Abuse and Mental Health Services Administration (SAMHSA). All material appearing in this report is in the public domain and may be reproduced or copied without permission from SAMHSA. Additional copies of this report or other reports from the Office of Applied Studies are available on-line: http://www.oas.samhsa.gov. Citation of the source is appreciated. For questions about this report please e-mail: shortreports@samhsa.hhs.gov. |
|

This page was last updated on July 11, 2008.
|