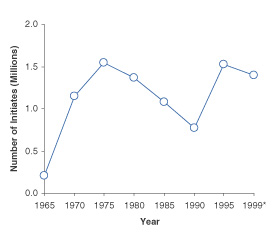
Figure 1. Estimated Numbers of Youths Aged 12 to 17 Who First Used Marijuana During the Years 1965 to 1999
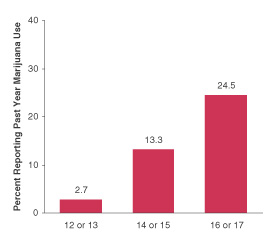
Figure 2. Percentages of Youths Aged 12 to 17 Reporting Past Year Marijuana Use, by Age Group: 2000

July 19, 2002 |
| Marijuana Use among Youths |
|
In Brief |
|
| The National Household Survey on Drug Abuse (NHSDA) asks respondents to report on past year use and age at first use of marijuana. Respondents aged 12 to 17 were also asked to report whether they had been enrolled in any type of school at any time during the year before the survey. Youths enrolled in school were asked to report their average letter grade for the last semester or grading period they completed. |
|
Prevalence of Marijuana Use among Youths In 2000, the NHSDA estimated that over 3 million, or 13 percent, of the 23 million youths aged 12 to 17 used marijuana during the year prior to the survey. The rate of past year marijuana use was lower for youths compared with the rate for young adults aged 18 to 25 (24 percent), but it was higher than the rate for adults aged 26 or older (5 percent). |
|
Trends in Initiation of Marijuana Use among Youths Between 1996 and 1999, the number of youths aged 12 to 17 trying marijuana for the first time each year was greater than during the prior 20 years (Figure 1). Approximately 1,690,000 youths first used marijuana during 1996, more than during any other year since 1978. However, the number of youths trying marijuana for the first time decreased to 1,392,000 by 1999. |
|
Figure 1. Estimated Numbers of Youths Aged 12 to 17 Who First Used Marijuana During the Years 1965 to 1999 |
Figure 2. Percentages of Youths Aged 12 to 17 Reporting Past Year Marijuana Use, by Age Group: 2000 |
| |
|
|
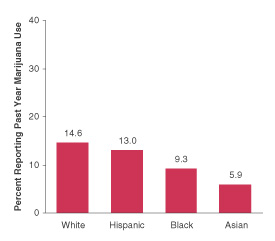
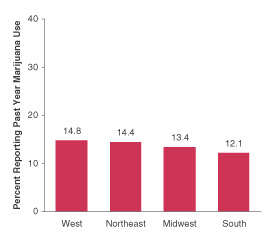
Demographic Differences in Prevalence Older youths were more likely to have used marijuana during the past year than younger youths (Figure 2). Almost 25 percent of youths aged 16 or 17 reported past year marijuana use compared with 3 percent of 12 or 13 year olds. White youths were more likely to have used marijuana during the past year (15 percent) than Hispanic (13 percent), black (9 percent), or Asian youths (6 percent) (Figure 3). Although males were more likely than females to have used marijuana during the past year among adults aged 18 or older, there were no gender differences in past year marijuana use among youths. For example, among 18 to 25 year olds, males were more likely to have used marijuana during the past year than females (28 percent of males vs. 20 percent of females), but among youths, rates of past year marijuana use were similar (14 percent of males, 13 percent of females). Youths living in the South (12 percent) were less likely than youths living in the Northeast (14 percent) and West (15 percent) to report past year marijuana use (Figure 4).1 Youths living in small metropolitan areas were more likely to have used marijuana during the past year (14 percent) than youths living in large metropolitan (13 percent) or non-metropolitan areas (13 percent).2 |
|
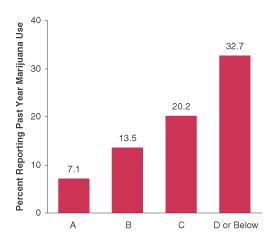
Academic Performance and Marijuana Use among Youths In 2000, almost 30 percent of youths aged 12 to 17 enrolled in school earned an A average during the last semester or grading period they completed, 41 percent earned a B average, 23 percent earned a C average, and 7 percent earned an average of D or below.3 Prior research has associated poor grades with substance use among youths.4,5 Rates of past year marijuana use were higher among youths with lower grades than among those with higher grades (Figure 5). For example, youths with an average grade of D or below were more than 4 times as likely to have used marijuana in the past year (33 percent) as youths who reported an average grade of A (7 percent). |
|
Figure 3. Percentages of Youths Aged 12 to 17 Reporting Past Year Marijuana Use, by Race/Ethnicity: 2000** |
Figure 4. Percentages of Youths Aged 12 to 17 Reporting Past Year Marijuana Use, by Geographic Region: 2000 |
 |
|
|
Figure 5. Percentages of Youths Aged 12 to 17 Enrolled in School Reporting Past Year Marijuana Use, by Average Grades for the Last Semester or Grading Period Completed: 2000 |
 |
|
End Notes
Figure Notes *Estimated using 2000 data only. **Indian/Alaska Native, Native Hawaiian/Other Pacific Islander, and multiracial youths are not included in these analyses. Source (Figure 1): SAMHSA 1999 and 2000 NHSDAs. Source (Figures 2-5): SAMHSA 2000 NHSDA.
|
Other reports from the Office of Applied Studies are also available on-line on the OAS home page: http://www.oas.samhsa.gov
|
This page was last updated on December 31, 2008. |
|
SAMHSA, an agency in the Department of Health and Human Services, is the Federal Government's lead agency for improving the quality and availability of substance abuse prevention, addiction treatment, and mental health services in the United States. 
* PDF formatted files require that Adobe Acrobat Reader® program is installed on your computer. Click here to download this FREE software now from Adobe. |