Skip
To Content
 |
| Issue 39 |
2006 |
How Young Adults Obtain Prescription Pain Relievers for Nonmedical Use
In Brief
- In 2005, 12.4 percent of young adults aged 18 to 25 used prescription pain relievers nonmedically in the past year, and 1.7 percent met the criteria for past year prescription pain reliever dependence or abuse
- Among young adults aged 18 to 25 who used prescription pain relievers nonmedically in the past year, over half (53.0 percent) obtained them from a friend or relative for free when they last used pain relievers nonmedically
- Among young adults aged 18 to 25 who used prescription pain relievers nonmedically in the past year and met the criteria for prescription pain reliever dependence or abuse, 37.5 percent obtained the prescription pain relievers that they used most recently for nonmedical purposes for free from a friend or relative, 19.9 percent bought them from a friend or relative, and 13.6 percent obtained them from one doctor
|
There has been a growing concern in both the law enforcement and public health arenas about the increase in the use of pharmaceutical drugs for nonmedical use, especially among young adults.1-3 The National Survey on Drug Use and Health (NSDUH) asks persons aged 12 or older questions related to their nonmedical use of prescription-type drugs, including prescription pain relievers, during the past year.4 The 2005 NSDUH also asks individuals who used prescription pain relievers nonmedically in the past year how they obtained prescription pain relievers the last time they used them.5 Responses included (1) got one or more pre-scriptions for pain relievers from just one doctor; (2) got prescriptions for pain relievers from more than one doctor; (3) wrote fake prescriptions for pain relievers; (4) stole the pain relievers from a doctor's office, clinic, hospital, or pharmacy; (5) got the pain relievers from a friend or relative for free; (6) bought the pain relievers from a friend or relative; (7) took the pain relievers from a friend or relative without asking; (8) bought the pain relievers from a drug dealer or other stranger; (9) bought the pain relievers on the Internet; and (10) got the pain relievers in some other way. Respondents who had gotten the prescription pain relievers in some other way were asked to indicate the specific way(s) they got them.
This report focuses on the prevalence of past year nonmedical use of prescription pain relievers among young adults aged 18 to 25 and how they obtained the prescription pain relievers they used most recently for nonmedical purposes. All findings presented in this report are based on 2005 NSDUH data.
Nonmedical Use of Prescription Pain Relievers in the Past Year
In 2005, 12.4 percent of young adults aged 18 to 25 (4.0 million persons) used prescription pain relievers nonmedically in the past year, and 1.7 percent met the criteria for past year prescription pain reliever dependence or abuse. In this age group, males were more likely than females to have used prescription pain relievers nonmedically in the past year (13.5 vs. 11.3 percent) (Table 1). Unemployed persons aged 18 to 25 were more likely to have used prescription pain relievers nonmedically (15.5 percent) than those employed part time or full time or those in the "other" employment group (12.6, 12.2, and 11.3 percent, respectively).6 Among young adults aged 18 to 22, the prevalence of past year nonmedical prescription pain reliever use did not differ significantly between those enrolled and those not enrolled in college.7
Table 1. Percentages of Past Year Nonmedical Prescription Pain Reliever Use among Persons Aged 18 to 25, by Demographic Characteristics: 2005 NSDUH
| Characteristic |
2005 |
| Number |
Percentage |
Standard Error |
| Total |
4,030 |
12.4 |
0.30 |
| Gender |
|
|
|
| Males |
2,211 |
13.5 |
0.45 |
| Females |
1,819 |
11.3 |
0.39 |
| Employment Status |
|
|
|
| Full-Time |
1,875 |
12.2 |
0.42 |
| Part-Time |
1,040 |
12.6 |
0.59 |
| Unemployed |
400 |
15.5 |
1.16 |
| Other |
715 |
11.3 |
0.65 |
| College Enrollment* |
|
|
|
| Enrolled in College |
1,292 |
13.4 |
0.61 |
| Not Enrolled in College |
1,558 |
13.7 |
0.50 |
| Source: SAMHSA, 2005 NSDUH. |
Method of Obtaining Prescription Pain Relievers for Nonmedical Purposes
Among young adults aged 18 to 25 who used prescription pain relievers nonmedically in the past year, over half (53.0 percent) obtained them from a friend or relative for free when they last used pain relievers nonmedically (Figure 1). The other most commonly mentioned methods were that they obtained their most recently used prescription pain relievers for nonmedical purposes from one doctor (12.7 percent) and that they bought them from a friend or relative (10.6 percent). Young adult females were more likely than their male counterparts to have obtained the prescription pain relievers that they used most recently for nonmedical purposes for free from a friend or relative (58.9 vs. 48.2 percent). Conversely, males were nearly twice as likely as females to have bought their most recently used prescription pain relievers from a friend or relative (13.4 vs. 7.2 percent) and three times as likely to have bought them from a drug dealer or other stranger (6.9 vs. 2.3 percent).
Figure 1. Percentages of Reported Method** of Obtaining Prescription Pain Relievers for Their Most Recent Nonmedical Use in the Past Year among Persons Aged 18 to 25: 2005 NSDUH
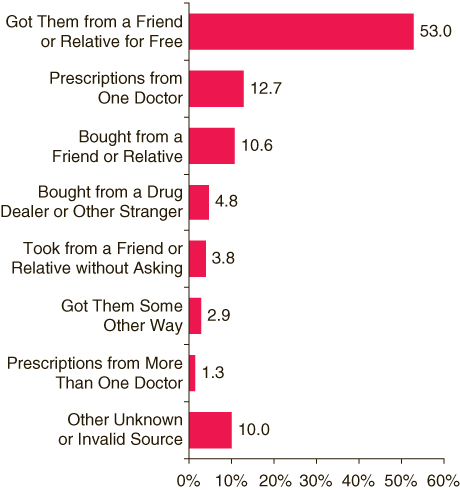 |
Figure 1 Table. Percentages of Reported Method** of Obtaining Prescription Pain Relievers for Their Most Recent Nonmedical Use in the Past Year among Persons Aged 18 to 25: 2005 NSDUH
| Reported Method of Obtaining Prescription Pain Relievers |
Percentage |
| Got Them from a Friend or Relative for Free |
53.0 |
| Prescriptions from One Doctor |
12.7 |
| Bought from a Friend or Relative |
10.6 |
| Bought from a Drug Dealer or Other Stranger |
4.8 |
| Took from a Friend or Relative without Asking |
3.8 |
| Got Them Some Other Way |
2.9 |
| Prescriptions from More Than One Doctor |
1.3 |
| Other Unknown or Invalid Source |
10.0 |
| Source: SAMHSA, 2005 NSDUH. |
Among young adults aged 18 to 25 who used prescription pain relievers nonmedically in the past year and met the criteria for prescription pain reliever dependence or abuse, 37.5 percent obtained the prescription pain relievers that they used most recently for nonmedical purposes for free from a friend or relative, 19.9 percent bought them from a friend or relative, and 13.6 percent obtained them from one doctor (Figure 2). Young adult females who met the criteria for prescription pain reliever dependence or abuse were more likely than their male counterparts to have obtained their most recently used prescription pain relievers from a friend or relative for free (46.6 vs. 30.6 percent) and were less likely to have bought them from a drug dealer or other stranger (8.1 vs. 15.9 percent).
Figure 2. Percentages of Reported Method*** of Obtaining Prescription Pain Relievers for Their Most Recent Nonmedical Use among Persons Aged 18 to 25 Who Were Dependent on or Abused Prescription Pain Relievers in the Past Year: 2005 NSDUH
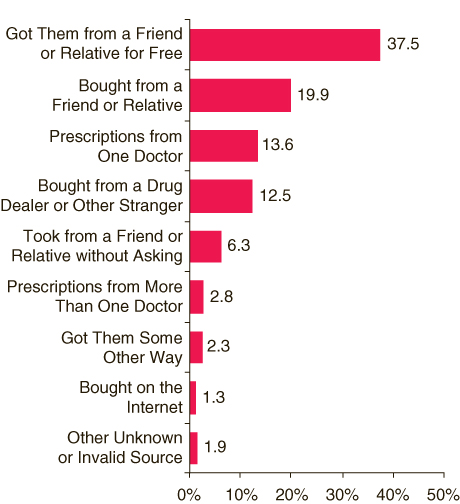 |
Figure 2 Table. Percentages of Reported Method*** of Obtaining Prescription Pain Relievers for Their Most Recent Nonmedical Use among Persons Aged 18 to 25 Who Were Dependent on or Abused Prescription Pain Relievers in the Past Year: 2005 NSDUH
| Reported Method of Obtaining Prescription Pain Relievers |
Percentage |
| Got Them from a Friend or Relative for Free |
37.5 |
| Bought from a Friend or Relative |
19.9 |
| Prescriptions from One Doctor |
13.6 |
| Bought from a Drug Dealer or Other Stranger |
12.5 |
| Took from a Friend or Relative without Asking |
6.3 |
| Prescriptions from More Than One Doctor |
2.8 |
| Got Them Some Other Way |
2.3 |
| Bought on the Internet |
1.3 |
| Other Unknown or Invalid Source |
1.9 |
| Source: SAMHSA, 2005 NSDUH. |
End Notes
1 Office of National Drug Control Policy. (2004, January). Pulse check: Trends in drug abuse (NCJ 201398). Washington, DC: The White House, Executive Office of the President. [Available at http://www.whitehousedrugpolicy.gov/publications/drugfact/pulsechk/january04/index.html]
2 National Institute on Drug Abuse. (2002, December). Community Epidemiology Work Group: Epidemiologic trends in drug abuse advance report. Bethesda, MD: U.S. Department of Health and Human Services, National Institutes of Health. [Available at http://www.drugabuse.gov/about/organization/CEWG/AdvancedRep/1202adv/1202adv.html]
3 Office of Applied Studies. (2006). Results from the 2005 National Survey on Drug Use and Health: National findings (DHHS Publication No. SMA 06-4194, NSDUH Series H-30). Rockville, MD: Substance Abuse and Mental Health Services Administration. [Available at http://www.oas.samhsa.gov/p0000016.htm#2k5]
4 Nonmedical use is defined as the use of prescription-type drugs not prescribed for the respondent by a physician or used only for the experience or feeling they caused. Nonmedical use of any prescription-type pain relievers does not include use of over-the-counter drugs.
5 The estimates for the method for most recent nonmedical use include (a) past month users who reported a single source of obtainment during the past 30 days, (b) past month users who identified their last method of obtainment after reporting multiple methods of obtainment in the past 30 days, and (c) all other past year users who reported their last method of obtainment in the past year.
6 Respondents in the "other" employment group included individuals considered not to be in the labor force, such as retired persons, students only, homemakers, or disabled persons.
7 NSDUH asks young adults aged 18 to 22 about college enrollment. For this analysis, respondents were classified as college students if they reported that they were full-time or part-time students in their first through fourth year (or higher) at a college or university. Respondents who were on break from college were considered enrolled if they intended to return to college or university when the break ended. Respondents whose current college enrollment status was unknown were excluded from the analysis.
Table and Figure Notes
* NSDUH asks young adults aged 18 to 22 about college enrollment. For this analysis, respondents were classified as college students if they reported that they were full-time or part-time students in their first through fourth year (or higher) at a college or university. Respondents who were on break from college were considered enrolled if they intended to return to college or university when the break ended. Respondents whose current college enrollment status was unknown were excluded from the analysis.
** The following response options were reported at less than 1 percent and, therefore, are not shown: "Wrote a Fake Prescription," "Bought on the Internet," and "Stole Them from a Health Facility."
*** The following response options were reported at less than 1 percent and are not shown: "Wrote a Fake Prescription" and "Stole Them from a Health Facility."
The National Survey on Drug Use and Health (NSDUH) is an annual survey sponsored by the Substance Abuse and Mental Health Services Administration (SAMHSA). Prior to 2002, this survey was called the National Household Survey on Drug Abuse (NHSDA). The 2005 data are based on information obtained from 22,511 persons aged 18 to 25. The survey collects data by administering questionnaires to a representative sample of the population through face-to-face interviews at their place of residence.
The NSDUH Report is prepared by the Office of Applied Studies (OAS), SAMHSA, and by RTI International in Research Triangle Park, North Carolina. (RTI International is a trade name of Research Triangle Institute.)
Information on NSDUH used in compiling data for this issue is available in the following publication:
Office of Applied Studies. (2006). Results from the 2005 National Survey on Drug Use and Health: National findings (DHHS Publication No. SMA 06-4194, NSDUH Series H-30). Rockville, MD: Substance Abuse and Mental Health Services Administration.
Also available online: http://www.oas.samhsa.gov.
Because of improvements and modifications to the 2002 NSDUH, estimates from the 2002, 2003, 2004, and 2005 surveys should not be compared with estimates from the 2001 or earlier versions of the survey to examine changes over time. |
| The NSDUH Report (formerly The NHSDA Report) is published periodically by the Office of Applied Studies, Substance Abuse and Mental Health Services Administration (SAMHSA). All material appearing in this report is in the public domain and may be reproduced or copied without permission from SAMHSA. Additional copies of this report or other reports from the Office of Applied Studies are available online: http://www.oas.samhsa.gov. Citation of the source is appreciated. For questions about this report, please e-mail: shortreports@samhsa.hhs.gov. |
|

This page was last updated on July 11, 2008. |