
Ozone Hole Watch
December 31, 2008
- Data Sources
- OMI
- TOMS
- GOME
- NOAA SBUV/2
- MLS
- Balloon Sondes
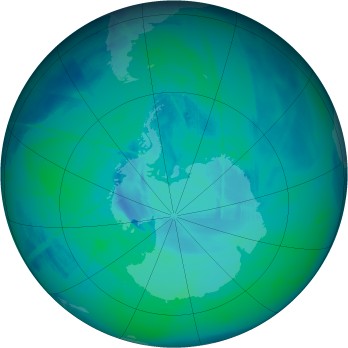
This is the Ozone Hole Watch web site, where you can check on the latest status of the ozone layer over the South Pole. Satellite instruments monitor the ozone layer, and we use their data to create the images that depict the amount of ozone. The blue and purple colors are where there is the least ozone, and the greens, yellows, and reds are where there is more ozone.
Latest Information
The 2008 ozone hole season is over. This site will be updated if any of the data products are reprocessed. The 2009 ozone hole season will begin in July.
A high-resolution TIFF image of the largest ozone hole, suitable for print media, is available.
Last 7 Days
| — click on a globe for a high-resolution image — | ||||||
|---|---|---|---|---|---|---|
 12/25
12/25
|
 12/26
12/26
|
 12/27
12/27
|
 12/28
12/28
|
 12/29
12/29
|
 12/30
12/30
|
 12/31
12/31
|
Animations
- Daily, 2008 (1280 X 720):
- Daily, 2007 (1280 X 720):
- Monthly averages (1280 X 720):
Meteorology
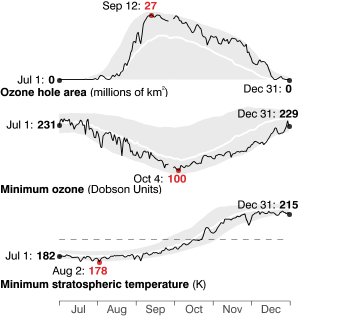
Year-to-date
The depth and size of the Antarctic ozone hole are governed by the temperature of the stratosphere and amount of sunlight reaching the south polar region. The graphs below show the progress of this year’s ozone hole, compared to the highest and lowest values measured since 1979.
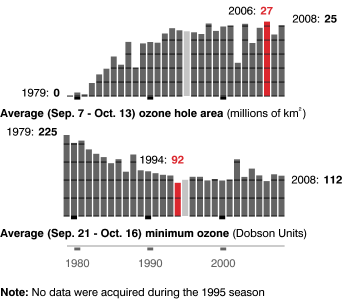
Annual record since 1979
The severity of the ozone hole varies somewhat from year to year. These fluctuations are superimposed on a trend extending over the last three decades. The graphs below show these variations. The red bars indicate the largest area and the lowest minimum value.
Ozone Facts
What is Ozone?
Ozone is a colorless gas. Chemically, ozone is very active; it reacts readily with a great many other substances. Near the Earth’s surface, those reactions cause rubber to crack, hurt plant life, and damage people’s lung tissues. But ozone also absorbs harmful components of sunlight, known as “ultraviolet B”, or “UV-B”. High above the surface, above even the weather systems, a tenuous layer of ozone gas absorbs UV-B, protecting living things below.
What is a Dobson Unit?
The Dobson Unit (DU) is the unit of measure for total ozone. If you were to take all the ozone in a column of air stretching from the surface of the earth to space, and bring all that ozone to standard temperature (0 °Celsius) and pressure (1013.25 millibars, or one atmosphere, or “atm”), the column would be about 0.3 centimeters thick. Thus, the total ozone would be 0.3 atm-cm. To make the units easier to work with, the “Dobson Unit” is defined to be 0.001 atm-cm. Our 0.3 atm-cm would be 300 DU.
What is the Ozone Hole?
Each year for the past few decades during the Southern Hemisphere spring, chemical reactions involving chlorine and bromine cause ozone in the southern polar region to be destroyed rapidly and severely. This depleted region is known as the “ozone hole”.
The area of the ozone hole is determined from a map of total column ozone. It is calculated from the area on the Earth that is enclosed by a line with a constant value of 220 Dobson Units. The value of 220 Dobson Units is chosen since total ozone values of less than 220 Dobson Units were not found in the historic observations over Antarctica prior to 1979. Also, from direct measurements over Antarctica, a column ozone level of less than 220 Dobson Units is a result of the ozone loss from chlorine and bromine compounds.