History
How We Map
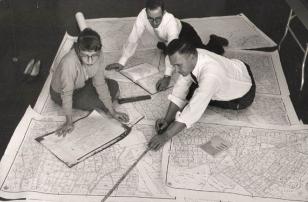
Census Bureau cartographers prepare maps for the
1960 census. - View Larger
As the United States expanded and cities grew, there was a need to have accurate maps to locate where people lived and new concepts to classify patterns of settlement. Over the decades new terms such as urban areas, metropolitan areas, census county divisions and census tracts were added to the list of Census Bureau geographic entities.
With new housing developments and suburbs springing up after World War II, new procedures and mechanisms were needed to help the Census Bureau map and keep track of annexations and other boundary changes.
As the demand for more, accurate and up-to-date statistics grew, there was a need to represent that information in an easy to understand format, such as thematic maps.
This section traces the development of several classification techniques that the Census Bureau uses to both collect and disseminate information on a regional and local level. These geographic tools have made it possible to analyze census data on a very local level, making it more useful and much more detailed.


