Published online before print January 11, 2006, doi: 10.1161/CIRCULATIONAHA.105.171600
| ||||||||||||||||||||||||||||||||||||||||||||||||||||||||||||||||||||||||||||||||||||||||||||
(Circulation. 2006;113:e85-e151.)
© 2006 American Heart Association, Inc.
AHA Statistical Update |
Heart Disease and Stroke Statistics—2006 Update
A Report From the American Heart Association Statistics Committee and Stroke Statistics Subcommittee
| Table of Contents |
|---|
- About These Statistics
- Cardiovascular Diseases
- Coronary Heart Disease, Acute Coronary Syndrome and Angina Pectoris
- Stroke and Stroke in Children
- High Blood Pressure (and End-Stage Renal Disease)
- Congenital Cardiovascular Defects
- Heart Failure
- Other Cardiovascular Diseases
- –Arrhythmias (Disorders of Heart Rhythm)
- –Arteries, Diseases of (including Peripheral Arterial Disease)
- –Bacterial Endocarditis
- –Cardiomyopathy
- –Rheumatic Fever/Rheumatic Heart Disease
- –Valvular Heart Disease
- –Venous Thromboembolism
- –Arteries, Diseases of (including Peripheral Arterial Disease)
- –Arrhythmias (Disorders of Heart Rhythm)
- Risk Factors
- –Tobacco
- –High Blood Cholesterol and Other Lipids
- –Physical Inactivity
- –Overweight and Obesity
- –Diabetes Mellitus
- –High Blood Cholesterol and Other Lipids
- –Tobacco
- Metabolic Syndrome
- Nutrition
- Quality of Care
- Medical Procedures
- Economic Cost of Cardiovascular Diseases
- At-a-Glance Summary Tables
- –Men and Cardiovascular Diseases
- –Women and Cardiovascular Diseases
- –Ethnic Groups and Cardiovascular Diseases
- –Children, Youth and Cardiovascular Diseases
- –Women and Cardiovascular Diseases
- –Men and Cardiovascular Diseases
- Glossary and Abbreviation Guide
- Acknowledgment
- References
Appendix I: List of Statistical Fact Sheets. URL: http://www.americanheart.org/presenter.jhtml?identifier=2007
| 1. About These Statistics |
|---|
The American Heart Association works with the Centers for Disease Control and Prevention’s National Center for Health Statistics (CDC/NCHS), the National Heart, Lung, and Blood Institute (NHLBI), the National Institute of Neurological Disorders and Stroke (NINDS), and other government agencies to derive the annual statistics in this update. This section describes the most important sources we use. For more details and an alphabetical list of abbreviations, see the Glossary and Abbreviation Guide.
All statistics are for the most recent year available. Prevalence, mortality and hospitalizations are computed for 2003 unless otherwise noted. Mortality as an underlying or contributing cause of death is for 2002. Economic cost estimates are for 2006. Due to late release of data, some disease mortality are not updated to 2003. Mortality for 2003 are underlying preliminary data, obtained from the NCHS publication National Vital Statistics Report: Deaths: Preliminary Data for 2003 (NVSR, 2005;53:15) and from unpublished tabulations furnished by Robert Anderson of NCHS. US and state death rates and prevalence rates are age-adjusted per 100 000 population (unless otherwise specified) using the 2000 US standard for age standardization.
Morbidity (illness) and mortality (death) data in the United States use a standard classification system—the International Classification of Diseases (ICD). About every 10–20 years, the ICD codes are revised to reflect changes over time in medical technology, diagnosis or terminology. Effective with mortality data for 1999, we’re using the tenth revision (ICD/10). It will be a few more years before the tenth revision is used for hospital discharge data.
Prevalence
Prevalence is an estimate of how many people have a disease at a given point in time. Government agencies periodically conduct health examination surveys. Rates for specific diseases are calculated from those surveys. These rates are applied as the population changes for several years, until a new health examination survey is done and new rates are established. It’s important to realize that the prevalence rates do not change from year to year until there is a new survey.
The annual changes in prevalence as reported in this update only reflect changes in the population. It’s impossible to develop a prevalence "trend" by comparing numbers from yearly versions of this update or its precursors. Many of our prevalence estimates come from the NHANES studies of the CDC/NCHS, and the ARIC, CHS and FHS studies of the NHLBI. Coronary heart disease (CHD), myocardial infarction (MI), angina pectoris (AP) and stroke prevalence are based on self-reports in national health interviews.
Incidence
Incidence is an estimate of the number of new cases of a disease that develop in a population in a 1-year period. For some statistics, new and recurrent attacks or cases are combined.
The incidence of a specific cardiovascular disease (CVD) in the United States is estimated by multiplying the incidence rates reported in community- or hospital-based studies by the US population. The rates change only when new data are available; they are not computed annually. The estimates were revised to reflect the 2000 US Census. Do not compare the incidence or the rates with those in past issues of the Heart and Stroke Statistical Update (renamed Heart Disease and Stroke Statistics Update). Doing so can lead to serious misinterpretation of time trends.
Our incidence estimates for the various cardiovascular diseases are extrapolations from the Framingham Heart Study (FHS), Atherosclerosis Risk in Communities (ARIC) study and Cardiovascular Health Study (CHS) conducted by the NHLBI and Greater Cincinnati/Northern Kentucky Stroke Study and others conducted by the NIH.
Note: data published by governmental agencies for some racial groups, are considered unreliable due to the small sample size in the studies. Since we try to provide data for as many racial groups as possible, we show these data for informational and comparative purposes, etc.
If you have questions about statistics or any points made in this booklet, please contact the Biostatistics Program Coordinator at the American Heart Association National Center, nancy.haase@heart.org, 214-706-1423. Direct all media inquiries to News Media Relations at inquiries@heart.org or 214-706-1173.
We do our utmost to ensure that this update is error-free. If we discover errors after publication, we’ll provide corrections at our Web site, http://www.americanheart.org/statistics.
| 2. Cardiovascular Diseases |
|---|
(ICD/9 390–459, 745–747) (ICD/10 I00–I99, Q20–Q28; see Glossary for details and definitions). See Table 2A.
|
Prevalence
Of the 71 300 000 American adults with 1 or more types of cardiovascular disease (CVD), 27 400 000 are estimated to be age 65 or older (National Health and Nutrition Examination Survey [NHANES 1999–2002], CDC/NCHS). Bullet points below are from NHANES 1999–2002 unless otherwise noted.
The following are the latest estimates of prevalence for these conditions. Due to overlap, it is not possible to add these conditions to arrive at a total.
- High blood pressure (HBP)—65 000 000. (Defined as systolic pressure 140 mm Hg or greater and/or diastolic pressure 90 mm Hg or greater, taking antihypertensive medication or being told at least twice by a physician or other health professional that you have high blood pressure.)
- Coronary heart disease (CHD)—13 200 000.
- –Myocardial infarction (MI, or heart attack)—7 200 000.
- –Angina pectoris (AP, or chest pain)—6 500 000.
- –Angina pectoris (AP, or chest pain)—6 500 000.
- –Myocardial infarction (MI, or heart attack)—7 200 000.
- Heart failure (HF)—5 000 000.
- Stroke—5 500 000.
- Congenital cardiovascular defects—1 000 000 (Unpublished NHIS survey data, 1993–95, CDC/NCHS).
- 1 in 3 adult men and women has some form of CVD (NHANES 1999–02, CDC/NCHS).
- The following prevalence estimates are for people age 18 and older1:
- –Among whites only, 11.4% have heart disease, 5.9% have CHD, 20.5% have hypertension and 2.3% have had a stroke.
- –Among blacks or African Americans only, 9.9% have heart disease, 5.3% have CHD, 31.6% have hypertension and 3.5% have had a stroke.
- –Among Hispanics or Latinos, 7.7% have heart disease, 4.5% have CHD, 19.0% have hypertension and 2.2% have had a stroke.
- –Among Asians, 5.6% have heart disease, 3.8% have CHD, 16.1% have hypertension and 1.8% have had a stroke.
- –Among Native Hawaiians or other Pacific Islanders, 16.6% have heart disease, 4.9% have CHD, and 18.2% have hypertension.
- –Among American Indians or Alaska Natives, 13.8% have heart disease, 8.2% have CHD, 23.9% have hypertension and 3.1% have had a stroke.
- –Among blacks or African Americans only, 9.9% have heart disease, 5.3% have CHD, 31.6% have hypertension and 3.5% have had a stroke.
- –Among whites only, 11.4% have heart disease, 5.9% have CHD, 20.5% have hypertension and 2.3% have had a stroke.
Incidence
- Based on the NHLBI’s Framingham Heart Study (FHS) in its 44-year follow-up of participants and the 20-year follow-up of their offspring2...
- –The average annual rates of first major cardiovascular events rise from 7 per 1000 men at ages 35–44 to 68 per 1000 at ages 85–94. For women, comparable rates occur 10 years later in life. The gap narrows with advancing age.
- –Under age 75, a higher proportion of CVD events due to CHD occur in men than in women, and a higher proportion of events due to congestive heart failure (CHF) occur in women than in men.
- –Under age 75, a higher proportion of CVD events due to CHD occur in men than in women, and a higher proportion of events due to congestive heart failure (CHF) occur in women than in men.
- –The average annual rates of first major cardiovascular events rise from 7 per 1000 men at ages 35–44 to 68 per 1000 at ages 85–94. For women, comparable rates occur 10 years later in life. The gap narrows with advancing age.
- Among American Indian men ages 45–74, the incidence of CVD ranges from 15 to 28 per 1000. Among women it ranges from 9 to 15 per 1000.3
- Data from the FHS indicate that the lifetime risk for CVD is 2 in 3 for men and more than 1 in 2 for women at age 40 (personal communication, Donald Lloyd-Jones, MD).
Mortality
- Preliminary mortality data show that CVD as the underlying cause of death accounted for 37.3% of all 2 440 000 deaths in 2003 or 1 of every 2.7 deaths in the United States. CVD as an underlying or contributing cause of death (1 408 000 deaths in 2002) was about 58% of all deaths that year.
- Since 1900, CVD has been the No. 1 killer in the United States every year but 1918. Nearly 2500 Americans die of CVD each day, an average of 1 death every 35 seconds. CVD claims more lives each year than the next 4 leading causes of death combined, which are cancer, chronic lower respiratory diseases, accidents, and diabetes mellitus.
- The 2003 overall preliminary death rate from CVD was 308.8. The rates were 359.1 for white males and 479.6 for black males; 256.2 for white females and 354.8 for black females. From 1993–2003, death rates from CVD (ICD/10 I00–I99) declined 22.1%. In the same 10-year period actual CVD deaths declined 4.6%.
- Other causes of death in 2003—cancer 554 643; accidents 105 695; Alzheimer’s disease 63 343; HIV (AIDS) 13 544. (preliminary data)
- The 2003 preliminary CVD death rates were 364.2 for males and 262.5 for females. Cancer death rates were 232.3 for males and 160.2 for females. Breast cancer claimed the lives of 41 566 females in 2003; lung cancer claimed 67 894. Death rates for females were 25.2 for breast cancer and 41.1 for lung cancer. One in 30 female deaths are from breast cancer, while 1 in 2.6 are from CVD. Based on preliminary 2003 mortality, CVD caused about a death a minute among females—over 480 000 female lives every year. That’s more female lives than were claimed by the next five leading causes of death combined (cancer, COPD, Alzheimer’s, diabetes and accidents).
- Over 152 000 Americans killed by CVD each year are under age 65. In 2002, 32% of deaths from CVD occurred prematurely (ie, before age 75, which is close to the average life expectancy).
- In 2002, the age-adjusted death rate for diseases of the heart in American Indians or Alaska Natives was 201.2 for males and 123.6 for females; for Asians or Pacific Islanders it was 169.8 for males and 108.1 for females; for Hispanics or Latinos it was 219.8 for males and 149.7 for females (Health, United States, 2004; CDC/NCHS).
- According to the CDC/NCHS, if all forms of major CVD were eliminated, life expectancy would rise by almost 7 years. If all forms of cancer were eliminated, the gain would be 3 years. According to the same study, the probability at birth of eventually dying from major CVD (I00–I78) is 47%, and the chance of dying from cancer is 22%. Additional probabilities are 3% for accidents, 2% for diabetes and 0.7% for HIV.4
- Based on revised 2000 population data, the average life expectancy of people born in the United States in 2003 is 77.6 years (preliminary data for 2003. NSVR, Vol. 53, No. 15, Hyattsville, Md: National Center for Health Statistics, 2005).
- In 2001, the proportion of premature deaths (<65 years) from diseases of the heart (I00–I09, I11, I13, I20–I51) was greatest among American Indians or Alaska Natives (36%) and blacks (31.5%) and lowest among whites (14.7%). Premature death was higher for Hispanics (23.5%) than non-Hispanics (16.5%), and for males (24%) than females (10%). Hispanic whites (23.3%) had lower proportions than Hispanic blacks (27.5%), and non-Hispanic (NH) whites (14.4%) had lower proportions than NH blacks (31.5%).5
- Age-adjusted death rates for diseases of the heart from 1990–98 declined 17% for Hispanics, 15% for NH whites, 14% for Asians/Pacific Islanders, 11% for NH blacks, and 8% for American Indians or Alaska Natives. In 1998 the rate for NH blacks was 2.8 times the rate for Asian or Pacific Islanders.6
Out-of-Hospital Cardiac Arrest
There is a wide variation in the reported incidence and outcome for out-of-hospital cardiac arrest. These differences are due to in part to differences in definition and ascertainment of cardiac arrest, as well as differences in treatment after its onset.
Cardiac arrest is the cessation of cardiac mechanical activity as confirmed by the absence of signs of circulation.6a Available epidemiological databases do not record deaths due to cardiac arrest or the subset of cases that occur with sudden onset (sudden cardiac arrest). Therefore, surrogate data are often used for epidemiological purposes to estimate the incidence of cardiac arrest, especially in the out-of-hospital setting. Those surrogate data include deaths due to "coronary heart disease" (ICD codes I20-I25) and "cardiac arrest," defined as coronary death that occurred within 1 hour of symptom onset in the out-of-hospital setting, and without other probable cause of death.6b Datasets based on either definition are not optimal. Out-of-hospital data that are based on the latter definition of cardiac arrest can be especially unreliable because of the difficulty in determining the duration of symptoms prior to the onset of the episode. The following information summarizes representative data from several sources in an attempt to characterize the incidence and outcome of sudden cardiac arrest and demonstrate the need for a comprehensive system of capturing more meaningful data.
- 330 000 coronary heart disease deaths occur out-of-hospital or in hospital emergency departments annually (2002) (ICD-10 codes I20-I25) (personal communication, Thomas Thom, NHLBI/NIH).
- In 1998, 456 076 deaths from cardiac disease (ICD-9 code 390 to 398, 402, or 404 to 429) were reported in the United States (among people aged 35 years and above) in an emergency room, before reaching a hospital, or as "dead on arrival."7
- The annual incidence of sudden cardiac arrest in North America is about 0.55 per 1000 population.8,9 With an estimated US population of 296 766 821,10 this implies that about 163 221 out-of-hospital sudden cardiac arrests occur annually in the United States.
- About two thirds of unexpected cardiac deaths occur without prior recognition of cardiac disease.11
- About 60% of unexpected cardiac deaths are treated by EMS.12
- Incidence of EMS-treated out-of-hospital cardiac arrest is 36/100 000–81/100 000.12,13 This implies EMS treats 107 000 to 240 000 cardiac arrests in the United States annually.
- Of these, 20%–38% have ventricular fibrillation or ventricular tachycardia as the first recorded rhythm. This implies 21 000–91 000 ventricular fibrillation arrests annually.8,13
- The incidence of ventricular fibrillation among cardiac arrest victims with any first initial rhythm is decreasing over time.13
- The median reported survival to discharge after any first recorded rhythm is 6.4%.14 Survival during a recent one year experience in Seattle of all treated cardiac arrests, considered to be of cardiac origin, was reported to be 20%. (personal communication, L. Cobb, Seattle Medic One, December 7, 2005).
- The average proportion of cases of out-of-hospital cardiac arrest that receive bystander CPR is 27.4%.14
- The incidence of lay responder defibrillation is low, 2.05% in 2002, but increasing over time.15
- Unexpected death in the pediatric patient is usually due to trauma, sudden infant death syndrome, respiratory causes or submersion.16 Ventricular fibrillation is an uncommon cause of cardiac arrest in children but it is observed in approximately 5% to 15% of children with out-of-hospital cardiac arrest.17
- The reported incidences of out-of-hospital pediatric cardiac arrest vary widely in number (from 2.6–19.7 annual cases per 100 000) and inclusion criteria (age, cause of arrest, etc).18
- Since there are 73 559 232 individuals aged <18 years in the United States,10 this implies that there are 1 900–14 000 pediatric out-of-hospital cardiac arrests, annually, from all causes (including trauma, sudden infant death syndrome, respiratory causes, cardiovascular causes and submersion).
- The incidence of sudden cardiac arrest in children in the out-of-hospital setting is unknown. Studies that document voluntary reports of deaths among high school athletes suggest that the incidence of sudden cardiac arrest ranges from 0.28–1.0 deaths per 100 000 high school athletes annually nationwide.19,20 Although incomplete, these numbers provide a basis for estimating the number of deaths in this age range.
- The reported average survival to discharge after pediatric out-of-hospital cardiac arrest is 6.7%.18
Risk Factors
- Black and Mexican-American women have higher prevalence of CVD risk factors than white women of comparable socioeconomic status (SES).21
- Data from the 2003 BRFSS study of adults age 18 and older showed the prevalence of respondents reporting 2 or more risk factors for heart disease and stroke increased among successive age groups. The prevalence of having 2 or more risk factors was highest among blacks (48.7%) and American Indians/Alaska Natives (46.7%) and lowest among Asians (25.9%); prevalence was similar in women (36.4%) and men (37.8%). The prevalence of multiple risk factors ranged from 25.9% among college graduates to 52.5% among those with less than a high school diploma (or equivalent). Persons reporting household income of $50 000 or more had the lowest prevalence (28.8%) and those reporting $10 000 or less had the highest prevalence (52.5%). Adults who reported being unable to work had the highest prevalence (69.3%) of 2 or more risk factors, followed by retired persons (45.1%), unemployed adults (43.4%), homemakers (34.3%) and employed persons (34.0%). Prevalence of 2 or more risk factors varied by state/territory and ranged from 27.0% (Hawaii) to 46.2% (Kentucky). Twelve states and 2 territories had a multiple-risk-factor prevalence of 40% or more: Alabama, Arkansas, Georgia, Indiana, Kentucky, Louisiana, Mississippi, North Carolina, Ohio, Oklahoma, Tennessee, West Virginia, Guam and Puerto Rico.22
- Data from the BRFSS study of the CDC showed that young women and men, ages 18–24, had poor health profiles and experienced adverse changes from 1990–2000. After adjustment for education and income, these young people had the highest prevalence of smoking (34–36% current smokers among whites); the largest increases in smoking (10–12% among whites and 9% among Hispanic women); large increases in obesity (4–9% increase in all groups). All groups had high levels of sedentary behavior (approximately 20–30%) and low vegetable or fruit intake (approximately 35–50%). In contrast, older Hispanics and older black men, ages 65–74, showed some of the most positive changes. They had the largest decreases in smoking (Hispanic women), largest decreases in sedentary behavior (Hispanic women and black men), and largest increases in vegetable or fruit intake (Hispanic women and black men).23
- Data from the Chicago Heart Association Detection Project (1967–73, with an average follow-up of 31 years) showed that in younger women (ages 18–39) with favorable levels for all 5 major risk factors (blood pressure, serum cholesterol, BMI, diabetes and smoking), future incidence of CHD and CVD is rare, and long-term and all-cause mortality are much lower compared with those who have unfavorable or elevated risk factor levels at young ages. Similar findings applied to men in this study.24,25
- Data from the BRFSS study of the CDC showed that in adults age 18 and over, disparities in CVD health were common in all risk factors examined. In men, the highest prevalence of obesity (29.7%) was found in Mexican Americans who had completed a high school education. Black women with or without a high school education had a high prevalence of obesity (48.4%). Hypertension prevalence was high among blacks (41.2%), regardless of sex or educational status. Hypercholesterolemia was high among white and Mexican-American men and white women in both groups of educational status. CHD and stroke were inversely related to education, income and poverty status. Hospitalization was greater in men for total heart disease and acute MI but greater in women for CHF and stroke. Among Medicare enrollees, CHF hospitalization was higher in blacks, Hispanics, and American Indians/Alaska Natives than among whites, and stroke hospitalization was highest in blacks. Hospitalizations for CHF and stroke were highest in the southeastern United States. Life expectancy remains higher in women than in men and higher in whites than blacks by about 5 years. CVD mortality at all ages tended to be highest in blacks.26
- In respondents ages 18–74, data from the 2000 BRFSS study showed the prevalence of Healthy Lifestyle Characteristics (HLC) was as follows: nonsmoking, 76.0%; healthy weight, 40.1%; 5 fruits and vegetables per day, 23.3%; and regular physical activity, 22.2%. The overall prevalence of the healthy lifestyle indicator (ie, having all 4 HLCs) was only 3%, with little variation among subgroups.27
- Analysis of 5 cross-sectional, nationally representative surveys, from NHES 1960–62 to NHANES 1999–2000, showed that the prevalence of key risk factors, ie, high cholesterol, high blood pressure, current smoking, and total diabetes, decreased over time across all BMI groups, with the greatest reductions observed among overweight and obese groups. Total diabetes prevalence was stable within BMI groups over time. However, the trend has leveled off or been reversed for some of the risk factors in more recent years.28
- The aging of the population will undoubtedly result in an increased incidence of chronic diseases, including coronary artery disease, heart failure and stroke.29
- –The US Census estimates that there will be 40 million Americans age 65 and older in 2010.
- –There’s been an explosive increase in the prevalence of obesity and type 2 diabetes. Their related complications—hypertension, hyperlipidemia and atherosclerotic vascular disease—also have increased.
- –An alarming increase in unattended risk factors in the younger generations will continue to fuel the cardiovascular epidemic for years to come.
- –There’s been an explosive increase in the prevalence of obesity and type 2 diabetes. Their related complications—hypertension, hyperlipidemia and atherosclerotic vascular disease—also have increased.
- –The US Census estimates that there will be 40 million Americans age 65 and older in 2010.
Hospital/Physician/Nursing Home Visits
- From 1979–2003, the number of discharges from short-stay hospitals with CVD as the first listed diagnosis increased 31%. In 2003, CVD ranked highest among all disease categories in hospital discharges.30
- In 2003, there were 70 681 000 physician office visits with a primary diagnosis of CVD.31
- In 2003, there were 4 497 000 visits to emergency departments with a primary diagnosis of CVD.32
- In 1999, 23% of nursing home residents age 65 or older had a primary diagnosis of CVD at admission. This was the highest disease category for these residents.33
- In 2002, there were 6 024 000 outpatient department visits with a primary diagnosis of CVD.34
Cost
- The estimated direct and indirect cost of CVD for 2006 is $403.1 billion.
- In 2001, $29.3 billion in program payments were made to Medicare beneficiaries discharged from short-stay hospitals with a principal diagnosis of cardiovascular disease. That was an average of $8 354 per discharge.35
- A study of the 1987 National Medicaid Expenditure Survey and the 2000 Medical Expenditure Panel Survey, Household Component, showed the 15 most costly medical conditions, and the estimated percent increase in total healthcare spending for each condition from 1987–2000. The following are some of the top 15 conditions, by order of rank, and their percentage impact on health care spending: heart disease (1) +8.06%; cancer (4) +5.36%; hypertension (5) +4.24%; cerebrovascular disease (7) +3.52%; diabetes (9) +2.37%; and kidney disease (15) +1.03%.36
Operations and Procedures
- In 2003, an estimated 6 821 000 inpatient cardiovascular operations and procedures were performed in the United States; 3.9 million were performed on males and 2.9 million were performed on females.

|
| 3. Coronary Heart Disease, Acute Coronary Syndrome and Angina Pectoris |
|---|
Coronary Heart Disease
(ICD/9 410–414, 429.2) (ICD/10 I20–I25; see Glossary for details and definitions). See Table 3A.
|
Prevalence
- Among Americans ages 40–74, NHANES data found the age-adjusted prevalence of self-reported MI and ECG-MI (verified by electrocardiogram) to be higher among men than women, but angina prevalence to be higher in women than men. Age-adjusted rates of self-reported MI increased among African-American men and women and Mexican-American men, but decreased among white men and women.38
Incidence
- This year an estimated 700 000 Americans will have a new coronary attack and about 500 000 will have a recurrent attack.39 It is estimated that an additional 175 000 silent first heart attacks occur each year.
- The estimated incidence of MI (ICD/9 410) (ICD/10 I21, I22) is 565 000 new attacks and 300 000 recurrent attacks annually.39
- The average age of a person having a first heart attack is 65.8 for men and 70.4 for women (ARIC and CHS, NHLBI).
- Based on the NHLBI’s FHS in its 44-year follow-up of participants and the 20-year follow-up of their offspring2:
- –CHD comprises more than half of all cardiovascular events in men and women under age 75.
- –The lifetime risk of developing CHD after age 40 is 49% for men and 32% for women.40
- –The incidence of CHD in women lags behind men by 10 years for total CHD and by 20 years for more serious clinical events such as MI and sudden death.
- –The lifetime risk of developing CHD after age 40 is 49% for men and 32% for women.40
- –CHD comprises more than half of all cardiovascular events in men and women under age 75.
- In the NHLBI’s ARIC study, average age-adjusted CHD incidence rates per 1000 person-years were: white men, 12.5; black men, 10.6; white women, 4.0; and black women, 5.1. Incidence rates excluding revascularization procedures were: white men, 7.9; black men, 9.2; white women, 2.9; and black women, 4.9. Hypertension was a particularly powerful risk factor for CHD in black persons, especially in black women. Diabetes was a weaker predictor of CHD in black than in white persons.41
- The annual rates per 1000 population of first heart attack (MI or CHD death) in non-black men are 19.2 for ages 65–74, 28.3 for ages 75–84, and 50.6 for age 85 and older. For non-black women in the same age groups the rates are 6.8, 14.2 and 33.2, respectively. For black men the rates are 21.6, 27.9 and 57.1, and for black women the rates are 8.6, 17.6 and 24.8, respectively (CHS [1989–2000], NHLBI).
- Combining the rates for possible and definite CHD shows that 17 to 25 of every 100 American Indian men ages 45–74 had some evidence of heart disease.3
- Among American Indians ages 65–74, the annual rates per 1000 population of new and recurrent heart attacks are 7.6 for men and 4.9 for women (SHS [1989-2002], NHLBI).
- CHD rates in women after menopause are 2–3 times those of women the same age before menopause.42
Mortality
CHD caused 1 of every 5 deaths in the United States in 2003. CHD mortality as an underlying or contributing cause of death—653 000. MI mortality as an underlying or contributing cause of death—221 000.
- CHD is the single largest killer of American males and females. About every 26 seconds an American will suffer a coronary event, and about every minute someone will die from one. About 40% of the people who experience a coronary attack in a given year will die from it.
- A study of 1275 HMO enrollees ages 50–79 who had cardiac arrest (CA), showed the incidence of out-of-hospital CA was 6.0/1000 subject-years in subjects with any clinically recognized heart disease compared to 0.8/1000 subject-years in subjects without heart disease. In subgroups with heart disease, incidence was 13.6/1000 subject-years in subjects with prior MI and 21.9/1000 subject-years in subjects with heart failure.43
- An analysis of data from the FHS from 1950–99 showed that overall CHD death rates decreased by 59%. Nonsudden CHD death decreased by 64%, and sudden cardiac death fell by 49%. These trends were seen in men and women, in subjects with and without a prior history of CHD, and in smokers and nonsmokers.44
- From 1993–2003, the death rate from CHD declined 30.2%, but the actual number of deaths declined only 14.7%. In 2003, the overall CHD death rate was 162.6 per 100 000 population. The death rates were 209.2 for white males and 241.1 for black males; for white females the rate was 125.1 and for black females it was 160.3. The 2002 death rates for CHD were 138.3 for Hispanics or Latinos, 114.0 for American Indians or Alaska Natives, and 98.6 for Asians or Pacific Islanders (Health, United States, 2004).
- Over 83% of people who die of CHD are age 65 or older (CDC/NCHS).
- The estimated average number of years of life lost due to a heart attack is 14.2 (NHLBI).
- Based on data from the FHS study of the NHLBI2:
- –25% of men and 38% of women will die within 1 year after having an initial recognized MI. In part because women have heart attacks at older ages than men do, they’re more likely to die from them within a few weeks. Almost half of men and women under age 65 who have a heart attack (MI) die within 8 years.
- –50% of men and 64% of women who died suddenly of CHD had no previous symptoms of this disease.
- –Between 70% and 89% of sudden cardiac deaths occur in men, and the annual incidence is 3–4 times higher in men than in women. However, this disparity decreases with advancing age.
- –People who’ve had a heart attack have a sudden death rate that’s 4–6 times that of the general population.
- –Sudden cardiac death accounts for 19% of sudden deaths in children between 1 and 13 years of age and 30% between 14 and 21 years of age. The overall incidence is low, 600 cases per year.
- –50% of men and 64% of women who died suddenly of CHD had no previous symptoms of this disease.
- –25% of men and 38% of women will die within 1 year after having an initial recognized MI. In part because women have heart attacks at older ages than men do, they’re more likely to die from them within a few weeks. Almost half of men and women under age 65 who have a heart attack (MI) die within 8 years.
- According to data from the National Registry of Myocardial Infarction45:
- –From 1990–1999, in-hospital AMI mortality declined from 11.2% to 9.4%.46
- –Mortality increases for every 30 minutes that elapse before a patient with ST-segment elevation is recognized and treated.47
- –The median door-to-drug time for thrombolytic therapy was reduced by nearly half, from 61.8 minutes to 37.8 minutes, during the NRMI data collection used in this study. However, many hospitals are still working to meet the goal of 30 minutes set in 1991 (www.nrmi.org).
- –Women under 50 are twice as likely to die after an AMI than men in the same age group.48
- –Mortality increases for every 30 minutes that elapse before a patient with ST-segment elevation is recognized and treated.47
- –From 1990–1999, in-hospital AMI mortality declined from 11.2% to 9.4%.46
Risk Factors
- A study of men and women in 3 prospective cohort studies found that antecedent major CHD risk factor exposures were very common among those who developed CHD. About 90% of the CHD patients have prior exposure to at least 1 of these major risk factors, which include high total blood cholesterol levels or current medication with cholesterol-lowering drugs, hypertension or current medication with blood pressure-lowering drugs, current cigarette use, and clinical report of diabetes.49
- According to a case-control study of 52 countries (INTERHEART), 9 easily measured and potentially modifiable risk factors account for over 90% of the risk of an initial acute MI. The effect of these risk factors is consistent in men and women, across different geographic regions, and by ethnic group, making the study applicable worldwide. These 9 risk factors include cigarette smoking, abnormal blood lipid levels, hypertension, diabetes, abdominal obesity, a lack of physical activity, low daily fruit and vegetable consumption, alcohol overconsumption, and psychosocial index.50
- A study of over 3000 members of the FHS offspring cohort without CHD showed that among men with 10-year predicted risk for CHD of 20%, both failure to reach target heart rate and ST-segment depression more than doubled the risk of an event, and each MET (metabolic equivalent) increment in exercise capacity reduced risk by 13%.51
- Low CHD risk is defined as blood pressure <120/80 mm Hg, cholesterol <200 mg/dL and not currently smoking. Age-adjusted prevalence was estimated in nondiabetic persons without a history of MI participating in 4 NHANES surveys conducted in 1971–75, 1976–80, 1988–94, and 1999–2000.52
- –The prevalence of low risk rose from 6% in 1971–75 to 17% in 1988–94 and 1999–2000.
- –Prevalence of low risk was about twice as high in women as in men throughout the period.
- –Prevalence was initially higher in whites than in blacks (7% versus 3% in 1971–75); it increased more with time in blacks (17% versus 15% in 1999–2000).
- –Prevalence of low risk in 1999–2000 was lowest in those ages 65–74 (3%) and was progressively greater at younger ages (29% at ages 25–34), with similar increases in prevalence over time across age groups.
- –The greatest changes in the components of low risk from 1971–2000 were in prevalence of favorable diastolic blood pressure (from 38% to 71%), compared to favorable systolic blood pressure (from 32% to 47%), nonsmoking (from 60% to 79%), and favorable cholesterol (from 33% to 46%).
- –Prevalence of low risk was about twice as high in women as in men throughout the period.
- –The prevalence of low risk rose from 6% in 1971–75 to 17% in 1988–94 and 1999–2000.
- Taking into account CHD risk factors in combination provides a very potent predictor of 10-year risk of CHD compared with individual risk factors. Among participants ages 20–79 in the NHANES III study of the CDC/NCHS, without self-reported CHD, stroke, peripheral vascular disease and diabetes, 81.7% had a 10-year risk for CHD of <10%, 15.5% had a risk of 10–20%, and 2.9% had a risk of >20%. Among participants age 60 and over, 40.3% of men and 8.2% of women were at "intermediate risk (10% to 20%)." The proportion of participants with a 10-year risk of CHD of >20% increased with advancing age and was higher among men than women but varied little with race or ethnicity.53
- A study of NH white persons, ages 35–74, in the Framingham Heart Study and the NHANES III studies, showed that 26% of men and 41% of women had at least 1 borderline risk factor in NHANES III. It is estimated that more than 90% of CHD events will occur in individuals with at least 1 elevated risk factor, and approximately 8% will occur in people with only borderline levels of multiple risk factors. Absolute 10-year CHD risk exceeded 10% in men older than age 45 who had 1 elevated risk factor and 4 more borderline risk factors and in those who had at least 2 elevated risk factors. In women, absolute CHD risk exceeded 10% only in those over age 55 who had at least 3 elevated risk factors.54
Aftermath
- Depending on their gender and clinical outcome, people who survive the acute stage of a heart attack have a chance of illness and death that’s 1.5–15 times higher than that of the general population. The risk of another heart attack, sudden death, AP, HF and stroke—for both men and women—is substantial (FHS, NHLBI).2
- A study conducted by the Mayo Clinic found that cardiac rehabilitation after a heart attack is underused, particularly in women and the elderly. Women were 55% less likely than men to participate in cardiac rehabilitation, and older study patients were less likely than younger participants. Only 32% of men and women age 70 or older participated in cardiac rehabilitation, in comparison to 66% of 60– 69-year-olds and 81% of those under age 60.55
- Within 6 years after a recognized heart attack (MI) (FHS, NHLBI)2...
- –18% of men and 35% of women will have another heart attack.
- –7% of men and 6% of women will experience sudden death.
- –About 22% of men and 46% of women will be disabled with heart failure.
- –8% of men and 11% of women will have a stroke.
- –7% of men and 6% of women will experience sudden death.
- –18% of men and 35% of women will have another heart attack.
Hospital Discharges
- From 1979–2003, the number of discharges from short-stay hospitals with CHD as the first listed diagnosis increased 16% (National Hospital Discharge Survey, CDC/NCHS).
- From 1990–99, the median duration of hospital stay related to acute myocardial infarction dropped from 8.3 days to 4.3 days, according to an analysis of the NRMI. Findings were similar for both patients receiving primary PTCA and those receiving thrombolytic therapy.46
- Data from Ambulatory Care Visits to Physician Offices, Hospital Outpatient Departments, and Emergency Departments: US, 1999–2000, showed the number of visits for CHD were 12.2 million.56
Awareness of Warning Signs and Risk Factors for Heart Disease
- Surveys conducted by the AHA between 1997 and 2003 showed the awareness of heart disease as the leading cause of death in women rose from 30% in 1997 to 46% in 2003. Awareness in white women (55%) was nearly twice as high as among African-American (30%) and Hispanic (27%) women.57
- In 2003, 46% of respondents to a nationally representative telephone survey of women age 25 and older, identified heart disease as the leading killer of women, up from 30% in 1997 and 34% in 2000.57
- In 1997, a telephone survey of 1000 US households found that only 8% of women respondents identified heart disease as their greatest health concern; less than 33% identified heart disease as the leading cause of death.58
- Data from the Women Veteran Cohort, age 35 and over, showed 42% of women were concerned about heart disease. Only 8–20% were aware that coronary artery disease (CAD) is the major cause of death for women.59
- Data from the 2001 BRFSS study of the CDC showed that 95% of respondents recognized chest pain as a heart attack symptom. However, only 11% correctly classified all symptoms and knew to call 911 when someone was having a heart attack. This random digit-dialed telephone survey was conducted in 17 states and the US Virgin Islands.60
- A study of public knowledge of CVD risk factors and risk-reduction techniques in 2 New England communities showed that prevention knowledge improved significantly over time in both locations and in every demographic subgroup. Scores were higher for native-born citizens, women, more educated individuals and English-speaking people. There was an increase in the identification of physical inactivity, and blood cholesterol/high-fat diet as CVD risk factors, while there was a decrease in the identification of overweight and blood pressure.61
- Three population-based cross-sectional surveys in 2 northern California cities were conducted between 1980 and 1990. Significant differentials in baseline knowledge widened over the 10-year period. Individuals with less than 12 years of education had only slight improvement in their knowledge of CVD risk factors; those with more than 16 years of education had twice as much improvement. There were similar time-effect disparities in knowledge of risk-reduction strategies. In contrast, interest in risk modification was high for all educational groups and remained uniform across time.62
- A national study of physician awareness and adherence to CVD prevention guidelines, conducted in late 2004, showed that fewer than 1 in 5 physicians knew that more women than men die each year from CVD.63
- A recent community surveillance study in 4 US communities reported that in 2000, the overall proportion of persons with delays from onset of symptoms of acute MI to hospital arrival of 4 or more hours was 49.5%. The study also reported that there was no statistically significant change in the proportion of patients delaying 4 or more hours from 1987–2000, indicating that there has been little improvement in the speed at which patients with MI symptoms arrive at the hospital after onset. Although the proportion of MI patients who arrived at the hospital by emergency medical services increased over this period from 37% in 1987 to 55% in 2000, the total time between onset and hospital arrival did not change appreciably.64
Cost
- In 2006, the estimated direct and indirect cost of CHD is $142.5 billion.
- In 2001, $11.6 billion was paid to Medicare beneficiaries for CHD ($11 201 per discharge for acute MI; $11 308 per discharge for coronary atherosclerosis; and $3513 per discharge for other ischemic heart disease).35
Operations and Procedures
- In 2003, an estimated 1 244 000 inpatient angioplasty procedures, 467 000 inpatient bypass procedures, 1 414 000 inpatient diagnostic cardiac catheterizations, 64 000 inpatient implantable defibrillators and 197 000 inpatient pacemaker procedures were performed in the United States.
Acute Coronary Syndrome (ACS)
(ICD/9 codes 410, 411)
The term "acute coronary syndrome" (ACS) is increasingly used to describe patients who present with either acute MI or UA. (UA is chest pain or discomfort that’s unexpected and usually occurs while at rest. The discomfort may be more severe and prolonged than typical angina or be the first time a person has angina.)
- A conservative estimate for the number of discharges with ACS from hospitals in 2003 is 879 000. Of these, an estimated 497 000 are male and 382 000 are female. This estimate is derived by adding the first listed hospital discharges for myocardial infarction (767 000) to those for unstable angina (112 000) (CDC/NCHS).
- When including secondary discharge diagnoses, the corresponding number of hospital discharges was 1 555 000 unique hospitalizations for ACS, 946 000 for MI, and 650 000 for UA (31 000 hospitalizations received both diagnoses) (CDC/NCHS).
Decisions regarding medical and interventional treatments are based on specific findings noted when a patient presents with ACS. Such patients are classified clinically into 1 of 3 categories according to the presence or absence of ST segment elevation on the presenting electrocardiogram and abnormal ("positive") elevations of myocardial biomarkers such as troponins, as follows:
- ST elevation myocardial infarction (STEMI)
- non-ST elevation myocardial infarction
- unstable angina
Studies evaluating the percentage of ACS patients who have STEMI range from 30–45%.65 These are only preliminary estimates, in part because of dramatically changing practices in the unstable angina discharge diagnosis in the past decade. Factors affecting the UA diagnosis include changes in reimbursement policies, the advent of more sensitive assays for myocardial injury (leading to increased diagnosis of MI over UA), and greater care of patients in same-day "chest pain units" and same-day catheterization procedures.
- A study of over 1300 elderly patients admitted to all intensive cardiovascular care units (CCUs) and cardiology departments in Israel, showed the mean age of women versus men was comparable. Comorbidities were more frequent in women, whereas previous coronary disease and typical anginal pain on admission were more frequent in men. Medical treatment and revascularization procedures during the index hospitalization were comparable. Crude and covariate-adjusted mortality rates were higher in women at 7 days, but not at 6 months. This difference was attributed to ST elevation (STE)-ACS in women versus men. Seven-day mortality rates were higher in patients with STE-ACS who were denied coronary angiography, especially women.66
Angina Pectoris
(ICD/9 413) (ICD/10 I20). See Table 3B.
|
Prevalence
- A study of 4 national cross-sectional health examination studies found that, among Americans ages 40–74, the age-adjusted prevalence of AP was higher among women than men. Increases in the prevalence of AP occurred for Mexican-American men and women, and African-American women, but were not statistically significant for the latter.38
Incidence
- Only 20% of coronary attacks are preceded by long-standing angina.2
- The annual rates per 1000 population of new and recurrent episodes of angina for non-black men are 44.3 for ages 65–74, 56.4 for ages 75–84, and 42.6 for age 85 and older. For non-black women in the same age groups the rates are 18.8, 30.8 and 19.8, respectively. For black men the rates are 26.1, 52.2 and 43.5, and for black women the rates are 29.4, 37.7 and 15.2, respectively (CHS, NHLBI).
Mortality
A small number of deaths due to CHD are coded as being from AP. These are included as a portion of total deaths from CHD.
| 4. Stroke |
|---|
(ICD/9 430–438) (ICD/10 I60–I69). See Table 4A.68
|
Prevalence
- From the early 1970s to the early 1990s, the estimated number of noninstitutionalized stroke survivors increased from 1.5 million to 2.4 million.69
- The prevalence of stroke in American Indian men ages 45–74 ranges from 0.2–1.4% and in women from 0.2–0.7%.3
- 1999–2003 data from the NHIS study of the CDC/NCHS showed that 3.6% of American Indians/Alaska Natives, age 18 and over, have had a stroke. Among blacks or African Americans it was 3.3%, among whites it was 2.2%, and among Asians it was 2.0%.70
- 2003 data from the BRFSS survey of the CDC showed a higher prevalence of stroke in 10 southeastern states than in 13 non-southeastern states and the District of Columbia. Prevalence was higher in blacks than in whites. The highest age-adjusted prevalence of stroke was among southeastern blacks, followed by non-southeastern blacks, southeastern whites and non-southeastern whites.71
- The prevalence of silent cerebral infarction between ages 55–64 is about 11%. This prevalence increases to 22% between ages 65 and 69, 28% between ages 70 and 74, 32% between ages 75 and 79, 40% between ages 80 and 85, and 43% above age 85. Applying these rates to 1998 US population estimates results in an estimated 13 million people with prevalent silent stroke.71a,71b
Transient Ischemic Attack (TIA)
- The prevalence of transient ischemic attacks (TIA) in men is 2.7% for ages 65–69 and 3.6% for ages 75–79. (A TIA, or transient ischemic attack, is a mini-stroke that lasts less than 24 hours.) For women, TIA prevalence is 1.6% for ages 65–69 and 4.1% for ages 75–79.72
- Approximately 15% of all strokes are heralded by a TIA.73
- A third of spells characterized as TIAs using the classic definition (focal neurological deficits resolving within 24 hours) would be considered infarctions based on diffusion- weighted MRI findings.74
- In population-based studies, the age and gender adjusted incidence rates for TIA range from 68.2–83/100 000. Males and blacks have higher rates of TIA.75,76 Approximately half of patients who experience a TIA fail to report it to their healthcare providers.77,78
- After TIA, the 90-day risk of stroke is 3–17.3%, highest within the first 30 days.75–77,79,80
- Within a year of TIA, up to a quarter of patients will die.76,81
- Individuals who have a TIA have a 10-year stroke risk of 18.8%, and a combined 10-year stroke, MI or vascular death risk of 42.8% (4% a year).82
- In the North American Symptomatic Carotid Endarterectomy Trial (NASCET) study, patients with a first-ever hemispheric TIA had a 90-day stroke risk of 20.1%. The risk of stroke after TIA exceeded the risk after hemispheric stroke.83
Incidence
- Each year about 700 000 people experience a new or recurrent stroke. About 500 000 of these are first attacks, and 200 000 are recurrent attacks (GCNKSS, FHS, ARIC).
- On average, every 45 seconds someone in the United States has a stroke.
- Each year, about 46 000 more women than men have a stroke (GCNKSS).
- Men’s stroke incidence rates are 1.25 times greater than women’s. The difference in incidence rates between the sexes is somewhat higher at younger ages but nonexistent at older ages. The male/female incidence was 1.59 for ages 65–69; 1.46 for ages 70–74; 1.35 for ages 75–79 and 0.74 for age 80 and older (CHS, NHLBI).
- Of all strokes, 88% are ischemic, 9% are intracerebral hemorrhage, and 3% are subarachnoid hemorrhage (GCNKSS, FHS, ARIC).
- Blacks have almost twice the risk of first-ever stroke compared with whites. The age-adjusted stroke incidence rates (per 100 000) for first-ever strokes are 167 for white males, 138 for white females, 323 for black males and 260 for black females (GCNKSS, FHS, ARIC).
- The Brain Attack Surveillance in Corpus Christi project (BASIC) clearly demonstrated an increased incidence of stroke among Mexican Americans compared with NH whites in this community. The crude cumulative incidence was 168/10 000 in Mexican Americans and 136/10 000 in NH whites. Specifically, Mexican Americans have an increased incidence of intracerebral hemorrhage and subarachnoid hemorrhage compared with NH whites adjusted for age, as well as an increased incidence of ischemic stroke and TIA at younger ages when compared with NH whites.86
- The age-adjusted annual incidence rate (per 1000) for total stroke in Japanese-American men has declined markedly from 5.1 to 2.4; for thromboembolic stroke, from 3.5 to 1.9; and for hemorrhagic stroke, from 1.1 to 0.6. The estimated average annual declines are 5% for total stroke, 3.5% for thromboembolic stroke, and 4.3% for hemorrhagic stroke. The decline in stroke mortality in the Honolulu Heart Program (HHP) target population was similar to that reported for US white males ages 60–69 during the same period (during the 1969–88 follow-up period of the HHP, NHLBI).
- Among American Indians ages 65–74, the annual rates per 1000 population of new and recurrent strokes are 6.1 for men and 6.6 for women (SHS [1989–2002], NHLBI).
- Data from the Northern Manhattan Study showed the age-adjusted incidence of first ischemic stroke per 100 000 was 88 in whites, 149 in Hispanics and 191 in blacks. Among blacks compared with whites, the relative rate of intracranial atherosclerotic stroke was 5.85; extracranial atherosclerotic stroke, 3.18; lacunar stroke, 3.09; and cardioembolic stroke, 1.58. Among Hispanics compared with whites, the relative rate of intracranial atherosclerotic stroke was 5.00; extracranial atherosclerotic stroke, 1.71; lacunar stroke, 2.32; and cardioembolic stroke, 1.42.87
Mortality
Stroke accounted for about 1 of every 15 deaths in the United States in 2003. About 50% of these deaths occurred out of hospital. Stroke as an underlying or contributing cause of death—about 273 000.
- When considered separately from other cardiovascular diseases, stroke ranks No. 3 among all causes of death, behind diseases of the heart and cancer (CDC/NCHS).
- On average, about every 3 minutes someone dies of a stroke.
- Eight to 12% of ischemic strokes and 37–38% of hemorrhagic strokes result in death within 30 days.88
- From 1993–2003, the stroke death rate fell 18.5%, and the actual number of stroke deaths declined 0.7% (CDC/NCHS).
- The 2003 overall death rate for stroke was 54.3. Death rates were 51.9 for white males and 78.8 for black males; for white females it was 50.5 and for black females it was 69.1.
- 2002 age-adjusted death rates for stroke were 44.3 for Hispanic or Latino males and 38.6 for females; 50.8 for Asian or Pacific Islander males and 45.4 for females; and 37.1 for American Indians or Alaska Native males and 38.0 for females (Health, United States, 2004, CDC/NCHS).
- Because women live longer than men, more women than men die of stroke each year. Women accounted for 61.0% of US stroke deaths in 2003.
- From 1995–98, age-standardized mortality rates for ischemic stroke, subarachnoid hemorrhage and intracerebral hemorrhage were higher among blacks than whites. Death rates from intracerebral hemorrhage were also higher among Asian or Pacific Islanders than among whites. All minority populations had higher death rates from subarachnoid hemorrhage than did whites. Among adults ages 25–44, blacks and American Indians or Alaska Natives had higher risk ratios than did whites for all 3 stroke subtypes.90
- In 2002, the mean age of stroke death was 79.6 years; however, males had a younger mean age at stroke death than females. Blacks, American Indians/Alaska Natives, and Asians/ Pacific Islanders had younger mean ages than whites, and the mean age at stroke death was also younger among Hispanics than non-Hispanics.85
Risk Factors
- TIAs carry a substantial short-term risk of stroke, hospitalization for cardiovascular events and death. Of 1707 TIA patients evaluated in the emergency department (ED) of a large health care plan, 180 patients, or 10%, developed stroke within 90 days. Ninety-one patients, or 5%, did so within 2 days. Predictors of stroke: more than 60 years of age, having diabetes mellitus, focal symptoms of weakness or speech impairment, and TIA lasting longer than 10 minutes.91
- The relative risk (RR) of stroke in heavy smokers (more than 40 cigarettes a day) is twice that of light smokers (less than 10 cigarettes per day). Stroke risk decreases significantly after 2 years and is at the level of nonsmokers by 5 years after cessation of cigarette smoking.92
- Atrial fibrillation (AF) is an independent risk factor for stroke, increasing risk about 5-fold. For details, see Section VII a: Arrhythmias.93
- In adults over 55, the lifetime risk for stroke is greater than 1 in 6. Women have a higher risk than men, perhaps due to their survival advantage. Blood pressure (BP) is a powerful determinant of stroke risk. Subjects with BP less than 120/80 mm Hg have about half the lifetime risk of stroke, compared to subjects with hypertension.94
- Data from the GCNKSS study shows that ischemic stroke patients with diabetes are younger, more likely to be African American, and more likely to have hypertension, MI, and high cholesterol than nondiabetic patients. Age-specific incidence rates and rate ratios show that diabetes increases ischemic stroke incidence at all ages, but this risk is most prominent before age 55 in African Americans and before age 65 in whites. One-year case fatality rates after ischemic stroke are not different between those patients with and without diabetes.95
Physical Activity
- Physical activity reduces stroke risk. Results from the Physicians’ Health Study showed a lower stroke risk associated with vigorous exercise among men (RR of total stroke = 0.86 for exercise 5 times a week or more).96 The Harvard Alumni Study showed a decrease in total stroke risk in men who were highly physically active (RR = 0.82).97
- For women in the Nurses’ Health Study, RR for total stroke from the lowest to the highest physical activity levels were: 1.00, 0.98, 0.82, 0.74 and 0.66, respectively.98
- The Northern Manhattan Study—which included whites, blacks and Hispanics, and men and women in an urban setting—showed a decrease in ischemic stroke risk associated with physical activity (PA) levels across all racial/ethnic and age groups, and for each gender (odds ratio = 0.37).99
- A follow-up of the ARIC cohort found that PA —be it from sports, during leisure time, or at work—was related to reduced risk of ischemic stroke.100
Pregnancy and Stroke
- The Baltimore–Washington Cooperative Young Stroke Study found the risk of ischemic stroke or intracerebral hemorrhage during pregnancy and the first 6 weeks postpartum was 2.4 times greater than for nonpregnant women of similar age and race. The risk of ischemic stroke during pregnancy was not increased during pregnancy per se, but was increased 8.7-fold during the 6 weeks postpartum. Intracerebral hemorrhage showed a small RR of 2.5 during pregnancy, but increased dramatically to an RR of 28.3 in the 6 weeks postpartum. The excess risk of stroke (all types except subarachnoid hemorrhage) attributable to the combined pregnant/post-pregnant period was 8.1 per 100 000 pregnancies.101
- Using Swedish administrative data, it was found that ischemic stroke and intracerebral hemorrhage, including subarachnoid hemorrhage, are increased in association with pregnancy. Compared to the risk of stroke among women who were not pregnant or in early pregnancy (up to the first 27 gestational weeks), women in the peripartum (from 2 days before to 1 day after delivery), and the puerperium (from 2 days before to 6 complete weeks after delivery) periods were at increased risk for all 3 major stroke types. The 3 days surrounding delivery were the time of highest risk.102
- Data from the HHP found that in elderly Japanese men ages 71–93, low concentrations of high-density lipoprotein (HDL) cholesterol were more likely to be associated with a future risk of thromboembolic stroke than were high concentrations.103
- In the US Nationwide Inpatient Sample from 2000–01, the rate of events per 100 000 pregnancies was 9.2 for ischemic stroke, 8.5 for intracerebral hemorrhage, 0.6 for cerebral venous thrombosis and 15.9 for the ill-defined category of pregnancy-related cerebrovascular events, or a total rate of 34.2/100 000, not including subarachnoid hemorrhage. The risk was increased in African Americans and among older women. Among women with these events, death during hospitalization occurred in 4.1%, and in 22% of survivors after discharge to a facility other than home.104
Postmenopausal Women
- Stroke is a major health issue for women, particularly for postmenopausal women, raising the question whether increased incidence is due to aging or to hormone status, and whether hormone therapy affects risk.105,106
- Among postmenopausal women who are generally healthy, the Women’s Health Initiative primary prevention clinical trial among 16 608 women (95% of whom had no pre-existing CVD) found that estrogen plus progestin (PremPro) increased ischemic stroke risk by 44%, with no effect on hemorrhagic stroke. The excess risk was apparent in all age groups, in all categories of baseline stroke risk, and in women with and without hypertension, or prior history of CVD.107
- In the Women’s Health Initiative trial of estrogen alone, among 10 739 women with hysterectomy, it was found that conjugate equine estrogen alone (Premarin) increased risk of stroke by 39%. The excess risk conferred by estrogen alone was 12 additional strokes per 10 000 person-years.108
- In postmenopausal women with known CHD, the Heart and Estrogen/progestin Replacement Study (HERS), a secondary CHD prevention trial, found that a combination of estrogen plus progestin (conjugated equine estrogen [0.625 mg] and medroxyprogesterone acetate [2.5 mg] hormone therapy did not reduce stroke risk.109
- The Women’s Estrogen for Stroke Trial (WEST) found that estrogen alone (1 mg of 17B-estradiol) in women of mean age 71 years, also had no significant overall effect on recurrent stroke or fatality, but there was an increased rate of fatal stroke and an early rise in overall stroke rate in the first 6 months.110
- Clinical trials data indicate that estrogen plus progestin as well as estrogen alone increase stroke risk in postmenopausal, generally healthy women and provide no protection for women with established heart disease.107,108,111
Aftermath
- Stroke is a leading cause of serious, long-term disability in the United States.112
- The median time from stroke onset to arrival in an ER is between 3 and 6 hours, according to a study of at least 48 unique reports of prehospital delay time for patients with stroke, TIA or stroke-like symptoms. The study included data from 17 countries, including the United States. Improved clinical outcome at 3 months was seen for patients with acute ischemic stroke when intravenous thrombolytic treatment was started within 3 hours of the onset of symptoms.113
- In 1999, more than 1 100 000 American adults reported difficulty with functional limitations, activities of daily living, etc, resulting from stroke (MMWR, Vol 50, No 7, Feb 23, 2001, CDC).
- According to the NHLBI’s FHS2...
- –14% of persons who survive a first stroke or TIA will have another one within 1 year.
- –22% of men and 25% of women who have an initial stroke die within a year. This percentage is higher among people age 65 and older.
- –51% of men and 53% of women under age 65 who have a stroke die within 8 years.
- –The length of time to recover from a stroke depends on its severity. From 50–70% of stroke survivors regain functional independence, but 15–30% are permanently disabled, and 20% require institutional care at 3 months after onset.
- –22% of men and 25% of women who have an initial stroke die within a year. This percentage is higher among people age 65 and older.
- –14% of persons who survive a first stroke or TIA will have another one within 1 year.
- In the NHLBI’s FHS, among ischemic stroke survivors who were at least 65 years old, these disabilities were observed at 6 months post-stroke114:
- –50% had some hemiparesis.
- –30% were unable to walk without some assistance.
- –26% were dependent in activities of daily living.
- –19% had aphasia.
- –35% had depressive symptoms.
- –26% were institutionalized in a nursing home.
- –30% were unable to walk without some assistance.
- –50% had some hemiparesis.
- Data from the Paul Coverdell National Acute Stroke Registry showed the majority of stroke admissions were ischemic strokes (52–70%) with TIA and intracerebral hemorrhage comprising the bulk of the remainder. Between 19% and 26% of admissions were under 60 years of age, and between 52% and 58% were female. Blacks varied from 7–31% depending on state of residence. Between 20% and 25% of admissions arrived at the emergency department within 3 hours of onset. Treatment with recombinant tissue plasminogen activator (rtPA) was administered to between 3% and 8.5% of ischemic stroke admissions. Of those treated with rtPA, less than 20% received it within 60 minutes of arrival. Compliance with secondary prevention practices was poorest for smoking cessation counseling and best for antithrombotics.115
- Of patients with ischemic stroke in the California Acute Stroke Pilot Registry, 23.5% arrived at the ER within 3 hours of symptom onset, and 4.3% received thrombolysis. If all patients had called 911 immediately, the expected overall rate of thrombolytic treatment within 3 hours would have increased to 28.6%. If all patients with known onset had arrived within 1 hour and had been optimally treated, 57% could have been treated.116
- Patients with a discharge diagnosis of ischemic stroke were identified in 7 California hospitals participating in the California Acute Stroke Pilot Registry. Six points of care were tracked: thrombolysis, receipt of antithrombotic medications within 48 hours, prophylaxis for deep vein thrombosis, smoking cessation counseling, and prescription of lipid-lowering and antithrombotic medications at discharge. Overall, rates of optimal treatment improved for patients treated in year 2 compared to year 1, with 63% of patients receiving a perfect score in year 2 compared to 44% in year 1. Rates significantly improved in 4 of the 6 hospitals and for 4 of the 6 interventions. A seventh hospital that participated in the registry but did not implement standardized orders showed no improvement in optimal treatment.117
Hospital Discharges
- From 1979–2003, the number of discharges from short-stay hospitals with stroke as the first listed diagnosis increased 29% (National Hospital Discharge Survey, CDC/NCHS).
- During 1988–97, the age-adjusted stroke hospitalization rate increased 18.6% (from 560 to 664 per 100 000), while total hospitalizations increased 38.6% (from 592 811 to 821 760). Hospitalization rates did not change for ages 35–64 but increased for persons age 65 and older. This increase was greater for men than for women. The average length of hospital stay fell from 11.1 to 6.2 days. Total person-days in hospital decreased 22%.118 (Stroke in this study includes ICD/9 431–434 and 436–438. The American Heart Association uses 430–438.)
- Between 1980 and 1999, hospital discharge rates for stroke increased for blacks and whites; the in-hospital mortality rates decreased for both black and white patients. Generally, the risk of a stroke hospitalization was more than 70% greater for blacks than for whites. Both groups were similar in terms of in-hospital mortality rates.119 Note: Estimates by race, especially time trends, are affected by the increasing underreporting of race in the National Hospital Discharge Survey.120
- Data from Ambulatory Care Visits to Physician Offices, Hospital Outpatient Departments, and Emergency Departments: U.S., 1999–2000, showed the number of visits for stroke was 3.0 million.56
Awareness of Stroke Warning Signs and Risk Factors
- 2001 data from the BRFSS study of the CDC, in 17 states and the US Virgin Islands, showed that public awareness of the major stroke warning signs was high.
- –Sudden numbness or weakness of the face, arm or leg—94.1%
- –Sudden confusion, trouble speaking or understanding—87.9%
- –Sudden trouble walking, dizziness or loss of balance or coordination—85%
- –Sudden trouble seeing in 1 or both eyes—68.1%
- –Sudden severe headache with no known cause—61.3%
- –37.8% incorrectly reported sudden chest pain as a sign of stroke.121
- –Sudden confusion, trouble speaking or understanding—87.9%
- –Sudden numbness or weakness of the face, arm or leg—94.1%
- A study was conducted of patients admitted to an emergency department with possible stroke, to determine knowledge of the signs, symptoms and risk factors of stroke. Of the 163 patients able to respond, 39% did not know a single sign or symptom. Patients above age 65 were less likely than those under 65 to know a sign or symptom of stroke (47% versus 28%). Forty-three percent did not know a single risk factor for stroke. Overall, almost 40% of patients admitted with a possible stroke did not know the signs, symptoms and risk factors of stroke.122
- A study of over 2100 respondents to a random-digit telephone survey in Cincinnati, Ohio, in 2000, showed that 70% of respondents correctly named at least 1 established stroke warning sign versus 57% in 1995, and 72% correctly named at least 1 established risk factor versus 68% in 1995.123
- The Heart and Stroke Foundation of Ontario, Canada, conducted a public opinion polling in 4 communities to determine the level of awareness of the warning signs of stroke and to determine the impact of different media strategies. Television advertising significantly increased the ability to name the warning signs. There was no significant change in communities receiving print advertising.124
- 2001 BRFSS data from over 61 000 adults showed that only 17.2% overall correctly classified all stroke symptoms and indicated that they would call 911 if they thought someone was having a stroke.125
- In 1995, a telephone survey was conducted in the Greater Cincinnati area. Fifty-seven percent of demographically eligible individuals correctly listed at least 1 of the established warning signs and 68% correctly listed 1 of the established risk factors. Respondents age 75 or older were less likely to correctly list 1 warning sign and were less likely to list 1 stroke risk factor.126
- Patients were recruited from the Academic Medical Center Consortium, the Cardiovascular Health Study and United HealthCare. Only 41% were aware of their increased risk for stroke. About 74% of patients recalled being told of their increased stroke risk by a physician in comparison with 28% who did not recall. Younger patients, depressed patients, those in poor current health, and those with a history of TIA were most likely to be aware of their risk.127
- An AHA-sponsored random-digit dialing telephone survey was conducted in mid 2003. Only 26% of women over age 65 reported being well informed about stroke. Correct identification of the warning signs of stroke was low among all racial/ethnic and age groups.128
- Among participants in a study by the National Stroke Association, 2.3% reported having been told be a physician that they had a TIA. Of those with a TIA, only 64% saw a physician within 24 hours of the event. Only 8.2% correctly related the definition of TIA and 8.6% could identify a typical symptom. Men, nonwhites, and those with lower income and fewer years of education were less likely to be knowledgeable about TIA.75
- Participants in the 1999 World Senior Games received 1 or more free screening tests and completed an awareness questionnaire. Results indicate that stroke education should be targeted at the very elderly, those who have less than a college education and those who do not have a history of chronic disease. It also may be effectively directed toward those with higher cholesterol.129
Cost
- The estimated direct and indirect cost of stroke for 2006 is $57.9 billion.
- In 2001, $3.7 billion ($6037 per discharge) was paid to Medicare beneficiaries discharged from short-stay hospitals for stroke.35
- The mean lifetime cost of ischemic stroke in the United States is estimated at $140 048. This includes inpatient care, rehabilitation and follow-up care necessary for lasting deficits. (All numbers converted to 1999 dollars using the medical component of CPI.)130
- In a population study of stroke costs within 30 days of an acute event, the average cost was $13 019 for mild ischemic strokes and $20 346 for severe ischemic strokes (4 or 5 on the Rankin Disability Scale).131
- Inpatient hospital costs for an acute stroke event account for 70% of the first-year post-stroke costs.130
- The largest components of acute care costs were room charges (50%), medical management (21%) and diagnostic costs (19%).132
- Mortality within 7 days, subarachnoid hemorrhage, and stroke while hospitalized for another condition are associated with higher costs in the first year. Conversely, lower costs are associated with mild cerebral infarctions or residence in a nursing home prior to the stroke.131
- Demographic variables (age, sex and insurance status) are not associated with stroke cost. Severe strokes (NIHSS score greater than 20) cost twice as much as mild strokes, despite similar diagnostic testing. Co-morbidities such as ischemic heart disease and AF predict higher costs.132,133
Operations and Procedures
- In 2003, an estimated 117 000 inpatient endarterectomy procedures were performed in the United States. Carotid endarterectomy is the most frequently performed surgical procedure to prevent stroke.
Stroke in Children
- Stroke in children has a peak in the perinatal period. In the National Hospital Discharge Survey from 1980–98, the rate of stroke for infants less than 30 days old (per 100 000 live births per year) was 26.4, with rates of 6.7 for hemorrhagic stroke and 17.8 for ischemic stroke.134
- A history of infertility, preeclampsia, prolonged rupture of membranes, and chorioamnionitis were found to be independent risk factors for radiologically confirmed perinatal arterial ischemic stroke in the Kaiser Permanente Medical Care Program. The risk of perinatal stroke increased approximately 25-fold with an absolute risk of 1 per 200 deliveries when 3 or more of the following antenatally determined risk factors were present: infertility, preeclampsia, chorioamnionitis, prolonged rupture of membranes, primiparity, oligohydramnios, decreased fetal movement, prolonged second stage of labor, and fetal heart rate abnormalities.135
- The Greater Cincinnati/Northern Kentucky Stroke Study found the stroke rate per 100 000 for children ages 1–14 was 2.7. The rate of ischemic stroke and intracerebral hemorrhage is similar in this age group.136,137
- Stroke in childhood and young adulthood has a disproportionate impact on the affected patients, their family and society, compared to stroke at older ages. Outcome of childhood stroke was a moderate or severe deficit in 42% of cases.138
- Compared to the stroke risk of white children, black children have a higher relative risk of 2.12, Hispanics have a lower relative risk of 0.76, and Asians have a similar risk. Boys have a 1.28-fold higher risk of stroke than girls. There are no ethnic differences in stroke severity or case-fatality, but boys have a higher case-fatality rate for ischemic stroke. The increased risk among blacks is not fully explained by the presence of sickle cell disease, nor is the excess risk among boys fully explained by trauma.139
- Despite current treatment, 1 out of 10 children with ischemic stroke will have a recurrence within 5 years.140
- Cerebrovascular disorders are among the top 10 causes of death in children, with rates highest in the first year of life. Stroke mortality in children under 1 year of age has remained the same over the last 40 years.134
- From 1979–98 in the United States, childhood mortality from stroke declined by 58% overall, with reductions in all major subtypes.141
- –Ischemic stroke decreased by 19%, subarachnoid hemorrhage by 79%, and intracerebral hemorrhage by 54%.
- –Black ethnicity was a risk factor for mortality from all stroke types.
- –Male sex was a risk factor for mortality from subarachnoid hemorrhage and intracerebral hemorrhage but not from ischemic stroke.
- –Black ethnicity was a risk factor for mortality from all stroke types.
- –Ischemic stroke decreased by 19%, subarachnoid hemorrhage by 79%, and intracerebral hemorrhage by 54%.
- Sickle cell disease is the most important cause of ischemic stroke among African-American children. The Stroke Prevention Trial in Sickle Cell Anemia (STOP) demonstrated the efficacy of blood transfusions for primary stroke prevention in high-risk children with sickle cell disease in 1998. First admission rates for stroke in California among persons under age 20 with sickle cell disease showed a dramatic decline subsequent to the publication of the STOP study. For the study years 1991–98, 93 children with sickle cell disease were admitted to California hospitals with a first stroke; 92.5% were ischemic and 7.5% were hemorrhagic. The first-stroke rate was 0.88 per 100 person-years during 1991–98, compared to 0.50 in 1999 and 0.17 in 2000 (P<0.005 for trend).142
| 5. High Blood Pressure |
|---|
(ICD/9 401–404) (ICD/10 I10–I15). See Table 5A.
|
Prevalence
- HBP is defined as:
- –systolic pressure of 140 mm Hg or higher, or diastolic pressure of 90 mm Hg or higher
- –taking antihypertensive medicine
- –being told at least twice by a physician or other health professional that you have HBP
- –taking antihypertensive medicine
- –systolic pressure of 140 mm Hg or higher, or diastolic pressure of 90 mm Hg or higher
- "Prehypertension" is systolic pressure of 120–139 mm Hg, or diastolic pressure of 80–89 mm Hg, and both not taking antihypertensive medication, or not being told on 2 occasions by a doctor or other health professional that you have hypertension.
- Nearly 1 in 3 adults has HBP.145
- About 28% of American adults age 18 and older, or about 59 million people, have "prehypertension" (NHANES 1999–2002, CDC/NCHS, NHLBI).
- In a study conducted in 1999–2000, 39% of persons were normotensive, 31% were prehypertensive, and 29% were hypertensive. The age-adjusted prevalence of prehypertension was greater in men (39%) than in women (23.1%). African Americans ages 20–39 had a higher prevalence of prehypertension (37.4%) than whites (32.2%) and Mexican Americans (30.9%), but their prevalence was lower at older ages because of a higher prevalence of hypertension.146
- A higher percentage of men than women have HBP until age 45. From ages 45–54, the percentage of women is slightly higher. After that a much higher percentage of women have HBP than men do ( CDC/NCHS).
- HBP is 2–3 times more common in women taking oral contraceptives, especially in obese and older women, than in women not taking them (JNC 5 and 6).
- Data from the BRFSS study of the CDC showed that in 2003, 24.8% of respondents had been told they had HBP (CDC Web site).
Race/Ethnicity and HBP
- The prevalence of hypertension in blacks in the United States is among the highest in the world. Compared with whites, blacks develop HBP earlier in life and their average blood pressures are much higher. As a result, compared with whites, blacks have a 1.3-times greater rate of nonfatal stroke, a 1.8-times greater rate of fatal stroke, a 1.5-times greater rate of heart disease death and a 4.2-times greater rate of end-stage kidney disease (JNC 5 and 6).
- Within the African-American community, rates of hypertension vary substantially.147
- –Those with the highest rates are more likely to be middle aged or older, less educated, overweight or obese, physically inactive, and to have diabetes.
- –Those with the lowest rates are more likely to be younger, but also overweight or obese.
- –Those with uncontrolled HBP who are not on antihypertensive medication tend to be male, younger and have infrequent contact with a physician.
- –Those with the lowest rates are more likely to be younger, but also overweight or obese.
- –Those with the highest rates are more likely to be middle aged or older, less educated, overweight or obese, physically inactive, and to have diabetes.
- Compared with white women, black women have an 85% higher rate of ambulatory medical care visits for HBP.148
- A study from 1988–94 to 1999–2000, of children and adolescents ages 8–17 showed that among NH blacks, mean systolic BP levels increased 1.6 mm Hg among girls and 2.9 mm Hg among boys, when compared with NH whites. Among Mexican Americans, girls’ systolic BP increased 1.0 mm Hg and boys’ increased 2.7 mm Hg when compared with NH whites.149
- Data from the 1999–2003 NHIS study of the CDC/NCHS showed that American Indian or Alaska Native adults age 18 and older were less likely (29.7%) than black adults (33.9%) and more likely than white adults (22.8%) and Asian adults (19.3%) to ever have been told they had hypertension.150
- The prevalence of HBP among blacks and whites in the southeastern United States is greater and death rates from stroke are higher than among those in other regions (JNC 5 and 6).
Mortality
HBP was listed as a primary or contributing cause of death in about 277 000 of over 2 440 000 US deaths in 2003.
- From 1993–2003, the age-adjusted death rate from HBP increased 29.3%, and the actual number of deaths rose 56.1%.
- The 2003 overall death rate from HBP was 18.1. Death rates were 14.9 for white males, 49.7 for black males, 14.5 for white females and 40.8 for black females.
- As many as 30% of all deaths in hypertensive black men and 20% of all deaths in hypertensive black women may be due to HBP (JNC 5 and 6).
Control
- In NHANES 1999–2000, rates of control were lower in Mexican Americans (17.7%) compared with NH whites (33.4%) and NH blacks (28.1%).151
- The awareness, treatment and control of HBP among those in the CHS age 65 and older improved during the 1990s. The percentages who were aware of and treated for HBP were higher among blacks than among whites. Prevalences with HBP under control were similar. For both groups combined, the control of BP to lower than 140/90 mm Hg increased from 37% in 1990 to 49% in 1999. Improved control was achieved by an increase in antihypertensive medications per person and by increasing the proportion of the CHS population treated for hypertension from 34.5% to 51.1%.152
- Data from the FHS study of the NHLBI show that in Americans age 80 and older, only 38% of men and 23% of women had BP that met targets set forth in the National High Blood Pressure Education Program’s clinical guidelines.153
Aftermath
- About 69% of people who have a first heart attack, 77% who have a first stroke, and 74% who have CHF have BP higher than 140/90 mm Hg (NHLBI unpublished estimates from ARIC, CHS and FHS Cohort and Offspring Studies).
- People with systolic BP of 160 mm Hg or higher and/or diastolic BP of 95 mm Hg or higher have a RR for stroke about 4 times greater than for those with normal BP.154
- Hypertension precedes the development of CHF in 91% of cases. HBP is associated with a 2–3 times higher risk for developing CHF (FHS, NHLBI, Levy et al155).
Hospital Discharge
- Data from Ambulatory Care Visits to Physician Offices, Hospital Outpatient Departments, and Emergency Departments: U.S., 1999–2000, showed the number of visits for essential hypertension was 37.5 million.56
Awareness
- Data from NHANES 1999–2002 showed that of those with hypertension, 63.4% were aware of their condition, 45.3% were under current treatment, 29.3% had it under control, and 70.7% did not have it controlled.158
Cost
- The estimated direct and indirect cost of HBP for 2006 is $63.5 billion.
End-Stage Renal Disease (ESRD)
(ICD/10 N18.0)
ESRD (also called end-stage kidney disease) is a condition closely related to high blood pressure, and occurs when the kidneys can no longer function normally on their own. When this happens, patients are required to undergo treatment such as kidney dialysis or a kidney transplant. ESRD morbidity rates vary dramatically among different age, race, ethnicity and sex population groups. Morbidity rates tend to increase with age, then fall off for the oldest age group. The age group with the highest incidence rate is ages 75–79; for prevalence rates, it’s ages 70–74. Chronic kidney disease (categorized in stages by level of estimated glomerular filtration rate and urine proteins), which eventually progresses to ESRD, is also a substantial public health burden in the United States. The excess CVD risk in people with chronic renal disease is caused, in part, by a higher prevalence of CVD risk factors in this group than in the general population. The main factors include older age, HBP, high blood cholesterol and lipids, diabetes and physical inactivity. An independent, graded association was observed between a reduced estimated glomerular filtration rate (GFR, an indicator of kidney function) and the risk of death, cardiovascular events and hospitalization in a large, community-based population of over 1 million men and women.159
- The incidence of reported ESRD has almost doubled in the past 10 years (NHLBI from usrds.org Web site).
- In 2003, 102 567 new cases of ESRD were reported.
- Nearly 453 000 patients were being treated for ESRD by the end of 2003.
- 82 588 patients died from ESRD in 2003.
- More than 15 700 kidney transplants were performed in 2003.
- Diabetes continues to be the most common reported cause of ESRD.
- An estimated 11%, or 19.2 million American adults, have between stage 1–4 chronic kidney disease.160
- Between 1996 and 1997, 3.2% of the Medicare population had a diagnosis of chronic kidney disease, representing 63.6% of persons who progressed to ESRD after 1 year.161
Age, Sex, Race and Ethnicity
- The average incidence rates for pediatric ESRD are more than twice as high among children ages 15–19 as for children ages 10–14. The rates are more than 3 times higher than those for children ages 0–4 and 5–9.
- Children with pediatric ESRD have high transplantation rates. More than 44% of children starting therapy received a transplant during the first year of therapy, compared with 10% of patients ages 20–64 at ESRD incidence.
- The median age of the prevalent population is 58.1 years (59.2 for whites, 56.1 for blacks, 56.7 for Hispanics, 58.9 for Asians and 57.5 for Native Americans) (USRDS 2004 Annual Data Report. NIH, NIDDK).
- Treatment of ESRD is more common in men than in women.
- Blacks and Native Americans have much higher rates of ESRD than whites and Asians. Blacks represent 29% of treated ESRD patients.
- Without treatment, ESRD is fatal. Even with dialysis treatment, 20% of ESRD patients die yearly (2004 National Healthcare Disparities Report, AHRQ, USDHHS).
- Expenditures for ESRD totaled almost $23 billion in 2001 (2004 National Healthcare Disparities Report, AHRQ, USDHHS).
- Performance for urea reduction ratio of 65 or greater in hemodialysis patients increased from 74% in 1996 to 90% in 2002 (2004 National Healthcare Disparities Report, AHRQ, USDHHS).
- In both 2001 and 2002, the proportion of adult hemodialysis patients who received adequate dialysis was lower among blacks and higher among Asians compared with whites. The proportion who received adequate dialysis was similar among Hispanics and NH whites.
| 6. Congenital Cardiovascular Defects |
|---|
(ICD/9 745–747) (ICD/10 Q20–Q28). See Table 6A.
|
Congenital cardiovascular defects, also known as congenital heart defects, are structural problems arising from abnormal formation of the heart or major blood vessels. At least 15 distinct types of congenital defects are recognized, with many additional anatomic variations.
Defects range in severity from tiny pinholes between chambers that are nearly irrelevant and often resolve spontaneously, to major malformations that result in fetal loss or death in infancy or childhood. Common complex defects include:
- tetralogy of Fallot (9–14%)
- transposition of the great arteries (10–11%)
- atrioventricular septal defects (4–10%)
- coarctation of the aorta (8–11%)
- hypoplastic left heart syndrome (4–8%)
- ventricular septal defects (VSDs), the most common defect. Many close spontaneously, but VSDs still account for 14–16% of defects requiring an invasive procedure within the first year of life.162
Prevalence
About 1 million Americans, or 3.4 per 1000, reported being told by a physician that they had a congenital cardiovascular defect, according to a national interview survey in 1993–95. The current prevalence is likely to be higher, since both diagnosis and treatment for all types of defects have improved substantially over the past decade, and since some patients may have been unaware of their diagnosis at the time of the survey (CDC/NCHS, HIS Survey, 1993–95. Unpublished data).
Incidence
Major defects are usually apparent in the neonatal period, but minor defects may not be detected until adulthood. Thus, true measures of incidence for congenital heart disease would need to record new cases of defects presenting anytime in fetal life through adulthood. However, estimates are only available for new cases detected between birth and 30 days of life, known as birth prevalence, or as new cases detected in the first year of life only. Both of these are typically reported as cases per 1000 live births per year, and do not distinguish between tiny defects that resolve without treatment and major malformations. To distinguish more serious defects, some studies also report new cases of sufficient severity to undergo an invasive procedure or result in death within the first year of life. Despite the absence of true incidence figures, some data are available, and are shown in Table 6B.
|
- According to the CDC, 1 in every 110 babies in the metropolitan Atlanta area was born with a congenital heart defect, including some infants with tiny defects that resolved without treatment. Some defects occur more commonly in males or females, or in whites or blacks.163
- Nine (9.0) defects per 1000 live births are expected, or 36 000 babies per year in the United States. Of these, several studies suggest that 9200, or 2.3 per 1000 live births, require invasive treatment or result in death in the first year of life.164
- Estimates are also available for bicommisural aortic valves, occurring in 13.7 per 1000 people; these defects may not require treatment in infancy, but can cause problems later in adulthood.165,166
- Some studies suggest that as many as 5% of newborns, or 200 000 per year, are born with tiny muscular ventricular septal defects, almost all of which close spontaneously.167,168 These defects nearly never require treatment, so they aren’t included in Table 6B.
Mortality
- As an underlying or contributing cause of death—6110.
- Congenital cardiovascular disease is the most common cause of infant death from birth defects; 1 in 3 infants who die from a birth defect have a heart defect (NVSS Final Data for 2000).
- The 2002 overall death rate for congenital cardiovascular defects was 1.4. Death rates were 1.5 for white males, 1.9 for black males, 1.3 for white females and 1.6 for black females. Crude infant death rates (under 1 year) were 41.5 for white babies and 51.7 for black babies.
- In 2000, 213 000 life years were lost before age 65 due to deaths from congenital cardiovascular disease. This is nearly equivalent to the life years lost from leukemia, prostate cancer and Alzheimer’s disease combined (CDC/NCHS; NHLBI).
- In 2000, over 25 000 cardiovascular operations for congenital heart disease were performed on children less than 20 years of age. Inpatient mortality after all types of cardiac surgery was 4.7%. However, mortality risk varies substantially for different defect types, from 0.3% for atrial septal defect repair to 20.1% for first stage palliation for hypoplastic left heart syndrome. Of these operations, 54% were performed in males. In unadjusted analyses, mortality after cardiac surgery was somewhat higher for females than for males (4.8% versus 4.6%) (Healthcare Cost and Utilization Project, HCUP KID2000).
- Mortality from congenital defects has been declining. From 1979–97, age-adjusted death rates from all defects declined 39%, and deaths tended to occur at progressively older ages. However, 43% of deaths still occurred in infants of less than 1 year of age. Mortality varies considerably according to type of defect.169
- From 1992–2002, death rates for congenital cardiovascular defects declined 25.0%, while the actual number of deaths declined 24.1%.
Hospitalizations
In 2000, over 130 000 hospitalizations, as a primary or secondary diagnosis, were for infants or children with congenital cardiovascular disease; hospital charges were $6.5 billion (HCUPKID2000).
| 7. Heart Failure |
|---|
(ICD/9 428) (ICD/10 I50). See Table 7A.
|
Prevalence
- In a study conducted in Minnesota, 20.8% of the population had mild diastolic dysfunction, 6.6% had moderate diastolic dysfunction, 0.7% had severe diastolic dysfunction, and 5.6% had moderate or severe diastolic dysfunction with normal ejection fraction (EF). The prevalence of any systolic dysfunction was 6.0% and moderate or severe systolic dysfunction was 2.0%. CHF was much more common among those with systolic or diastolic dysfunction than in those with normal ventricular function. Even among those with moderate or severe diastolic or systolic dysfunction, less than half had recognized CHF. Mild diastolic dysfunction and moderate or severe diastolic dysfunction were predictive of all-cause mortality.170
Incidence
- Based on the 44-year follow-up of the NHLBI’s FHS2...
- –HF incidence approaches 10 per 1000 population after age 65.
- –Seventy-five percent of HF cases have antecedent hypertension.
- –About 22% of male and 46% of female heart attack (MI) victims will be disabled with HF within 6 years.
- –Seventy-five percent of HF cases have antecedent hypertension.
- –HF incidence approaches 10 per 1000 population after age 65.
- Based on 1971–96 data from the NHLBI’s FHS171...
- –At age 40, the lifetime risk of developing CHF for both men and women is 1 in 5.
- –At age 40, the lifetime risk of CHF occurring without antecedent MI is 1 in 9 for men and 1 in 6 for women.
- –The lifetime risk doubles for people with BP greater than 160/90 mm Hg versus those with BP less than 140/90 mm Hg.
- –At age 40, the lifetime risk of CHF occurring without antecedent MI is 1 in 9 for men and 1 in 6 for women.
- –At age 40, the lifetime risk of developing CHF for both men and women is 1 in 5.
- The annual rates per 1000 population of new and recurrent HF events for non-black men are 21.5 for ages 65–74, 43.3 for ages 75–84, and 73.1 for age 85 and older. For non-black women in the same age groups the rates are 11.2, 26.3 and 64.9, respectively. For black men the rates are 21.1, 52.0 and 66.7, and for black women the rates are 18.9, 33.5 and 48.4, respectively (CHS, NHLBI).
- A community-based cohort study conducted in Olmsted County, Minn., showed that the incidence of HF (ICD9/428) has not declined during 2 decades, but survival after onset has increased overall, with less improvement among women and elderly persons.172
Risk Factors
- A study of the predictors of HF among women with CHD found that diabetes was the strongest risk factor. Diabetic women with elevated body mass index (BMI) or depressed creatinine clearance were at highest risk with annual incidence rates of 7% and 13% respectively. Among nondiabetic women with no risk factors, the annual incidence rate was 0.4%. The rate increases with each additional risk factor, and nondiabetic women with 3 or more risk factors had an annual incidence of 3.4%. Among diabetic participants with no additional risk factors, the annual incidence of HF was 3.0% compared with 8.2% among diabetics with at least 3 additional risk factors. Diabetics with fasting glucose >300 mg/dL had a 3-fold adjusted risk of developing HF, compared with diabetics with controlled fasting blood sugar levels.173
Mortality
As an underlying or contributing cause of death—286 700.
- Based on the 44-year follow-up of the NHLBI’s FHS...
- –Eighty percent of men and 70% of women under age 65 who have HF will die within 8 years.
- –After HF is diagnosed, survival is poorer in men than in women, but fewer than 15% of women survive more than 8–12 years. The 1-year mortality rate is high, with 1 in 5 dying.
- –In people diagnosed with HF, sudden cardiac death occurs at 6–9 times the rate of the general population.
- –After HF is diagnosed, survival is poorer in men than in women, but fewer than 15% of women survive more than 8–12 years. The 1-year mortality rate is high, with 1 in 5 dying.
- –Eighty percent of men and 70% of women under age 65 who have HF will die within 8 years.
- From 1993–2003, deaths from HF (ICD 428) increased 20.5%. In the same time period, the death rate declined 2.0%.
- The 2003 overall death rate for HF was 19.7. Death rates were 20.5 for white males, 23.4 for black males, 18.4 for white females and 20.4 for black females.
Hospital Discharges
- Hospital discharges for HF rose from 399 000 in 1979 to 1 093 000 in 2003, an increase of 174% (National Hospital Discharge Survey, CDC/NCHS).
- Data from Ambulatory Care Visits to Physician Offices, Hospital Outpatient Departments, and Emergency Departments: US, 1999–2000, showed the number of visits for CHF was 3.4 million.56
Cost
- The estimated direct and indirect cost of HF in the United States for 2006 is $29.6 billion.
- In 2001, $4.0 billion ($5912 per discharge) was paid to Medicare beneficiaries for CHF.35
| 8. Other Cardiovascular Diseases |
|---|
Mortality, prevalence and death rate data in this section are for 2002 or 2003. Mortality for 2003 is preliminary. Mortality as an underlying or contributing cause of death is for 2002. Hospital discharge data for 2003 are based on ICD/9 codes.
Arrhythmias (Disorders of Heart Rhythm)
(ICD/9 426, 427) (ICD/10 I46–I49)
Mortality—38 698. Mortality as an underlying or contributing cause of death—479 700 of over 2 440 000 US deaths. Hospital discharges—856 000. In 2001, $2.7 billion ($6634 per discharge) was paid to Medicare beneficiaries for cardiac dysrhythmias.35
Atrial fibrillation and flutter (ICD/9 427.3) (ICD/10 I48). Mortality—10 089. Mortality as an underlying or contributing cause of death—77 800. Prevalence—>2 200 000. Incidence—>75 000.174 Hospital discharges—470 000.
- In the FHS study, the lifetime risk for development of AF is 1 in 4 for men and women 40 years of age and older. Lifetime risks for AF are high (1 in 6), even in the absence of antecedent CHF or MI.175
- Data from the National Hospital Discharge Survey (1996–2001) on cases that included AF as a primary discharge diagnosis found that176:
- –About 44.8% of patients were men.
- –The mean age for men was 66.8 years versus 74.6 for women.
- –The racial breakdown for admissions was 71.2% white, 5.6% black, 2.0% other races (20.8% were not specified).
- –African-American patients were much younger than patients of other races.
- –The incidence in men ranged from 20.58/100 000 persons per year for patients ages 15–44 to 1077.39/100 000 persons per year for patients age 85 and older. In women, the incidence ranged from 6.64/100 000 persons per year for patients ages 15–44 to 1 203.7/100 000 persons per year for those age 85 and older.
- –From 1996–2001, hospitalizations with AF as the first-listed diagnosis increased 34%.
- –The mean age for men was 66.8 years versus 74.6 for women.
- –About 44.8% of patients were men.
- Age-adjusted death rates for AF were highest among whites (25.7) and blacks (16.4) and higher for men (34.7) than women (22.8).177
- The most common diseases listed as the primary diagnosis for persons hospitalized with AF were CHF (11.8%), followed by AF (10.9%), CHD (9.9%), and stroke (4.9%).177
- AF is an independent risk factor for stroke, increasing risk about 5-fold. The risk for stroke attributable to AF increases with age.93
- AF is responsible for about 15–20% of all strokes.178
- AF is also an independent risk factor for stroke recurrence and stroke severity. A recent report showed people who had AF and were not treated with anticoagulants had a 2.1-fold increase in risk for recurrent stroke and a 2.4-fold increase in risk for recurrent severe stroke.179
- People who have strokes caused by AF have been reported as 2.23 times more likely to be bedridden compared to those who have strokes from other causes.180
- Participants in the FHS Offspring Study of the NHLBI were examined between 1984 and 1987 and monitored for 10 years. Data show that symptoms of anger and hostility were predictive of 10-year incidence of AF in men.181
- Participants in the FHS study of the NHLBI were followed from 1968–99. At age 40, lifetime risks for AF were 26.0% for men and 23.0% for women. At 80 years, lifetime risks for AF were 22.7% for men and 21.6% for women. In further analysis, counting only those who had development of AF without prior or concurrent CHF or MI, lifetime risk for AF was approximately 16%.175
- Tachycardia (ICD/9 427.0,1,2) (ICD/10 I47.0,1,2,9). Mortality—610. Mortality as an underlying or contributing cause of death—7200. Hospital discharges—84 000.
- Paroxysmal supraventricular tachycardia (ICD/9 427.0) (ICD/10 I47.1). Mortality—151. Mortality as an underlying or contributing cause of death—1454. Hospital discharges—28 000.
- Ventricular fibrillation (ICD/9 427.4) (ICD/10 I49.0). Mortality—1264. Mortality as an underlying or contributing cause of death—13 100. Hospital discharges—8000. Ventricular fibrillation is listed as the cause of relatively few deaths, but the overwhelming number of sudden cardiac deaths from coronary disease (estimated at about 330 000 per year) are thought to be from ventricular fibrillation.
Arteries, Diseases of
(ICD/9 440–448) (ICD/10 I70–I79) (Includes peripheral arterial disease)
Mortality—37 647. Mortality as an underlying or contributing cause of death—115 400. Hospital discharges—262 000.
Aortic aneurysm (ICD/9 441) (ICD/10 I71). Mortality—14 751. Mortality as an underlying or contributing cause of death—20 800. Hospital discharges—53 000.
Atherosclerosis (ICD/9 440) (ICD/10 I70) is a process that leads to a group of diseases characterized by a thickening of artery walls. Preliminary mortality (2003)—13 030. Mortality as an underlying or contributing cause of death—66 000. Hospital discharges—118 000. Atherosclerosis causes many deaths from heart attack and stroke and accounts for nearly three-fourths of all deaths from CVD (FHS, NHLBI).
- In 1999 US community hospitals billed $26.2 billion for coronary atherosclerosis, more than for any other condition (AHRQ Electronic Newsletter, June 14, 2002).
Other diseases of arteries (ICD/9 442–448) (ICD/10 I72–I78). Preliminary mortality (2003)—9867. Mortality as an underlying or contributing cause of death—10 109. Hospital discharges—91 000.
- Kawasaki disease (ICD/9 446.1) (ICD/10 M30.3). Mortality—9. Mortality as an underlying or contributing cause of death—14. Hospital discharges—5000, primary plus secondary diagnoses.
- –About 76% of Kawasaki disease patients are under age 5.182
- –Up to 2500 cases of Kawasaki disease are diagnosed yearly. Kawasaki disease occurs more often among boys (63%) and among those of Asian ancestry.183
- –The highest incidence in the United States is in Hawaii. A hospitalization rate of 47.7 per 100 000 children under age 5 was reported during the mid-1990s. In the continental United States, the estimated incidence is from 9–19 per 100 000 children.184
- –Up to 2500 cases of Kawasaki disease are diagnosed yearly. Kawasaki disease occurs more often among boys (63%) and among those of Asian ancestry.183
- –About 76% of Kawasaki disease patients are under age 5.182
Peripheral arterial disease (PAD) affects about 8 million Americans and is associated with significant morbidity and mortality.185,186
- A study from the NHANES 1999–2000 data found that PAD affects about 5 million adults. Prevalence increases dramatically with age and disproportionately affects blacks.187 However, the measurement of systolic BP utilizing the right arm only and the omission of queries for surgical procedures to correct PAD in this study led to an underestimate of the true PAD prevalence. Experts in the field generally agree that PAD affects approximately 8 million Americans.185,186
- PAD affects 12–20% of Americans age 65 and older. Despite its prevalence and cardiovascular risk implications, only 25% of PAD patients are undergoing treatment.188
- In the general population, only about 10% of persons with PAD have the classic symptoms of intermittent claudication (IC). About 40% do not complain of leg pain, while the remaining 50% have a variety of leg symptoms different from classic claudication.185,189 However, in an older, disabled, population of women, as many as two-thirds of individuals with PAD had no exertional leg symptoms.190
- The risk factors for PAD are similar to those for CHD, although diabetes and cigarette smoking are particularly strong risk factors for PAD.191
- Persons with PAD have impaired function and quality of life. This is true even for persons who do not report leg symptoms. Furthermore, PAD patients, including those who are asymptomatic, experience significant decline in lower extremity functioning over time.192,193
- PAD is a marker for systemic atherosclerotic disease. Persons with PAD, compared to those without, have 4–5 times the risk of dying of a CVD event, resulting in 2–3 times higher total mortality risk.186,194
- In the Framingham Heart Study (FHS), the incidence of PAD was based on symptoms of IC in subjects ages 29–62. Annual incidence of IC per 10 000 subjects at risk rose from 6 in men and 3 in women ages 30–44 to 61 in men and 54 in women ages 65–74.195 IC incidence has declined since 1950, but mortality has remained high and unchanged.196
- Several studies have evaluated both symptomatic and asymptomatic PAD using the ankle brachial index. The prevalence of asymptomatic PAD was 25.5% among 1537 participants of the Systolic Hypertension in the Elderly Program (SHEP).195
- In the FHS, the annual mortality rate was almost 4 times greater in subjects with IC. In a major cohort study, investigators observed a risk for all-cause mortality in these subjects that was 3.1 times higher than that for patients without PAD. In addition, PAD patients had a 5.9-times higher risk for death from CVD complications and a 6.6-times higher risk for death from CHD specifically.186,195
- African-American ethnicity was a strong and independent risk factor for PAD, and was not explained by higher levels of diabetes, hypertension, and BMI. African Americans had a higher PAD prevalence than NH whites (OR= 2.3). There was no evidence of a greater susceptibility of African Americans to CVD risk factors as a reason for their higher PAD prevalence.197
- Data from NHANES 1999–2000 (CDC/NCHS), show that even low blood levels of lead and cadmium may increase the risk of PAD. Exposure to these 2 metals is possible through cigarette smoke. The risk was 2.8 for high levels of cadmium and 2.9 for high levels of lead. The odds ratio of PAD for current smokers was 4.13 compared to people who had never smoked.198 Results from the NHANES 1999–2000 survey of the CDC/NCHS showed a remarkably high prevalence of PAD among patients with renal insufficiency. Accurate identification of patients with renal insufficiency combined with routine ABI measurement in this group would greatly enhance efforts to detect subclinical PAD.199
Bacterial Endocarditis
(ICD/9 421.0) (ICD/10 I33.0)
Mortality as an underlying or contributing cause of death—2370. Hospital discharges—29 000, primary plus secondary diagnoses.
Cardiomyopathy
(ICD/9 425) (ICD/10 I42)
Mortality—27 728. Mortality as an underlying or contributing cause of death—54 700. Hospital discharges—39 000.
- Eighty-seven percent of cases are congestive or dilated cardiomyopathy. Of patients with dilated cardiomyopathy, 50% are alive 5 years after their initial diagnosis and 25% are alive 10 years after the diagnosis (Facts About Cardiomyopathy, NIH, NHLBI, 1995).
- Mortality from cardiomyopathy is highest in older persons, men and blacks (FHS, NHLBI).
- Tachycardia-induced cardiomyopathy develops slowly and appears reversible, but recurrent tachycardia causes rapid decline in left ventricular function and development of HF. Sudden death is possible.200
- Since 1996, the NHLBI’s Pediatric Cardiomyopathy Registry has collected data on all children with newly diagnosed cardiomyopathy in New England and the Central Southwest (Texas, Oklahoma and Arkansas).201
- –The overall incidence of cardiomyopathy is 1.13 cases per 100 000 in children younger than age 18.
- –In children under 1 year of age, the incidence is 8.34 and in children ages 1–18 it’s 0.70 per 100 000.
- –The annual incidence is lower in white than in black children; higher in boys than in girls; and higher in New England (1.44 per 100 000) than in the Central Southwest (0.98 per 100 000).
- –In children under 1 year of age, the incidence is 8.34 and in children ages 1–18 it’s 0.70 per 100 000.
- –The overall incidence of cardiomyopathy is 1.13 cases per 100 000 in children younger than age 18.
- Studies show that 36% of young athletes who die suddenly have probable or definite hypertrophic cardiomyopathy.202
Rheumatic Fever/Rheumatic Heart Disease
(ICD/9 390–398) (ICD/10 I00–I09). See Table 8A.
|
Incidence
- Many operations on heart valves are related to rheumatic heart disease (RHD).
- The incidence of rheumatic fever (RF) remains higher in African Americans, Puerto Ricans, Mexican Americans and American Indians.2
Mortality
- Mortality as an underlying or contributing cause of death—7440.
- In 1950, about 15 000 Americans (adjusted for changes in ICD codes) died of RF/RHD compared with about 3500 today.
- From 1993–2003 the death rate from RF/RHD fell 36.8%, while actual deaths declined 24.6%.
- The 2003 overall death rate for RF/RHD was 1.2. Death rates were 1.0 for white males and 0.9 for black males, 1.4 for white females and 1.2 for black females.
Valvular Heart Disease
(ICD/9 424) (ICD/10 I34–I38)
Mortality—19 989. Mortality as an underlying or contributing cause of death—42 590. Hospital discharges—95 000.
- Aortic valve disorders (ICD/9 424.1) (ICD/10 I35). Mortality—12 471. Mortality as an underlying or contributing cause of death—about 26 336. Hospital discharges—48 000.
- Mitral valve disorders (ICD/9 424.0) (ICD/10 I34). Mortality—2759. Mortality as an underlying or contributing cause of death—about 6600. Hospital discharges—43 000.
- –The NHLBI’s FHS reports that among people ages 26–84, prevalence is about 1–2% and equal between women and men.
- –The NHLBI’s FHS reports that among people ages 26–84, prevalence is about 1–2% and equal between women and men.
- Pulmonary valve disorders (ICD/9 424.3) (ICD/10 I37). Mortality—11. Mortality as an underlying or contributing cause of death—35.
- Tricuspid valve disorders (ICD/9 424.2) (ICD/10 I36). Mortality—16. Mortality as an underlying or contributing cause of death—69.
Operations and Procedures
- In 2003, an estimated 95 000 inpatient valve procedures were performed in the United States.
Venous Thromboembolism
- Venous thromboembolism (VTE) occurs for the first time in about 100 persons per 100 000 each year in the United States. About one-third of patients with symptomatic VTE manifest pulmonary embolism (PE), whereas two-thirds manifest deep vein thrombosis (DVT) alone.203
- Caucasians and African Americans have a significantly higher incidence than Hispanics and Asians or Pacific Islanders.203
- In studies conducted in Worcester, Mass., and Olmsted County, Minn., the incidence of VTE was about 1 in 1000. In both studies, VTE was more common in men; for each 10-year increase in age, the incidence doubled. By extrapolation, it’s estimated that more than 250 000 patients are hospitalized annually with VTE.204
- The crude incidence rate per 1000 person-years was 0.80 in the ARIC study, 2.15 in the CHS and 1.08 in the combined cohort. Half of the participants who developed incident VTE were women and 72% were white.205
- Over 200 000 new cases of VTE occur annually. Of these, 30% die within 30 days, one-fifth suffer sudden death due to PE, and about 30% develop recurrent VTE within 10 years. Independent predictors for recurrence include increasing age, obesity, malignant neoplasm and extremity paresis.206
- Data from the ARIC study of the NHLBI showed the 28-day fatality from DVT is 9%; from PE, 15%; from idiopathic DVT or PE, 5%; from secondary non-cancer-related DVT or PE, 7%; and secondary cancer-related DVT or PE, 25%.207
- Deep vein thrombosis (ICD/9 451.1) (ICD/10 I80.2). Mortality—2809. Mortality as an underlying or contributing cause of death—10 530. Hospital discharges—9000.
- A review of 9 studies conducted in the United States and Sweden showed that the mean incidence of first DVT in the general population was 5.04 per 10 000 person-years. The incidence was similar in males and females and increased dramatically with age from about 2–3 per 10 000 person-years at ages 30–49 to 20 at ages 70–79.208
- Death occurs in about 6% of DVT cases within 1 month of diagnosis.203
- Pulmonary embolism (ICD/9 415.1) (ICD/10 I26). Mortality—8620. Mortality as an underlying or contributing cause of death—26 600. Hospital discharges —124 000.
- In the Nurses’ Health Study, nurses age 60 or older in the highest BMI quintile had the highest rates of pulmonary embolism. Heavy cigarette smoking and high blood pressure were also identified as risk factors for PE.204
- Death occurs in about 12% of PE cases within 1 month of diagnosis.203
- A study of Medicare recipients age 65 and older reported 30-day case fatality rates in patients with PE. Overall, men had higher fatality rates than women (13.7% versus 12.8%), and blacks had higher fatality rates than whites (16.1% versus 12.9%).204
- In the International Cooperative Pulmonary Embolism Registry, the 3-month mortality rate was 17.5%. In contrast, the overall 3-month mortality rate in the Prospective Investigation of Pulmonary Embolism Diagnosis was 15%, but only 10% of deaths during 1 year of follow-up were ascribed to PE.204
- The age-adjusted rate of deaths from pulmonary thromboembolism (PTE) decreased from 191 per million in 1979 to 94 per million in 1998 overall, decreasing 56% for men and 46% for women. During this time, the age-adjusted mortality rates for blacks were consistently 50% higher than those for whites, and those for whites were 50% higher than those for people of other races (Asian, American Indian, etc.). Within racial strata, mortality rates were consistently 20–30% higher among men than among women.209
| 9. Risk Factors |
|---|
Tobacco
See Tables 9A and 9B
|
|
Prevalence
Youth
- In 2003, for grades 9–12, 30.3% of male students and 24.6% of female students reported current tobacco use; 19.9% of males and 9.4% of females reported current cigar use; and 11.0% of males and 2.2% of females reported current smokeless tobacco use.213
- White youths ages 18–24 from families with lower educational attainment report substantially higher smoking rates than black and Mexican-American youths from families with similar educational attainment. Seventy-seven percent of young white men and 61% of young white women are smokers compared with 35% of minority youth.214
- From 1980–2003, the percentage of high school seniors who smoked in the past month decreased 20%. This percentage decreased by 2.2% in males, 23.7% in females, 9% in whites and 64.3% in blacks or African Americans (Health, United States, 2004, CDC/NCHS).
- An estimated 150 000–300 000 children younger than 18 months of age have respiratory tract infections because of exposure to secondhand smoke (CDC/NCHS).
- Children’s exposure to secondhand smoke, as indicated by cotinine levels, dropped between 1988–94 and 1999–2002. Overall, 59% of children ages 4–11 had cotinine in their blood in 1999–2002, down from 88% in 1988–94. In 1999–2002, 84% of NH black children ages 4–11 had cotinine in their blood compared to 58% of NH white children and 47% of Mexican-American children. The percentage of homes with children under age 7 in which someone smokes on a regular basis decreased from 29% in 1994 to 11% in 2003.215
Adults
- Since 1965 smoking in the United States has declined by 47% among people age 18 and older (Health, United States, 2004, CDC/NCHS).
- Among Americans age 18 and older, 23.4% of men and 18.5% of women are smokers, putting them at increased risk of heart attack and stroke.210
- Use of any tobacco product in 2002 was 32.0% for white only, 28.8% for black or African-American only, 44.3% for American Indian or Alaska Native only, 28.8% for Native Hawaiian or other Pacific Islander only, 18.6% for Asian only and 25.2% for Hispanic or Latino, any race (Health, United States, 2004, CDC).
- Smoking prevalence is higher among those with 9–11 years of education (34.0%) compared with those with more than 16 years of education (8.0%). It’s highest among persons living below the poverty level (29.1%) compared with other income groups.213
- Compared with results from 1988–91, median cotinine levels measured from 1999–2002 in nonsmokers have decreased 68% in children, 69% in adolescents, and about 75% in adults. NH blacks have levels more than twice as high as those of NH whites and Mexican Americans. Children’s levels are more than twice those of adults.216
- Data from the BRFSS study of the CDC show that more than one-third of white men and women ages 18–24 smoked, the highest rate among all the groups covered in the survey in 2000. Those young people and Hispanic women the same age had the largest increases in smoking rates from 1990–2000. More than half of men and women ages 18–24 from all ethnic groups failed to quit smoking in 2000. Younger white women and men ages 18–44 had higher overall risk levels for noncommunicable diseases, probably due to increased smoking and obesity.23
- According to the World Health Organization (WHO), 1 year after quitting, the risk of CHD decreases by 50%. Within 15 years, the relative risk of dying from CHD for an ex-smoker approaches that of a long-time (lifetime) nonsmoker (World No-Tobacco Day 1998, www.who.ch/ntday/ntday98).
- Data from the 2004 NHIS study of the CDC/NCHS showed that American Indian or Alaska Native adults age 18 and older were more likely (33.4%) to be current smokers than NH white adults (22.2%), black adults (20.2%) and Asian adults (11.3%).210
Incidence
- A survey conducted in 2002 found that an estimated 1.4 million Americans began smoking cigarettes daily in 2001. This translates to close to 4000 new regular smokers per day, including more than 2000 youths under age 18 (National Survey on Drug Use and Health, samhsa.gov).
- About 80% of people who use tobacco begin before age 18. The most common age of initiation is 14–15.220
- Information from the CDC Health Effects of Cigarette Smoking Fact Sheet, February 2004:
- –Cigarette smokers are 2–4 times more likely to develop CHD than nonsmokers.
- –Cigarette smoking approximately doubles a person’s risk for stroke.
- –Cigarette smokers are more than 10 times as likely as nonsmokers to develop peripheral vascular disease.
- –Cigarette smoking approximately doubles a person’s risk for stroke.
- –Cigarette smokers are 2–4 times more likely to develop CHD than nonsmokers.
Mortality
- From 1997–2001, an estimated 437 902 Americans died each year of smoking-related illnesses, and 34.7% of these deaths were cardiovascular-related.221
- On average, male smokers die 13.2 years earlier than male nonsmokers, and female smokers die 14.5 years earlier than female nonsmokers.222
- From 1997–2001, smoking caused 3.3 million years of potential life lost for men and 2.2 million years for women annually.223
- From 1997–2001, smoking during pregnancy resulted in an estimated 523 male and 387 female infant deaths annually.221
- Current cigarette smoking is a powerful independent predictor of sudden cardiac death in patients with CHD.224
- Cigarette smoking results in a 2–3-fold risk of dying from CHD.225
- After up to 14.5 years of follow-up of participants in the Lung Health Study (LHS) of the NHLBI, all-cause mortality was significantly lower (15%) compared to those who received usual care.226
- An estimated 35 052 nonsmokers die from CHD each year as a result of exposure to environmental tobacco smoke (MMWR, Vol. 54, No. 25, 2005, CDC).
Health Consequences
- Data from The Health Consequences of Smoking, 2004—A Report of the Surgeon General (CDC/NCHS): A study of women younger than 44 years of age found there was a strong dose-relationship for MI, with a risk of 2.5 for those smoking 1–5 cigarettes per day, rising to 74.6 for those smoking more than 40 cigarettes per day, compared with nonsmokers.
- —Another study on female smokers found the highest risk (6.8) for MI was in women younger than 55 years of age.
- —One-third of those who receive percutaneous coronary artery vascularization are current smokers, and 50–60% continue to smoke after the procedure.
- —Cigarette smoking remains a major cause of stroke in the United States. The evidence is sufficient to infer a causal relationship between smoking and subclinical atherosclerosis.
- —The 2004 Health Consequences of Smoking Report of the Surgeon General states that the risk of stroke decreases steadily after smoking cessation. Former smokers have the same risk as nonsmokers after 5–15 years.227
- —One-third of those who receive percutaneous coronary artery vascularization are current smokers, and 50–60% continue to smoke after the procedure.
- —Another study on female smokers found the highest risk (6.8) for MI was in women younger than 55 years of age.
Chewing Tobacco
- About 5 million American men and women use chewing tobacco (NHANES III [1988–94], CDC/NCHS).
- –Rates are highest in the South and rural areas.
- –Men use chewing tobacco at 10 times the rate for women. For men, the percentages who use chewing tobacco are 6.8 for whites, 3.1 for blacks, 1.5 for Hispanics, 1.2 for Asians or Pacific Islanders and 7.8 for American Indians or Alaska Natives.
- –For women, the percentages are 0.3 for whites, 2.9 for blacks, 0.1 for Hispanics, almost none for Asians or Pacific Islanders and 1.2 for American Indians or Alaska Natives.
- –Use rates increase as years of education decrease for both men and women.
- –Men use chewing tobacco at 10 times the rate for women. For men, the percentages who use chewing tobacco are 6.8 for whites, 3.1 for blacks, 1.5 for Hispanics, 1.2 for Asians or Pacific Islanders and 7.8 for American Indians or Alaska Natives.
- –Rates are highest in the South and rural areas.
Cost
- Direct medical costs ($75.5 billion) and lost productivity costs associated with smoking ($92 billion) total an estimated $167 billion per year.221
| High Blood Cholesterol and Other Lipids |
|---|
See Table 9C.230
|
Prevalence
For information on dietary cholesterol, total fat, saturated fat and other factors that affect blood cholesterol levels, see Nutrition section.
Youth
- Among children and adolescents ages 4–19 (NHANES III [1988–94], CDC):
- –Females have significantly higher average total cholesterol and low-density lipoprotein (LDL) cholesterol (bad cholesterol) than do males.
- –NH black children and adolescents have significantly higher mean total cholesterol, LDL (bad) cholesterol and HDL (good) cholesterol levels when compared with NH white and Mexican-American children and adolescents.
- –NH black children and adolescents have significantly higher mean total cholesterol, LDL (bad) cholesterol and HDL (good) cholesterol levels when compared with NH white and Mexican-American children and adolescents.
- –Females have significantly higher average total cholesterol and low-density lipoprotein (LDL) cholesterol (bad cholesterol) than do males.
- Among children and adolescents ages 4–19, the mean total blood cholesterol level is 165 mg/dL. For boys, it’s 163 mg/dL and for girls, it’s 167 mg/dL. The racial/ethnic breakdown is (NHANES III [1988–94], CDC/NCHS):
- –For NH whites, 162 mg/dL for boys and 166 mg/dL for girls.
- –For NH blacks, 168 mg/dL for boys and 171 mg/dL for girls.
- –For Mexican Americans, 163 mg/dL for boys and 165 mg/dL for girls.
- –For NH blacks, 168 mg/dL for boys and 171 mg/dL for girls.
- –For NH whites, 162 mg/dL for boys and 166 mg/dL for girls.
- About 10% of adolescents ages 12–19 have total cholesterol levels exceeding 200 mg/dL (NHANES III [1988–94], CDC/NCHS).
Adults
- BRFSS data from 1991–2003 showed the prevalence of cholesterol screening during the preceding 5 years increased from 67.3% in 1991 to 73.1% in 2003. The age-standardized prevalence of high blood cholesterol awareness among persons screened increased from 25.3% in 1991 to 31.1% in 2003.231
- A 10% decrease in total cholesterol levels (population-wide) may result in an estimated 30% reduction in the incidence of CHD.232
- Data from NHANES 1999–2002 showed that overall, 63.3% of participants whose test results indicated high blood choleserol or who were taking a cholesterol-lowering medication had been told by a professional that they had high cholesterol. Women were less likely than men to be aware of their condition; blacks and Mexican Americans were less likely to be aware of their condition than whites. Less than half of Mexican Americans with high cholesterol were aware of their condition.233
- Between 1988–94 and 1999–2002, the age-adjusted mean total serum cholesterol level of adults age 20 and over decreased from 206 mg/dL to 203 mg/dL and LDL cholesterol levels decreased from 129 mg/dL to 123 mg/dL.234
Adherence
Based on data from the Third Report of the Expert Panel on Detection, Evaluation, and Treatment of High Blood Cholesterol in Adults235:
- Less than half of persons who qualify for any kind of lipid-modifying treatment for CHD risk reduction are receiving it.
- Less than half of even the highest-risk persons, those who have symptomatic CHD, are receiving lipid-lowering treatment.
- Only about a third of treated patients are achieving their LDL goal; less than 20% of CHD patients are at their LDL goal.
LDL (Bad) Cholesterol
Youth
- Mean LDL cholesterol levels among children and adolescents ages 12–19 are (NHANES III [1988–94], CDC/NCHS):
- –Among NH whites, 91 mg/dL for boys and 100 mg/dL for girls.
- –Among NH blacks, 99 mg/dL for boys and 102 mg/dL for girls.
- –Among Mexican Americans, 93 mg/dL for boys and 92 mg/dL for girls.
- –Among NH blacks, 99 mg/dL for boys and 102 mg/dL for girls.
- –Among NH whites, 91 mg/dL for boys and 100 mg/dL for girls.
Adults
- The mean level of LDL cholesterol for American adults age 20 and older is 123 mg/dL. Levels of 130–159 mg/dL are considered borderline high. Levels of 160–189 mg/dL are classified as high, and levels of 190 mg/dL and higher are very high.234
- According to NHANES 1999–2002
- — Among NH whites, the mean LDL cholesterol level was 126 mg/dL for men and 121 mg/dL for women.
- — Among NH blacks, the mean LDL cholesterol level was 121 mg/dL for both men and women.
- — Among Mexican Americans, the mean LDL cholesterol level was 125 mg/dL for men and 117 mg/dL for women.
- — Among NH blacks, the mean LDL cholesterol level was 121 mg/dL for both men and women.
- — Among NH whites, the mean LDL cholesterol level was 126 mg/dL for men and 121 mg/dL for women.
HDL (Good) Cholesterol
The higher a person’s HDL cholesterol level is, the better. A level of less than 40 mg/dL in adults is considered low HDL cholesterol, which is a risk factor for heart disease and stroke.
Youth
- Mean HDL cholesterol levels among children and adolescents ages 4–19 are (NHANES III [1988–94], CDC/NCHS):
- –Among NH whites, 48 mg/dL for boys and 50 mg/dL for girls.
- –Among NH blacks, 55 mg/dL for boys and 56 mg/dL for girls.
- –Among Mexican Americans, 51 mg/dL for boys and 52 mg/dL for girls.
- –Among NH blacks, 55 mg/dL for boys and 56 mg/dL for girls.
- –Among NH whites, 48 mg/dL for boys and 50 mg/dL for girls.
Adults
- The mean level of HDL cholesterol for American adults age 20 and older is 51.3 mg/dL.234
- According to NHANES 1999–2002
- — Among NH whites, the mean HDL cholesterol level was 45.5 mg/dL for men and 52.9 for women.
- — Among NH blacks, the mean HDL cholesterol level was 51.0 mg/dL for men and 57.3 for women.
- — Among Mexican Americans, the mean HDL cholesterol level was 45.0 mg/dL for men and 52.9 for women.
- — Among NH blacks, the mean HDL cholesterol level was 51.0 mg/dL for men and 57.3 for women.
- — Among NH whites, the mean HDL cholesterol level was 45.5 mg/dL for men and 52.9 for women.
| Physical Activity |
|---|
See Tables 9D and 9E
|
|
Prevalence
Youth
- In 2003, 58.5% of male and 52.8% of female high school students, grades 9–12, were enrolled in physical education (PE) classes. Among these students, 30.5% of males and 26.4% of females attended classes daily and 84.5% of males and 75.3% of females exercised or played sports during an average PE class.237
- 2002 data from the Youth Media Campaign Longitudinal Study (YMCLS) of the CDC showed that 61.5% of children ages 9–13 don’t participate in any organized physical activity (PA) during their nonschool hours and that 22.6% don’t engage in any free-time PA. NH black and Hispanic children are significantly less likely than NH white children to report involvement in organized activities, as are children with parents who have lower incomes and education levels.239
- By the age of 16 or 17, 31% of white girls and 56% of black girls report no habitual leisure-time activity.240
- –Lower levels of parental education are associated with greater decline in activity for white girls at both younger and older ages. For black girls, this association is seen only at the older ages.
- –Cigarette smoking is associated with decline in activity among white girls. Pregnancy is associated with decline in activity among black girls but not among white girls.
- –A higher BMI is associated with greater decline in activity among girls of both races.
- –Cigarette smoking is associated with decline in activity among white girls. Pregnancy is associated with decline in activity among black girls but not among white girls.
- –Lower levels of parental education are associated with greater decline in activity for white girls at both younger and older ages. For black girls, this association is seen only at the older ages.
Adults
- 2001–2003 data from the BRFSS study of the CDC showed that among Asians and Native Hawaiians or Other Pacific Islanders, 21.2% of men and 27.0% of women reported no leisure-time PA. Of these, 21.5% were overweight (BMI 25.0–29.9) and 23.8% were obese (BMI 30.0 and over).241
- 2004 data from the BRFSS study of the CDC showed that 77.1% of respondents had participated in any PA in the past month. Of these, the median percentage that were male was 79.2, and 74.8% were female; 79.7% were white, 66.1% were black, and 61.5% were Hispanic (CDC Web site).
- Based on data from the 1999–2001 NHIS survey of the CDC/NCHS242...
- –31.3% of US adults age 18 and older engage in any regular leisure-time PA.
- –Men (64.2 %) were more likely than women (59.0%) to engage in at least some leisure-time PA.
- –Engaging in any PA declined steadily with age from 39.7% of adults ages 18–24 to 15.6% age 75 and older.
- –Engaging in any regular leisure-time PA was more prevalent among white adults (32.7%) than among Asian adults (27.8%) and black adults (23.9%).
- –NH white adults (65.7%) were more likely than NH black adults (49.3%) and Hispanic adults (45.0%) to engage in at least some leisure-time PA.
- –Adults with a graduate degree (80.6%) were about twice as likely as adults with less than a high school diploma (41.0%) to engage in at least some leisure-time PA.
- –Adults who had incomes 4 times the poverty level or more (39.9%) were about twice as likely as adults with incomes below the poverty level (22.6%) to engage in any regular PA.
- –Widowed adults (23.6%) were less likely than never-married adults (33.0%), married adults (31.1%), and divorced or separated adults (29.1%) to engage in regular PA.
- –Adults living in the West (65.3%) were more likely than adults living in the South (56.4%) to engage in at least some leisure-time PA.
- –Men (64.2 %) were more likely than women (59.0%) to engage in at least some leisure-time PA.
- –31.3% of US adults age 18 and older engage in any regular leisure-time PA.
- The relative risk of CHD associated with physical inactivity ranges from 1.5–2.4, an increase in risk comparable to that observed for high blood cholesterol, HBP or cigarette smoking.243
- A study of over 72 000 female nurses indicates that moderate-intensity PA such as walking is associated with a substantial reduction in risk of total and ischemic stroke.98
- The prevalence of physical inactivity during leisure time among Mexican Americans is higher than in the general population.244
- –The prevalence of physical inactivity among those whose main language is English is 15% of men and 28% of women. This is similar to that of the general population (17% of men and 27% of women).
- –Those whose main language is Spanish have the highest prevalence of physical inactivity (38% of men and 58% of women).
- –Those whose main language is Spanish have the highest prevalence of physical inactivity (38% of men and 58% of women).
- –The prevalence of physical inactivity among those whose main language is English is 15% of men and 28% of women. This is similar to that of the general population (17% of men and 27% of women).
- Data from the 1999–2003 NHIS study of the CDC/NCHS showed that American-Indian or Alaska Native (AIAN) adults, age 18 and older, were as likely (50.3%) as black adults (49.9%) and more likely than Asian adults (38.1%) and white adults (36.6%) to never engage in any leisure-time PA.150
Cost
- The annual estimated direct medical cost of physical inactivity in 2000 was $76.6 billion (www.cdc.gov).
| Overweight and Obesity |
|---|
See Table 9F.
|
Prevalence
Youth
- An estimated 9.2 million children and adolescents ages 6–19 are considered overweight or obese, based on the 95th percentile or higher of BMI values in the 2000 CDC growth chart for the United States (NHANES [1999–2002], CDC/NCHS).
- Based on data from NHANES (1999–2002), the prevalence of overweight in children ages 6–11 increased from 4.2% to 15.8% compared with data from 1963–65. The prevalence of overweight in adolescents ages 12–19 increased from 4.6% to 16.1% (CDC/NCHS).
- Over 10% of preschool children ages 2–5 are overweight, up from 7% in 1994.245
- –Among preschool children, the following are overweight: 8.6% of NH whites, 8.8% of NH blacks and 13.1% of Mexican Americans.
- –Among children ages 6–11, the following are overweight: 13.5% of NH whites, 19.8% of NH blacks and 21.8% of Mexican Americans.
- –Among adolescents ages 12–19, the following are overweight: 13.7% of NH whites, 21.1% of NH blacks and 22.5% of Mexican Americans.
- –In addition, the data show that another 31% of children and teens ages 6–19 are considered at risk of becoming overweight (BMI from the 85th–95th percentile).
- –Among children ages 6–11, the following are overweight: 13.5% of NH whites, 19.8% of NH blacks and 21.8% of Mexican Americans.
- –Among preschool children, the following are overweight: 8.6% of NH whites, 8.8% of NH blacks and 13.1% of Mexican Americans.
- 43% of adolescents watch more than 2 hours of television each day. Overweight adolescents have a 70% chance of becoming overweight adults. This increases to 80% if 1 or both parents are overweight or obese (www.surgeongeneral.gov).
- Data from the YRBS 2003 survey showed that the prevalence of being overweight was higher among black (16.2%) and Hispanic (16.4%) than white (10.4%) students; higher among black female (14.2%) and Hispanic female (11.5%) than white female (6.5%) students; and higher among black male (18.2%) and Hispanic male (21.3%) than white male (14.0%) students. The prevalence of being at risk for overweight was higher among black (18.2%) and Hispanic (17.4%) than white (13.3%) students; higher among black female (21.2%) than white female (12.4%) and Hispanic female (15.7%) students; and higher among Hispanic male (19.1%) and black male (15.1%) than white male (14.0%) students.246
- Among all overweight children and teens ages 2–19 (or their parents), 36.7% reported ever having been told by a doctor or healthcare professional that they were overweight. For ages 2–5, 17.4%; for ages 6–11, 32.6%; for ages 12–15, 39.6%; and for ages 16–19, 51.6% were told that they were overweight. Similar trends were seen for males and females. Among racial/ethnic populations, overweight NH black females were significantly more likely to be told that they were overweight than NH white females (47.4% versus 31.0%). Among those informed of overweight status, 39% of NH black females were severely overweight compared with 17% of NH white females.247
Adults
- Analysis of the FHS, 1971–2001, showed the 4-year rates of developing overweight varied from 14–19% in women and 26–30% in men. Four-year rates of developing obesity were from 5–7% in women and 7–9% in men. The 30-year risk was similar for both sexes; with some variation by age. Overall, the 30-year risk exceeded 1 in 2 persons for "overweight or more," 1 in 4 for obesity, and 1 in 10 for stage II obesity (BMI
 30), across different age groups. The 30-year estimates correspond to the lifetime risk for overweight or more or obesity for participants 50 years of age.248
- The age-adjusted prevalence of overweight increased from 55.9% in NHANES III (1988–94) to 65.1% in NHANES (1999–2002). The prevalence of obesity also increased during this period from 22.9% to 30.4%. Extreme obesity (BMI of 40.0 or higher) increased from 2.9% to 4.9%.245
- Since 1993, the prevalence of those who are obese increased over 61%. Among states in 2002, West Virginia had the highest rate of obesity and Colorado had the lowest (www.cdc.gov/brfss).
- Data from the BRFSS study of the CDC showed that in participants ages 18–24, studied from 1990–2000, obesity increased among every ethnic group, especially in black women. Almost 20% of black women were obese by ages 18–24, increasing to over 35% by ages 25–44. Between one-third and one-half of those surveyed ate fewer than 3 servings of fruits and vegetables a day, although older black men and older Hispanic men and women improved dramatically in that regard between 1990 and 2000.23
- Abdominal obesity is an independent risk factor for ischemic stroke in all race/ethnic groups with an odds ratio (OR) about 3 times greater when comparing the first and fourth quartiles. This effect was larger for those under age 65 (OR=4.4) than over age 65 (OR=2.2). (NOMASS).249
- A recent comparison of risk factors in both the HHP and FHS showed a BMI increase of around 3 kg/m2 raised the risk of hospitalized thromboembolic stroke by 10–30%.251
- In 1998–99, surveys of people in 8 states and the District of Columbia by the BRFSS study of the CDC indicated that obesity rates are significantly higher among people with disabilities, especially blacks and those ages 45–64.252
- Data from the FHS showed that overweight and obesity were associated with large decreases in life expectancy. Forty-year-old female nonsmokers lost 3.3 years and 40-year-old male nonsmokers lost 3.1 years of life expectancy because of overweight. In 40-year-old nonsmokers, females lost 7.1 years and males lost 5.8 years due to obesity. Obese female smokers lost 7.2 years and obese male smokers lost 6.7 years when compared to normal-weight nonsmokers.253
- Data from the 1999–2003 NHIS study of the CDC/NCHS showed that American Indian or Alaska Native (AIAN) adults, age 18 and older, were as likely (30.4%) as black adults (30.8%) and less likely than white adults (40.9%) and Asian adults (62.8%) to be at a healthy weight.150
- Data from the 1999–2003 NHIS study of the CDC/NCHS showed that American Indian or Alaska Native (AIAN) women, age 18 and older, were less likely (29.4%) than black women (36.6%) and more likely than white women (20.3%) and Asian women (5.8%) to be obese.150
- According to the WHO, the number of overweight and obese people worldwide is set to increase to 1.5 billion by 2015 if current trends continue. Excessive weight and obesity are major risk factors for CVD, the No. 1 cause of death worldwide, claiming more than 17 million lives a year.254
Mortality
Obesity was associated with nearly 112 000 excess deaths (95% confidence interval [CI], 53 754–170 064) and underweight with nearly 34 000 excess deaths (95% CI, 15 726–51 766).255
Risk Factors
- Among people diagnosed with type 2 diabetes, 67% have a BMI 27 and 46% have a BMI 30. An estimated 70% of diabetes risk in the United States can be attributed to excess weight (win.niddk.nih.gov).
- The age-adjusted prevalence of hypertension in overweight US adults is 22.1% for men with BMI >25 and <27; 27.0% for men with BMI 27 and <30; 27.7% for women with BMI 25 and <27; and 32.7% for women with BMI 27 and <30. In comparison, the prevalence in adults who are obese (BMI 30) is 41.9% for men and 37.8% for women (win.niddk.nih.gov/statistics).
- The age-adjusted prevalence of high blood cholesterol (240 mg/dL) in overweight US adults is 19.1% for men with BMI 25 and <27; 21.6% for men with BMI 27 and <30; 30.5% for women with BMI 25 and <27; and 29.6% for women with BMI 27 and <30. In comparison, the prevalence of high cholesterol in adults who are not overweight (BMI <25) is 13.0% for men and 13.4% for women. The prevalence for adults who are obese (BMI 30) is 22.0% for men and 27.0% for women (win.niddk.nih.gov/statistics).
Cost
- Among children and adolescents, annual hospital costs related to obesity were $127 million during 1997–99. (CDC. "Preventing Obesity and Chronic Diseases Through Good Nutrition and Physical Activity"256)
- The estimated cost of overweight and obesity, in 2001 dollars, is $117 billion. Direct cost is $61 billion and the indirect cost is $56 billion. The direct cost of heart disease related to overweight and obesity, independent of stroke, is $8.8 billion. For type 2 diabetes, it’s $98 billion. For hypertension, it’s $4.1 billion. The cost of lost productivity related to obesity (BMI >30) among Americans ages 17–64 is $3.9 billion (www.win.niddk.nih.gov).
| Diabetes Mellitus |
|---|
(ICD/9 250) (ICD/10 E10–E14). See Table 9G.
|
Prevalence
- The prevalence of diabetes increased by 8.2% from 2000–01. Since 1990, the prevalence of those diagnosed with diabetes increased 61%. In 2001, Alabama had the highest rate of diagnosed diabetes (10.5%) and Minnesota had the lowest (5.0%).257
- From 1994–2002, the age-adjusted prevalence of diabetes increased 54.0% for US adults (from 4.8% to 7.3%), and increased 33.2% (from 11.5% to 15.3%) among American Indian or Alaska Native adults. The overall age-adjusted prevalence for American Indian or Alaska Native adults was more than twice that of US adults overall.258
- Based on data from the NHANES studies of the CDC/NCHS, in 1976–80, total diabetes prevalence in African Americans ages 40–74 was 8.9%; in 1988–94 the rate was 18.2%, a doubling of the rate in just 12 years. In 1988–94, among people ages 40–74, the prevalence rate was 18.2% for African Americans compared to 11.2% for whites.259
- Data from the NHANES (1999–2000) study of the CDC/NCHS showed a disproportionately high prevalence of diabetes in NH blacks and Mexican Americans when compared to NH whites. For previously diagnosed diabetes the percentage was 11.7 for NH blacks and 9.6 for Mexican Americans compared to 4.8 for NH whites. For undiagnosed diabetes the percentages were 3.2, 2.4 and 2.6, respectively. For impaired fasting glucose the percentages were 6.3, 6.7 and 5.7, respectively.260
- BRFSS data in selected areas, 1998–2002, showed that diabetes disproportionately affects Hispanics in the United States and Puerto Rico. Hispanics were twice as likely to have diabetes as NH whites of similar age (9.8% versus 5.0%). This disparity, however, varied by geographic location—it was lowest in Florida and higher in California, Texas, and Puerto Rico. Among Hispanic adults in California, Florida, Illinois, New York/New Jersey, Puerto Rico and Texas, the overall prevalence of diabetes was 7.4%; it ranged from 6.2% in Illinois and New York/New Jersey to 9.3% in Puerto Rico.261
- About 15% of American Indians or Alaska Natives who receive care from the Indian Health Service have been diagnosed with diabetes. On average, American Indians or Alaska Natives are 2.6 times as likely to have diagnosed diabetes as NH whites of the same age (niddk.nih.gov, 2004).
- The prevalence of diabetes for all age groups worldwide was estimated to be 2.8% in 2000 and a projected 4.4% in 2030. The total number of people with diabetes is projected to rise from 171 million in 2000 to 366 million in 2030.262
- Type 2 diabetes may account for 90–95% of all diagnosed cases of diabetes (niddk.nih.gov, 2004).
- In April 2004, the USDHHS announced that about 40% of US adults ages 40–74, or 41 million, currently have pre-diabetes, a condition that raises a person’s risk of developing type 2 diabetes, heart disease and stroke. Many don’t know that they are at risk or that they have pre-diabetes.263
Incidence
- In the United States each year, over 13 000 children are diagnosed with type 1 diabetes. Increasingly, healthcare providers are finding more and more children and teens with type 2 diabetes. Some clinics report that one-third to one-half of all new cases of childhood diabetes are now type 2. African-American, Hispanic or Latino and American Indian children who are obese and have a family history of type 2 diabetes are at especially high risk for this type of diabetes (niddk.nih.gov, 2004).
Mortality
Mortality as an underlying or contributing cause of death—224 100.
- The 2003 overall death rate from diabetes was 25.2. Death rates were 26.8 for white males, 50.5 for black males, 20.0 for white females and 47.3 for black females.
- At least 65% of people with diabetes mellitus die of some form of heart or blood vessel disease.264
- Heart disease death rates among adults with diabetes are 2–4 times higher than the rates for adults without diabetes (diabetes.niddk.nih.gov).
- Death rates for people with diabetes are 27% higher for African Americans compared with whites (niddk.nih.gov, 2004).
Aftermath
- The age-adjusted prevalence of major CVD for women with diabetes is twice that for women without diabetes, and the age-adjusted major CVD hospital discharge rate for women with diabetes is almost 4 times the rate for women without diabetes.265
- A population-based study of over 13 000 men and women in Denmark showed that in people with type 2 diabetes, the RR of first, incident and admission for MI was increased 1.5–4.5-fold in women and 1.5–2-fold in men. The RR of first, incident and admission for stroke was increased 2–6.5-fold in women and 1.5–2-fold in men, with a significant difference between the sexes. In both men and women the RR of death was increased 1.5–2 times.266
- Diabetes increases the risk of stroke, with the RR ranging from 1.8 to almost 6.0.267
- Ischemic stroke patients with diabetes are younger, more likely to be African American and more likely to have hypertension, MI, and high cholesterol than nondiabetic patients. Diabetes increases ischemic stroke incidence at all ages, but this risk is most prominent before age 55 in African Americans and before age 65 in whites.95
- Compared with white women, black women have a 138% higher rate of ambulatory medical care visits for diabetes.268
- Based on data from the CDC Diabetes Surveillance System, 1997–2000:
- –In 2000, the age-standardized prevalence of any self-reported cardiovascular condition among persons with diabetes age 35 and older was 37.5% for white men, 32.2% for white women, 31.4% for black men, 34.0% for black women, 23.9% for Hispanic men and 22.9% for Hispanic women.
- –In 2000, the self-reported prevalence of any cardiovascular condition was 28.8 per 100 diabetic population among persons ages 35–64, 45.7 per 100 diabetic population among persons ages 65–74, and 53.5 per 100 diabetic population among persons age 75 and older.
- –In 2000, among persons with diabetes age 35 and older, 37.2% reported being diagnosed with a cardiovascular condition, (ie, CHD, stroke or other cardiovascular condition).
- –In 2000, among persons with diabetes age 35 and older, the age-standardized prevalence of self-reported CHD, angina or heart attack, was almost 3 times that of self-reported stroke (22.1% versus 8.0%).
- –In 2000, 4.4 million persons age 35 and older with diabetes reported being diagnosed with a cardiovascular condition, 2.9 million were diagnosed with CHD (ie, self-reported CHD, angina or heart attack) and 1.1 million reported being diagnosed with a stroke.
- –Approximately one-third of adults with diabetes received all 5 interventions recommended for comprehensive diabetes care in 2001. The proportion receiving all 5 interventions was lower among blacks compared with whites and among Hispanics compared with NH whites (2004 National Healthcare Disparities Report, AHRQ, USDHHS).
- –The difference in hospital admissions for long-term complications between men and women is highly significant, with women 22% less likely than men to be admitted (2004 National Healthcare Disparities Report, AHRQ, USDHHS).
- –In multivariate models controlling for age, gender, income, education, insurance and residence location, blacks were 38% less likely, and Hispanics were 33% less likely than their respective comparison groups to receive all services in 2001 (2004 National Healthcare Disparities Report, AHRQ, USDHHS).
- –In 2000, the self-reported prevalence of any cardiovascular condition was 28.8 per 100 diabetic population among persons ages 35–64, 45.7 per 100 diabetic population among persons ages 65–74, and 53.5 per 100 diabetic population among persons age 75 and older.
- –In 2000, the age-standardized prevalence of any self-reported cardiovascular condition among persons with diabetes age 35 and older was 37.5% for white men, 32.2% for white women, 31.4% for black men, 34.0% for black women, 23.9% for Hispanic men and 22.9% for Hispanic women.
Risk Factors
- Among US adults with diabetes, data from the NHANES surveys from 1971–74 to 1999–2000 showed that mean total cholesterol declined from 5.95 mmol/liter to 5.48 mmol/liter. The proportion with high cholesterol decreased from 72% to 55%. Mean blood pressure declined from 146/86 mm Hg to 134/72 mm Hg. The proportion with HBP decreased from 64% to 37%, and smoking prevalence decreased from 32% to 17%. Although these trends are encouraging, still 1 of 2 people with diabetes had high cholesterol, 1 of 3 had HBP, and 1 of 6 was a smoker.269
- Data from the National Institute of Diabetes and Digestive and Kidney Diseases (NIDDK) of the NIH stated:
- –Heart disease is the leading cause of diabetes-related death. Adults with diabetes have heart disease death rates about 2–4 times higher than adults without diabetes.
- –The risk for stroke is 2–4 times higher among people with diabetes.
- –About 73% of adults with diabetes have BP greater than or equal to 130/80 mm Hg or use prescription medication for hypertension.
- –An estimated 49–69 million adults in the United States may have insulin resistance (personal communication with Earl Ford, MD, CDC/NCHS, 2003), and 1 in 4 of them will develop type 2 diabetes (ndep.nih.gov).
- –The risk for stroke is 2–4 times higher among people with diabetes.
- –Heart disease is the leading cause of diabetes-related death. Adults with diabetes have heart disease death rates about 2–4 times higher than adults without diabetes.
Cost
In 2002, the direct and indirect cost of diabetes was $132 billion.270
| 10. Metabolic Syndrome |
|---|
Adolescents
The prevalence of metabolic syndrome (MetS) among 12–19-year-old US adolescents was estimated in an analysis of NHANES III data, by applying a modification of the ATP III definition (Third Report of the National Cholesterol Education Program [NCEP] Expert Panel on Detection, Evaluation, and Treatment of High Blood Cholesterol in Adults [ATP III, NHLBI]) for adults. MetS during adolescence was defined as 3 or more of the following abnormalities:
- —Serum triglyceride level of 110 mg/dL or higher.
- —High-density lipoprotein (HDL) cholesterol level of 40 mg/dL or lower.
- —Elevated fasting glucose of 110 mg/dL or higher.
- —Blood pressure at or above the 90th percentile for age, sex and height.
- —Waist circumference at or above the 90th percentile for age and sex (NHANES III data set)
- —High-density lipoprotein (HDL) cholesterol level of 40 mg/dL or lower.
- An estimated 1 million 12–19-year-old adolescents in the United States have MetS, or 4.2% overall (6.1% of males and 2.1% of females).272
- –Of adolescents with MetS, 73.9% were overweight and 25.2% were at risk of overweight.
- –The mean BMI of adolescents with the MetS (30.1%) was just above the 95th percentile of the CDC Growth Chart; thus they are likely to represent a fairly common clinical problem in pediatrics.
- –MetS was present in 28.7% of overweight adolescents (BMI 95th percentile of CDC Growth Chart) compared with 6.8% of at-risk-of-overweight adolescents, and 0.1% of those with BMI below the 85th percentile (P<0.001).
- –Among adolescents with MetS, 40.9% had 1 criterion; 14.2% had 2 criteria; 4.2% had 3 criteria and 0.9% had 4 criteria for MetS. For overweight adolescents, 88.5% had 1 criterion; 54.4% had 2 criteria; 28.7% had 3 criteria and 5.8% had 4 criteria for MetS.
- –The mean BMI of adolescents with the MetS (30.1%) was just above the 95th percentile of the CDC Growth Chart; thus they are likely to represent a fairly common clinical problem in pediatrics.
- –Of adolescents with MetS, 73.9% were overweight and 25.2% were at risk of overweight.
- Among more than 3400 children examined in 1 study, 1 in 10 had MetS.273
- Using a sample of adolescents from NHANES III, the overall prevalence of MetS was 38.7% in moderately obese subjects and 49.7% in severely obese subjects. The prevalence of MetS in severely obese black subjects was 39%.274
Adults
People with MetS are at increased risk for developing diabetes and cardiovascular disease as well as increased mortality from CVD and all causes. Unless otherwise stated, the following data are based on the definition of the metabolic syndrome as determined in the Third Report of the National Cholesterol Education Program (NCEP) Expert Panel on Detection, Evaluation, and Treatment of High Blood Cholesterol in Adults (ATP III, NHLBI).
- An estimated 47 million US residents have MetS.275
- The age-adjusted prevalence of MetS for adults is 23.7%.275
- –The prevalence ranges from 6.7% among people ages 20–29 to 43.5% for ages 60–69 and 42.0% for those age 70 and older.
- –The age-adjusted prevalence is similar for men (24.0%) and women (23.4%).
- –Mexican Americans have the highest age-adjusted prevalence of MetS (31.9%). The lowest prevalence is among whites (23.8%), African Americans (21.6%) and people reporting an "other" race or ethnicity (20.3%).
- –Among African Americans, women had about a 57% higher prevalence than men. Among Mexican Americans, women had a 26% higher prevalence than men did.
- –The age-adjusted prevalence is similar for men (24.0%) and women (23.4%).
- –The prevalence ranges from 6.7% among people ages 20–29 to 43.5% for ages 60–69 and 42.0% for those age 70 and older.
- The prevalences of people with MetS are 24.3%, 13.9% and 20.8 % for white, black and Mexican-American men, respectively. For women the percentages are 22.9, 20.9 and 27.2, respectively.276
- In a study of over 15 000 men and women, ages 45–64, in the ARIC study, MetS prevalence was 30% and 27% using ATP III and modified WHO definitions with substantial variation across race and gender subgroups. CHD prevalence was greater in those with than without MetS (ATP III 7.4% versus 3.6%; WHO 7.8% versus 3.6%, both P<0.0001). Using either definition, subjects with MetS were about 2 times more likely to have prevalent CHD than those without the syndrome after adjustment for established risk factors. Among individuals free of CVD, the average age, sex, and race/center-adjusted intima-media thickness (IMT) was greater among individuals with the syndrome (ATP III 747 versus 704, WHO 750 versus 705 micrometers, both P<0.0001). These data suggest that MetS was significantly associated with the presence of CHD and carotid IMT.277
| 11. Nutrition |
|---|
See Table 11A.
|
- The Economic Research Service of the USDA suggests that the average daily calorie consumption in the United States increased by 12% between 1985 and 2000, or roughly 300 calories. Of that increase, grains (mainly refined grains) accounted for 46%, added fats 24%, added sugars 23%, fruits and vegetables 8%, and the meat and dairy groups together declined 1%. Per capita availability of total dietary fat, after remaining steady from 1985–99, jumped 6% in 2000. American diets tend to be low in whole grains and other nutritious foods.279
- Between 1965 and 1991, among US adults age 18 and older, total daily calories declined from 2049 to 1807, but then rebounded to 2000 calories in 1996. This contributed to the marked increase in obesity levels in the past decade.280
- In 1999–2000, among children ages 2–6, 20% had a good diet, 74% had a diet that needed improvement, and 6% had a poor diet. For those ages 7–12, 8% had a good diet, 79% had a diet that needed improvement, and 13% had a poor diet.281
- Between 1988–94 and 1999–2000, the median caloric intake rose in boys ages 8–11 and 12–19. It rose a small amount in girls ages 6–11 and basically remained constant in girls ages 12–19.282
- Between 1977 and 1996, portion sizes for key food groups grew markedly in the United States, not only at fast-food outlets but also in homes and at conventional restaurants. One study of portion sizes for typical items showed that:
- –Salty snacks increased from 132 calories to 225 calories.
- –Soft drinks increased from 144 calories to 193 calories.
- –French fries increased from 188 calories to 256 calories.
- –Hamburgers increased from 389 calories to 486 calories.283
- –Soft drinks increased from 144 calories to 193 calories.
- –Salty snacks increased from 132 calories to 225 calories.
Fat/Meat Consumption
- Between 1965 and 1996 among adults, total fat as a proportion of daily calorie intake fell steadily from 39.1% to 33.1%. Saturated fat fell from 14.4% to 11.0%. However, total calorie intake increased between 1991 and 1996. Over the same period daily total fat consumption rose from 70.9 grams (g) to 74.8 g.280
- The average daily intake of total fat in the United States is 81.4 grams (96.5 g for males and 67.3 g for females) (NHANES III [1988–94], CDC/NCHS).
- –For NH whites the average is 82.7 g (99.0 g for males and 67.4 g for females).
- –For NH blacks the average is 82.0 g (94.6 g for males and 71.2 g for females).
- –For Mexican Americans the average is 77.6 g (88.0 g for males and 66.5 g for females).
- –For NH blacks the average is 82.0 g (94.6 g for males and 71.2 g for females).
- –For NH whites the average is 82.7 g (99.0 g for males and 67.4 g for females).
- The average daily intake of saturated fat in the United States is 27.9 g (33.1 g for males and 23.0 g for females) (NHANES III [1988–94], CDC/NCHS).
- –For NH whites the average is 28.4 g (34.1 g for males and 23.1 g for females).
- –For NH blacks the average is 27.5 g (31.7 g for males and 23.8 g for females).
- –For Mexican Americans the average is 26.7 g (30.1 g for males and 23.1 g for females).
- –For NH blacks the average is 27.5 g (31.7 g for males and 23.8 g for females).
- –For NH whites the average is 28.4 g (34.1 g for males and 23.1 g for females).
- The proportion of fat calories from beef, pork, dairy products and eggs fell from 50% in 1965 to 33% in 1994–96. The proportion of fat calories from poultry increased from 4% to 7%. Calories from fruits and vegetables rose from 8% to 13%.280
- In 1994–96, pizza, Mexican food, Chinese food, hamburgers, French fries and cheeseburgers accounted for 10.8% of total fat intake. These 6 foods accounted for only 1.9% of fat intake in 1965.280
- The major sources of saturated fat in the diet are red meat, butter, whole milk and eggs. Intake of these foods has fallen markedly since 1965. The decline in whole milk consumption from 21.3 gallons in 1972–76 to 8.2 gallons in 1997 accounts for most of the reduction in saturated fat.280
- According to USDA data, in 2001 total meat consumption (red meat, poultry and fish) amounted to 194 pounds per person, 16 pounds above the level in 1970. Each American consumed an average of 21 pounds less red meat (mostly beef) than in 1970, 34 pounds more poultry and 3.4 pounds more fish.279
Cholesterol
- The average daily intake of dietary cholesterol in the United States is 269.6 milligrams (mg). For males it’s 323.5 mg and for females it’s 218.9 mg (NHANES III [1988–94], CDC/NCHS).
- –For NH whites the average is 259.3 mg (312.6 mg for males and 209.1 mg for females).
- –For NH blacks the average is 297.9 mg (358.8 mg for males and 245.6 mg for females).
- –For Mexican Americans the average is 316.2 mg (365.9 mg for males and 263.8 mg for females).
- –For NH blacks the average is 297.9 mg (358.8 mg for males and 245.6 mg for females).
- –For NH whites the average is 259.3 mg (312.6 mg for males and 209.1 mg for females).
Fiber
- The recommended daily intake of dietary fiber is 25 g or more. Americans consume a daily average of 15.6 g of dietary fiber (17.8 g for males and 13.6 g for females) (NHANES III [1988–94], CDC/NCHS).
- –For NH whites the average is 15.8 g (18.1 g for males and 13.7 g for females).
- –For NH blacks the average is 13.4 g (15.0 g for males and 12.0 g for females).
- –For Mexican Americans the average is 18.5 g (21.0 g for males and 15.9 g for females).
- –For NH blacks the average is 13.4 g (15.0 g for males and 12.0 g for females).
- –For NH whites the average is 15.8 g (18.1 g for males and 13.7 g for females).
- Analysis of participants in the Cardiovascular Health Study (CHS) showed that cereal fiber consumption late in life was associated with lower risk of incident CVD, supporting recommendations for elderly people to increase consumption of dietary cereal fiber.284
- Despite USDA Food Pyramid recommendations to consume several daily servings of whole grains, in 1994–96, intake of whole grains for children was 1 serving or less.285
- Most Americans consume less than 1 serving of whole grains a day, but between the early 1980s and 2000, consumption of refined grains increased. (Refined grains include white, whole wheat and durum flour, all of which have less nutritional value than whole grains).282
Fruits/Vegetables
- In 2000, 81% of men and 73% of women reported eating fewer than 5 servings of fruits and vegetables a day. More than 60% of young people eat too much fat, and less than 20% eat the recommended 5 or more servings of fruits and vegetables each day (CDC, BRFSS, 2000).
- Only 22.7% of adults consumed fruits and vegetables at least 5 times a day in 1996. This was an increase from 19.0% in 1990 (BRFSS [1990–96], CDC).
- The highest proportion of adults who consumed fruits and vegetables at least 5 times a day were those age 65 and older, whites, college graduates, those actively engaged in leisure-time physical activity, and nonsmokers.280
- The percentage of males who consumed fruits and vegetables at least 5 times a day was 17.7 in 2003. For females the percentage was 27.0 (BRFSS 2003, CDC).
- From 1990–96, the percentage of obese adults who consumed at least 5 servings of fruits and vegetables a day dropped from 16.8% to 15.4%.280
- Recent studies support the intake of up to 9 servings of fruits and vegetables per day.286
- In 2003, the percentage of students in grades 9–12 who reported eating fruits and vegetables 5 or more times per day was 23.6% for males and 20.3% for females.287
- –Black students (24.5%) were more likely than white students (20.2%) to have eaten 5 or more servings per day. This racial/ethnic difference was significantly higher for male students.
- –Black students (24.5%) were more likely than white students (20.2%) to have eaten 5 or more servings per day. This racial/ethnic difference was significantly higher for male students.
- From 1994–96 for children ages 6–19, only 14% met then-current USDA Food Pyramid recommendations for daily fruit intake (2–4 servings per day). Only 20% got enough vegetables (3–5 servings per day).288
- In 1980, about 50% of high school seniors reported eating green vegetables "nearly every day or more." By 2003, that figure had dropped to about 30%.289
Costs
Each year over $33 billion in medical costs and $9 billion in lost productivity due to heart disease, cancer, stroke and diabetes are attributed to diet (CDC).
| 12. Quality of Care |
|---|
The Institute of Medicine defines quality of care as "the degree to which health services for individuals and populations increase the likelihood of desired health outcomes and are consistent with current professional knowledge."290
This section of the Update highlights national data on quality of care for several cardiovascular conditions. It is intended to serve as a benchmark for current care and to stimulate efforts to improve the quality of cardiovascular care nationally. Where possible, data is reported from standardized quality indicators (ie, those consistent with the methods for quality performance measures endorsed by the American College of Cardiology and American Heart Association291 Additional data on aspects of quality of care such as compliance with ACC/AHA clinical practice guidelines is also included to provide a spectrum of quality-of-care data.
Other
- Nearly 3800 patient medical records from 38 US hospitals showed that among patients with AF and at high risk for stroke, only 54.7% received warfarin sodium, and 20.6% received neither aspirin nor warfarin. Of patients with AMI, only 75.5% received aspirin on hospital arrival. After orthopedic surgery procedures, only 85.6% received prophylaxis with a parenteral anticoagulant agent or warfarin. In 49.4% of patients with DVT, PE, or both, unfractionated or low-molecular-weight heparin use was discontinued before an international normalized ratio of 2.0 or greater was achieved for 2 consecutive days. Patients with DVT or PE were rarely discharged from the hospital with bridge therapy (an injectable anticoagulant agent plus warfarin), although the length of hospitalization was significantly shorter than if discharged taking warfarin alone.294
- During the 7-year study period of data from all managed care plans administered by Medicare, clinical performance improved on all measures for both white and black enrollees. However, racial disparities did not decrease for glucose control among patients with diabetes or for cholesterol control among patients with cardiovascular disorders.295
- Using Medicare data from 1992–2001, the rates of receipt for 9 surgical procedures previously shown to have disparities in the rates at which they were performed in white and black patients, was examined. The rates of receipt for all 9 procedures were higher among whites than blacks. The difference between the rates among whites and blacks increased significantly between 1992 and 2001 for 5 of the 9 procedures, remained unchanged for 3 procedures, and narrowed significantly for 1 procedure. Rates of CABG, carotid endarterectomy and total hip replacement in 158 hospital-referral regions were examined. In the early 1990s, whites had higher rates for these procedures than blacks in every hospital-referral region. By 2001, the disparity in the rates of these procedures narrowed significantly in 22 hospital-referral regions, widened significantly in 42, and was not significantly changed in the remaining regions. At the end of the study period, no hospital-referral region was found in which the difference in rates between whites and blacks was eliminated for men or women with regard to any of those 3 procedures.296
- Using data from 1994–2002 from the National Registry of Myocardial Infarction (NRMI), sex and racial differences in the treatment of patients deemed to be "ideal candidates" for particular treatments, and differences in deaths among 598 911 patients hospitalized with MI were examined. It was found that rates of reperfusion therapy, coronary angiography, and in-hospital death after MI, but not the use of aspirin and beta-blockers, vary according to race and sex, with no evidence that the differences have narrowed in recent years.297
Care Centers/Personnel
- Based on data from the American Board of Psychiatry and Neurology (ABPN), there are 240 board-certified vascular neurologists (August 2005).
- In 2002, there were 16 989 doctors of medicine with a specialty of cardiovascular diseases (Health, United States, 2004. CDC/NCHS).
- As of Sept. 28, 2005, there were 175 total certified primary stroke centers by JCAHO standards.
| 13. Medical Procedures |
|---|
Cardiac Catheterization
- From 1979–2003, the total number of inpatient cardiovascular operations and procedures increased 470%.
- From 1979–2003, the number of cardiac catheterizations increased 373%.
- An estimated 1 414 000 inpatient cardiac catheterizations were performed in 2003.
- The mean charge for patients hospitalized for diagnostic cardiac catheterization increased from $11 611 in 1993 to $24 893 in 2003. The total number of patients increased from 628 962 to 728 786, while the average length of stay decreased from 4.9 days to 3.7 days.298
Coronary Artery Bypass Surgery
In the United States in 2003, the NCHS estimates that 467 000 of these procedures were performed on 268 000 patients.
- Compared with Canadian patients, US patients were older, more likely to be female, and discharged from the hospital sooner. In-hospital costs of treatment were substantially higher in the United States than in Canada. After controlling for demographic and clinical differences, length of stay in Canada was 16.8% longer than in the United States; there was no difference in in-hospital mortality; and the cost in the United States was 82.5% higher than in Canada.299
Heart Transplants
In 2004, 2016 heart transplants were performed in the United States. There are 309 organ transplant centers in the United States, 186 of which perform heart transplants.
- In the United States, 72.6% of heart transplant patients are male, 70.4% are white, 20.0% are ages 35–49, and 46.1% are ages 50–64.
- As of July 15, 2005, the 1-year survival rate for males was 86.4% and for females it was 84.6%; the 3-year rate was 78.9% for males and 76.1% for females, and the 5-year rate was 72.2% for males and 68.5% for females.
- As of July 15, 2005, there were 3142 heart patients on the transplant waiting list.
Percutaneous Coronary Intervention (PCI, previously referred to as PTCA)
- An estimated 664 000 PCI procedures were performed on 652 000 patients in 2003 in the United States. From 1987–2003, the number of procedures increased 326%.
- In 2003, 65% of PCI procedures were performed on men, and 52% were performed on people age 65 and older.
- The rate of coronary stent insertion increased 147% between 1996 and 2000. Among the elderly, this procedure increased 168% during the same period. The rate of stent insertion also more than doubled for the population 45–64 years of age, increasing from 157 to 318 per 100 000.300
- In 2003, approximately 84% of 660 000 hospitalized patients who underwent a coronary angioplasty received a stent. Black and white patients were equally likely to receive a stent. However, white patients were more likely than black patients to receive a drug-eluting stent.301
| 14. Economic Cost of Cardiovascular Diseases |
|---|
The cost of cardiovascular diseases and stroke in the United States for 2006 is estimated at $403.1 billion. This figure includes health expenditures (direct costs, which include the cost of physicians and other professionals, hospital and nursing home services, the cost of medications, home health care and other medical durables) and lost productivity resulting from morbidity and mortality (indirect costs). By comparison, in 2004 the estimated cost of all cancers was $190 billion ($69 billion in direct costs, $17 billion in morbidity indirect costs and $104 billion in mortality indirect costs). In 1999, the estimated cost of HIV infections was $28.9 billion ($13.4 billion direct and $15.5 billion indirect).
See Chart 14A and Table 14A.302–305
|
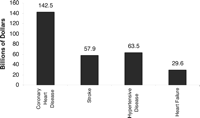
|
| 15. At-a-Glance Summary Tables |
|---|
See Tables 15A through 15D
|
|
|
|
| 16. Glossary |
|---|
- Age-Adjusted Rates—Used mainly to compare the rates of two or more communities, population groups or the nation as a whole, over time. The American Heart Association uses a standard population (2000), so that these rates aren’t affected by changes or differences in the age composition of the population.
- AHRQ—Agency for Healthcare Research and Quality—A part of the US Department of Health and Human Services, this is the lead agency charged with supporting research designed to improve the quality of healthcare, reduce its cost, improve patient safety, decrease medical errors, and broaden access to essential services. AHRQ sponsors and conducts research that provides evidence-based information on healthcare outcomes; quality; and cost, use, and access. The information helps healthcare decisionmakers—patients and clinicians, health system leaders, and policymakers—make more informed decisions and improve the quality of healthcare services.
- Bacterial Endocarditis—An infection of the heart’s inner lining (endocardium) or the heart valves. The bacteria that most often cause endocarditis are streptococci, staphylococci, and enterococci.
- Body Mass Index (BMI)—A mathematical formula to assess body weight relative to height. The measure correlates highly with body fat. Calculated as weight in kilograms divided by the square of the height in meters (kg/m2).
- Centers for Disease Control and Prevention/National Center for Health Statistics (CDC/NCHS)—An agency within the US Department of Health and Human Services (USDHHS). The CDC conducts the:
- –Behavioral Risk Factor Surveillance System (BRFSS), an ongoing study.
- –Behavioral Risk Factor Surveillance System (BRFSS), an ongoing study.
- The NCHS conducted the:
- –National Ambulatory Medical Care Survey (NAMCS).
- –National Health Examination Survey (NHES).
- –National Health and Nutrition Examination Survey I (NHANES I, 1971–74).
- –National Health and Nutrition Examination Survey II (NHANES II,1976–80).
- –National Health and Nutrition Examination Survey III (NHANES III, 1988–94). Prevalence estimates for coronary heart disease, stroke and congestive heart failure are based on the self-reported questionnaire portion of this study. Exam-based estimates are being developed.
- –National Health and Nutrition Examination Survey (NHANES, 1999–2002).
- –National Health Examination Survey (NHES).
- –National Ambulatory Medical Care Survey (NAMCS).
- The NCHS also conducts these ongoing studies (among others):
- –National Health Interview Survey (NHIS)
- –National Hospital Ambulatory Medical Care Survey
- –National Home and Hospice Care Survey
- –National Hospital Discharge Survey
- –National Hospital Ambulatory Medical Care Survey
- –National Health Interview Survey (NHIS)
- Centers for Medicare and Medicaid Services (CMS), formerly Health Care Financing Administration (HCFA)—The federal agency that administers the Medicare, Medicaid and Child Health Insurance Programs, which provide health insurance for more than 74 million Americans.
- Comparability Ratio—Provided by the NCHS to allow time-trend analysis from one ICD revision to another. It compensates for the "shifting" of deaths from one causal code number to another. Its application to mortality based on one ICD revision means that mortality is "comparability-modified" to be more comparable to mortality coded to the other ICD revision.
- Coronary Heart Disease (ICD/10 codes I20–I25)—This category includes acute myocardial infarction (I21–I22); other acute ischemic (coronary) heart disease (I24); angina pectoris (I20); atherosclerotic cardiovascular disease (I25.0); and all other forms of chronic ischemic heart disease (I25.1–I25.9).
- Death Rate—The relative frequency with which death occurs within some specified interval of time in a population. National death rates are computed per 100 000 population. Dividing the mortality by the population gives a crude death rate. It’s restricted because it doesn’t reflect a population’s composition with respect to such characteristics as age, sex, race or ethnicity. Thus rates calculated within specific subgroups, such as age-specific or sex-specific rates, are often more meaningful and informative. They allow well-defined subgroups of the total population to be examined.
- Diseases of the Circulatory System—ICD codes (I00–I99); included as part of what the American Heart Association calls "Cardiovascular Disease." Mortality data for states can be obtained from cdc.gov/nchs, by direct communication with the CDC/NCHS, or from our National Center Biostatistics Program Coordinator on request. (See "Total Cardiovascular Disease" in this Glossary.)
- Diseases of the Heart—Classification the NCHS uses in compiling the leading causes of death. Includes acute rheumatic fever/chronic rheumatic heart diseases (I00–I09); hypertensive heart disease (I11) and hypertensive heart and renal disease (I13); coronary heart disease (I20–I25); pulmonary heart disease and diseases of pulmonary circulation (I26–I28); heart failure (I50); and other forms of heart disease (I29–I49, I50.1–I51). "Diseases of the Heart" is not equivalent to "Total Cardiovascular Disease," which the American Heart Association prefers to use to describe the leading causes of death. "Diseases of the Heart" represents about three-fourths of "Total Cardiovascular Disease" mortality.
- Health Care Financing Administration (HCFA)—See Centers for Medicare and Medicaid Services (CMS).
- Hispanic Origin—In US government statistics, "Hispanic" includes persons who trace their ancestry to Mexico, Puerto Rico, Cuba, Spain, the Spanish-speaking countries of Central or South America, the Dominican Republic or other Spanish cultures, regardless of race. It doesn’t include people from Brazil, Guyana, Suriname, Trinidad, Belize and Portugal because Spanish is not the first language in those countries. Much of our data are for Mexican Americans or Mexicans, as reported by government agencies or specific studies. In many cases, data for all Hispanics are more difficult to obtain.
- Hospital Discharges—The number of inpatients discharged from short-stay hospitals where some type of disease was the first listed diagnosis. Discharges include people discharged alive and dead.
- ICD Codes—A classification system in standard use in the United States. The "International Classification of Diseases" (ICD) is published by the World Health Organization. This system is reviewed and revised about every 10 to 20 years to ensure its continued flexibility and feasibility. The tenth revision (ICD/10) began with the release of 1999 final mortality data. The ICD revisions can cause considerable change in the number of deaths reported for a given disease. The NCHS provides "comparability ratios" to compensate for the "shifting" of deaths from one ICD code to another. In this update the reported mortality is used for one year’s data. To compare the number or rate of deaths with that of an earlier year, the "comparability-modified" number or rate is used.
- Incidence—An estimate of the number of new cases of a disease that develop in a population in a one-year period. For some statistics, new and recurrent attacks or cases are combined. The incidence of a specific disease is estimated by multiplying the incidence rates reported in community- or hospital-based studies by the US population. The rates change only when new data are available; they are not computed annually.
- Major Cardiovascular Diseases—Disease classification commonly reported by the NCHS; represents ICD codes I00–I78. The American Heart Association doesn’t use "Major CVD" for any calculations. See "Total Cardiovascular Disease" in this Glossary.
- Metabolic Syndrome*—The metabolic syndrome is defined as having any 3 of the following 5 diagnostic measures: elevated waist circumference (102 cm. in men or 88 cm. in women); elevated triglycerides (150 mg/dL [1.7 mmol/L] or drug treatment for elevated triglycerides); reduced HDL (high density lipoprotein) cholesterol (<40 mg/dL [0.9 mmol/L] in men or <50 mg/dL [1.1 mmol/L] in women or drug treatment for reduced HDL cholesterol); elevated blood pressure (130 mm Hg systolic blood pressure or 85 mm Hg diastolic blood pressure or drug treatment for hypertension); elevated fasting glucose (100 mg/dL or drug treatment for elevated glucose). *According to criteria established by the American Heart Association/National Heart, Lung, and Blood Institute, in "Diagnosis and Management of the Metabolic Syndrome: An American Heart Association/National Heart, Lung, and Blood Institute Scientific Statement," published in Circulation. (2005, Vol. 112, pages 2735-2752)
- Morbidity—Incidence and prevalence rates are both measures of morbidity, that is, measures of various effects of disease on a population.
- Mortality—The total number of deaths from a given disease in a population during a specific interval of time, usually a year. These data are compiled from death certificates and sent by state health agencies to the NCHS. The process of verifying and tabulating the data takes about two years. For example, 2002 mortality statistics, the latest available, didn’t become available until late 2004. Mortality is "hard" data, so it’s possible to do time-trend analysis and compute % changes over time.
- National Heart, Lung, and Blood Institute (NHLBI)—An institute in the National Institutes of Health in the US Department of Health and Human Services. The NHLBI conducts such studies as the:
- –Framingham Heart Study (FHS) (1948 to date).
- –Honolulu Heart Program (HHP) (1965–97).
- –Cardiovascular Health Study (CHS) (1988 to date).
- –Atherosclerosis Risk in Communities (ARIC) study (1985 to date).
- –Strong Heart Study (SHS) (1989–92; 1991–98).
- –Honolulu Heart Program (HHP) (1965–97).
- –Framingham Heart Study (FHS) (1948 to date).
- The NHLBI also publishes: The reports of the Joint National Committee on Prevention, Detection, Evaluation and Treatment of High Blood Pressure. JNC 7 is the most recent. The report of the National Cholesterol Education Program, Third Report of the Expert Panel on Detection, Evaluation, and Treatment of High Blood Cholesterol in Adults (Adult Treatment Panel III, or ATP III).
- National Institute of Neurological Disorders and Stroke (NINDS)—An institute in the National Institutes of Health in the US Department of Health and Human Services. The NINDS sponsors and conducts research studies such as these:
- –Greater Cincinnati/Northern Kentucky Stroke Study (GCNKSS)
- –Rochester (Minnesota) Stroke Epidemiology Project
- –Northern Manhattan Stroke Study (NOMASS)
- –Brain Attack Surveillance in Corpus Christi (BASIC) Project
- –Rochester (Minnesota) Stroke Epidemiology Project
- –Greater Cincinnati/Northern Kentucky Stroke Study (GCNKSS)
- Prevalence—An estimate of the total number of cases of a disease existing in a population at a specific point in time. Prevalence is sometimes expressed as a percentage of population. Rates for specific diseases are calculated from periodic health examination surveys that government agencies conduct. Annual changes in prevalence as reported in this booklet only reflect changes in the population; rates do not change until there’s a new survey.
- NOTE: In the data tables which precede the different disease and risk factor categories, if the percentages shown are age-adjusted, they will not add to the total.
- Race and Hispanic Origin—Race and Hispanic origin are reported separately on death certificates. In this publication, unless otherwise specified, deaths of Hispanic origin are included in the totals for whites, blacks, American Indians or Alaska Natives and Asian or Pacific Islanders, according to the race listed on the decedent’s death certificate. Data for Hispanic persons include all persons of Hispanic origin of any race. See "Hispanic Origin" in this Glossary.
- Stroke (ICD/10 codes I60–I69)—This category includes subarachnoid hemorrhage (I60); intracerebral hemorrhage (I61); other nontraumatic intracranial hemorrhage (I62); cerebral infarction (I63); stroke, not specified as hemorrhage or infarction (I64); occlusion and stenosis of precerebral arteries, not resulting in cerebral infarction (I65); occlusion and stenosis of cerebral arteries, not resulting in cerebral infarction (I66); other cerebrovascular diseases (I67); cerebrovascular disorders in diseases classified elsewhere (I68) and sequalae of cerebrovascular disease (I69).
- Total Cardiovascular Disease (ICD/10 codes I00–I99, Q20–Q28)—This category includes rheumatic fever/rheumatic heart disease (I00–I09); hypertensive diseases (I10–I15); ischemic (coronary) heart disease (I20–I25); pulmonary heart disease and diseases of pulmonary circulation (I26–I28); other forms of heart disease (I30–I52); cerebrovascular disease (stroke) (I60–I69); atherosclerosis (I70); other diseases of arteries, arterioles and capillaries (I71–I79); diseases of veins, lymphatics and lymph nodes, not classified elsewhere (I80–I89); and other and unspecified disorders of the circulatory system (I95–I99). When data are available, we include congenital cardiovascular defects (Q20–Q28).
| Abbreviation Guide |
|---|
ACE—angiotensin-converting enzyme
ACS—acute coronary syndrome
ADHERE—Acute Decompensated HEart Failure National REgistry
AED—automated external defibrillator
AF—atrial fibrillation
AHA—American Heart Association
AHRQ—Agency for Healthcare Research and Quality
AIDS—acquired immune deficiency syndrome
AJC—American Journal of Cardiology
AP—angina pectoris
ARIC—Atherosclerosis Risk in Communities
ATP—Adult Treatment Panel
BMI—body mass index
BP—blood pressure
BRFSS—Behavioral Risk Factor Surveillance System
BWIS—Baltimore-Washington Infant Study
CAD—coronary artery disease
CDC—Centers for Disease Control and Prevention
CHD—coronary heart disease
HF—heart failure
CHS—Cardiovascular Health Study
CMS—Centers for Medicare and Medicaid Services
COPD—Chronic obstructive pulmonary disease
CPI—Consumer Price Index
CPR—cardiopulmonary resuscitation
CVD—cardiovascular disease
DVT—deep vein thrombosis
ED—emergency department
EMS—emergency medical services
ER—emergency room
ESRD—end-stage renal disease
FHS—Framingham Heart Study
GCNKSS—Greater Cincinnati/Northern Kentucky Stroke Study
GWTG—Get With The GuidelinesSM
HBP—high blood pressure
HCFA—Health Care Financing Administration
HCUP—Healthcare Cost and Utilization Project
HDL—high-density lipoprotein
HHP—Honolulu Heart Program
HIV—human immunodeficiency virus
ICD—International Classification of Diseases
ICDA—International Classification of Diseases, Adapted
ICH—intracerebral hemorrhage
JACC—Journal of the American College of Cardiology
JAMA—Journal of the American Medical Association
JCAHO—Joint Commission on Accreditation of Health Care Organizations
JNC—Joint National Committee on Prevention, Detection, Evaluation and Treatment of High Blood Pressure
kcal—kilocalories
LDL—low-density lipoprotein
LV—left ventricular
LVEF—left ventricular ejection fraction
MACDP—Metropolitan Atlanta Congenital Defects Program
MetS—metabolic syndrome
mg/dL—milligrams per deciliter
MI—myocardial infarction
mm Hg—millimeters of mercury
MMWR—Morbidity and Mortality Weekly Report
NCEP—National Cholesterol Education Program
NCHS—National Center for Health Statistics
NCQA—National Committee for Quality Assurance
NEJM—New England Journal of Medicine
NHANES—National Health and Nutrition Examination Survey
NHES—National Health Examination Survey
NHIS—National Health Interview Survey
NHLBI—National Heart, Lung, and Blood Institute
NIDDK—National Institute of Diabetes and Digestive and Kidney Diseases
NIHSS—National Institutes of Health Stroke Scale
NINDS—National Institute of Neurological Disorders and Stroke
NOMASS—Northern Manhattan Stroke Study
NRMI—National Registry of Myocardial Infarction
NVSS—National Vital Statistics System
OR—odds ratio
PA—physical activity
PAD—peripheral arterial disease
PTCA—percutaneous transluminal coronary angioplasty
PE—pulmonary embolism
PTE—pulmonary thromboembolism
PVD—peripheral vascular disease
RF—rheumatic fever
RHD—rheumatic heart disease
RR—relative risk
SAH—subarachnoid hemorrhage
SCD—sudden cardiac death
SES—socioeconomic status
SHS—Strong Heart Study
STEMI—ST elevation myocardial infarction
TIA—transient ischemic attack
UA—unstable angina
UNOS—United Network for Organ Sharing
USDA—United States Department of Agriculture
USDHHS—United States Department of Health and Human Services
VF—ventricular fibrillation
VSD—ventricular septal defect
VTE—venous thromboembolism
WHO—World Health Organization
YLL—years of life lost
YMCLS—Youth Media Campaign Longitudinal Study
YRBS—Youth Risk Behavior Surveillance![]()
![]()
![]()
![]()
![]()
![]()
![]()
![]()
![]()
![]()
![]()
![]()
![]()
![]()
![]()
![]()
![]()
![]()
![]()
![]()
![]()
![]()
![]()
![]()
![]()
![]()
![]()
![]()
![]()
![]()
![]()
![]()
![]()
![]()
![]()
![]()
![]()
![]()
![]()
![]()
![]()
![]()
![]()
![]()
![]()
![]()
![]()
![]()
![]()
![]()
![]()
![]()
![]()
![]()
![]()
![]()
![]()
![]()
![]()
![]()
![]()
![]()
![]()
![]()
|

|
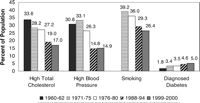
|

|

|
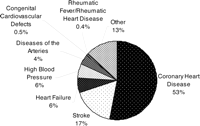
|

|

|
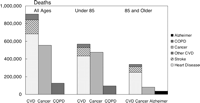
|

|

|
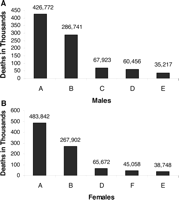
|
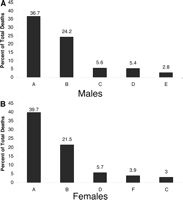
|

|
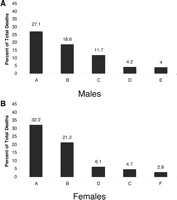
|
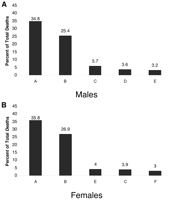
|

|

|
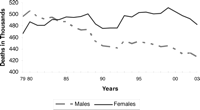
|

|

|
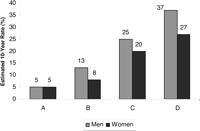
|

|

|

|

|

|

|

|

|

|

|

|

|

|

|
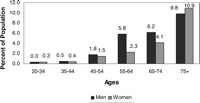
|

|

|

|

|

|

|

|

|

|
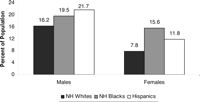
|

|

|
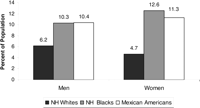
|

|

|
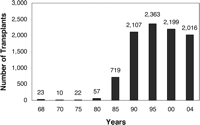
|
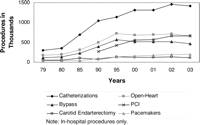
|
|
|
|
|
|
|
|
|
|
|
|
|
| Acknowledgments |
|---|
We wish to thank Drs. Joseph Broderick, Hong Chang, Michael Criqui, Brian Eigel, Gregg Fonarow, Mary Fran Hazinski, Kathy Jenkins, Alice Liechtenstein, Mary McDermott, Graham Nicole, Jerry Potts, Kathryn Taubert, and Christine Williams for their valuable comments and contributions. We would like to acknowledge Tim Anderson and Tom Schneider for their editorial assistance.
|
| Footnotes |
|---|
*The findings and conclusions in this report are those of the authors and do not necessarily represent the views of the Centers for Disease Control and Prevention.
**In addition to these writing group members. ![]()
The American Heart Association makes every effort to avoid any actual or potential conflicts of interest that may arise as a result of an outside relationship or a personal, professional, or business interest of a member of the writing panel. Specifically, all members of the writing group are required to complete and submit a Disclosure Questionnaire showing all such relationships that might be perceived as real or potential conflicts of interest.
A single reprint is available by calling 800-242-8721 (US only) or writing the American Heart Association, Public Information, 7272 Greenville Ave, Dallas, TX 75231-4596. Ask for reprint No. 71-0354. To purchase additional reprints: up to 999 copies, call 800-611-6083 (US only) or fax 413-665-2671; 1000 or more copies, call 410-528-4121, fax 410-528-4264, or e-mail kramsay@lww.com. To make photocopies for personal or educational use, call the Copyright Clearance Center, 978-750-8400.
| 18. References |
|---|
- CDC/NCHS, Vital Health Stat 10. July 2005; No. 225.
- Hurst W. The Heart, Arteries and Veins. 10th ed. New York, NY: McGraw-Hill; 2002.
- Strong Heart Study Data Book. Washington, DC: NIH, NHLBI; 2001.
- U.S. Decennial Life Tables for 1989–91, Volume 1, No. 4. September 1999.
- Centers for Disease Control and Prevention (CDC). Disparities in premature deaths from heart disease: 50 states and the District of Columbia, 2001. MMWR Morb Mortal Wkly Rep. 2004; 53: 121–125.[Medline]
[Order article via Infotrieve]
- Healthy People 2000. Atlanta, Ga: CDC/NCHS, Jan. 2002. Statistical Notes No. 23.
- Jacobs I, Nadkarni V, Bahr J, Berg RA, Billi JE, Bossaert L, Cassan P, Coovadia A, D’Este K, Finn J, Halperin H, Handley A, Herlitz J, Hickey R, Idris A, Kloeck W, Larkin GL, Mancini ME, Mason P, Mears G, Monsieurs K, Montgomery W, Morley P, Nichol G, Nolan J, Okada K, Perlman J, Shuster M, Steen PA, Sterz F, Tibballs J, Timerman S, Truitt T, Zideman D; International Liaison Committee on Resuscitation; American Heart Association; European Resuscitation Council; Australian Resuscitation Council; New Zealand Resuscitation Council; Heart and Stroke Foundation of Canada; InterAmerican Heart Foundation; Resuscitation Councils of Southern Africa; ILCOR Task Force on Cardiac Arrest and Cardiopulmonary Resuscitation Outcomes. Cardiac arrest and cardiopulmonary resuscitation outcome reports: update and simplification of the Utstein templates for resuscitation registries: a statement for healthcare professionals from a task force of the International Liaison Committee on Resuscitation (American Heart Association, European Resuscitation Council, Australian Resuscitation Council, New Zealand Resuscitation Council, Heart and Stroke Foundation of Canada, InterAmerican Heart Foundation, Resuscitation Councils of Southern Africa). Circulation. 2004; 110: 3385–3397.
[Abstract/Free Full Text] - Fox CS, Evans JC, Larson MG, Lloyd-Jones DM, O’Donnell CJ, Sorlie PD, Manolio TA, Kannel WB, Levy D. A comparison of death certificate out-of-hospital coronary heart disease death with physician-adjudicated sudden cardiac death. Am J Cardiol. 2005; 95: 856–859.[CrossRef][Medline]
[Order article via Infotrieve]
- Zheng ZJ, Croft JB, Giles WH, Mensah GA. Sudden cardiac death in the United States, 1989 to 1998. Circulation. 2001; 104: 2158–2163.
[Abstract/Free Full Text] - Vaillancourt C, Stiell IG, for the Canadian Cardiac Outcomes Research Team. Cardiac arrest care and emergency medical services in Canada. Can J Cardiol. 2004; 20: 1081–1090.[Medline]
[Order article via Infotrieve]
- Rea TD, Eisenberg MS, Sinibaldi G, White RD. Incidence of EMS-treated out-of-hospital cardiac arrest in the United States. Resuscitation. 2004; 63: 17–24.[CrossRef][Medline]
[Order article via Infotrieve]
- Monthly Postcensal Resident Population (8/1/2005): U.S. Census data. Available at: http://www.census.gov. Accessed October 19 2005.
- Myerburg RJ, Kessler KM, Castellanos A. Sudden cardiac death: epidemiology, transient risk, and intervention assessment. Ann Intern Med. 1993; 119: 1187–1197.
[Abstract/Free Full Text] - Chugh SS, Jui J, Gunson K, Stecker EC, John BT, Thompson B, Ilias N, Vickers C, Dogra V, Daya M, Kron J, Zheng ZJ, Mensah G, McAnulty J. Current burden of sudden cardiac death: multiple source surveillance versus retrospective death certificate-based review in a large U.S. community. J Am Coll Cardiol. 2004; 44: 1268–1275.
[Abstract/Free Full Text] - Cobb LA, Fahrenbruch CE, Olsufka M, Copass MK. Changing incidence of out-of-hospital ventricular fibrillation, 1980–2000. JAMA. 2002; 288: 3008–3013.
[Abstract/Free Full Text] - Nichol G, Stiell IG, Laupacis A, Pham B, De Maio V, Wells GA. A cumulative meta-analysis of the effectiveness of defibrillator-capable emergency medical services for victims of out-of-hospital cardiac arrest. Ann Emerg Med. 1999; 34: 517–525.[CrossRef][Medline]
[Order article via Infotrieve]
- Culley LL, Rea TD, Murray JA, Welles B, Fahrenbruch CE, Olsufka M, Eisenberg MS, Copass MK. Public access defibrillation in out-of-hospital cardiac arrest: a community-based study. Circulation. 2004; 109: 1859–1863.
[Abstract/Free Full Text] - Young KD, Gausche-Hill M, McClung CD, Lewis RJ. A prospective, population-based study of the epidemiology and outcome of out-of-hospital pediatric cardiopulmonary arrest. Pediatrics. 2004; 114: 157–164.
[Abstract/Free Full Text] - Mogayzel C, Quan L, Graves JR, Teidman D, Fahrenbruch C, Herndon P. Out-of-hospital ventricular fibrillation in children and adolescents: causes and outcomes. Ann Emerg Med. 1995; 25: 484–491.[CrossRef][Medline]
[Order article via Infotrieve]
- Donoghue A, Nadkarni V, Berg RA, Osmond MH, Wells GA, Nesbitt L, et al. Out-of-hospital pediatric cardiac arrest: an epidemiologic review and assessment of current knowledge. Ann Emerg Med. 2005; 46: 512–522.[CrossRef][Medline]
[Order article via Infotrieve]
- Luckstead EF, Patel DR. Catastrophic pediatric sports injuries. Pediatr Clin North Am. 2002; 49: 581–591.[CrossRef][Medline]
[Order article via Infotrieve]
- Maron BJ, Gohman TE, Aeppli D. Prevalence of sudden cardiac death during competitive sports activities in Minnesota high school athletes. J Am Coll Cardiol. 1998; 32: 1881–1884.
[Abstract/Free Full Text] - Winkleby MA, Kraemer HC, Ahn DK, Varady AN. Ethnic and socioeconomic differences in cardiovascular disease risk factors: findings for women from the Third National Health and Nutrition Examination Survey, 1988–1994. JAMA. 1998; 280: 356–362.
[Abstract/Free Full Text] - Centers for Disease Control and Prevention (CDC). Racial/ethnic and socioeconomic disparities in multiple risk factors for heart disease and stroke: United States, 2003. MMWR. 2005; 54: 113–117.[Medline]
[Order article via Infotrieve]
- Winkleby MA, Cubbin C. Changing patterns in health behaviors and risk factors related to chronic disease, 1999–2000. Am J Health Promot. 2004; 19: 19–27.[Medline]
[Order article via Infotrieve]
- Daviglus ML, Stamler J, Pirzada A, Yan LL, Garside DB, Liu K, Wang R, Dyer AR, Lloyd-Jones DM, Greenland P. Favorable cardiovascular risk profile in young women and long-term risk of cardiovascular and all-cause mortality. JAMA. 2004; 292: 1588–1592.
[Abstract/Free Full Text] - Stamler J, Stamler R, Neaton JD, Wentworth D, Daviglus ML, Garside D, Dyer AR, Liu K, Greenland P. Low risk-factor profile and long-term cardiovascular and noncardiovascular mortality and life expectancy: findings for 5 large cohorts of young adult and middle-aged men and women. JAMA. 1999; 282: 2012–2018.
[Abstract/Free Full Text] - Mensah GA, Mokdad AH, Ford ES, Greenlund KJ, Croft JB. State of disparities in cardiovascular health in the United States. Circulation. 2005; 111: 1233–1241.
[Abstract/Free Full Text] - Reeves MJ, Rafferty AP. Healthy lifestyle characteristics among adults in the United States, 2000. Arch Intern Med. 2005; 165: 854–857.
[Abstract/Free Full Text] - Briefel, RR, Johnson CL. Secular trends in dietary intake in the United States. Annu Rev Nutr. 2004; 24: 401–431.[CrossRef][Medline]
[Order article via Infotrieve]
- Gregg EW, Cheng YJ, Cadwell BL, Imperatore G, Williams DE, Flegal KM, Narayan KM, Williamson DF. Secular trends in cardiovascular disease risk factors according to body mass index in US adults. JAMA. 2005; 293: 1868–1874.
[Abstract/Free Full Text] - Bonow RO, Smaha LA, Smith SC Jr, Mensah GA, Lenfant C. World Heart Day 2002: the international burden of cardiovascular disease: responding to the emerging global epidemic. Circulation. 2002; 106: 1602–1605.
[Free Full Text] - National Hospital Discharge Survey. 2001. Annual Summary With Detailed Diagnosis and Procedure Data. NCHS. Vital and Health Statistics. 13 (156). 2004.
- National Ambulatory Medical Care Survey: 2003 Summary. Advanced Data from Vital and Health Ststistics; No. 365. Hyattsville, MD: NCHS 2005.
- National Hospital Ambulatory Medical Care Survey: Emergency Department Summary. 2003. Advance Data from Vital and Health Ststistics; No.358. Hyattsville, MD: NCHS. 2005.
- 1999 National Nursing Home Survey. June 2002. http://www.cdc.gov/nchs/data/series/sr_13/sr13_152.pdf
- National Hospital Ambulatory Medical Care Survey: 2002 Outpatient Department Summary. Vital and Health Statistics. NCHS. http://www.cdc.gov/nchs/data/ad/ad345.pdf
- Health Care Financing Review, 2003 Medicare and Medicaid Statistical Supplement. (www.cms.hhs.gov/review/supp/2003)
- Thorpe KE, Florence CS, Howard DH, Joski P. The impact of obesity on rising medical spending. Health Aff (Millwood). 2004;suppl web exclusives:W4-480-6.
- Deleted in proof.
- Ford ES, Giles WH. Changes in prevalence of nonfatal coronary heart disease in the United States from 1971–1994. Ethn Dis. 2003; 13: 85–93.[Medline]
[Order article via Infotrieve]
- Atherosclerosis Risk in Communities (ARIC, 1987–2000), NHLBI.
- Lloyd-Jones DM, Larson MG, Beiser A, Levy D. Lifetime risk for developing coronary heart disease. Lancet. 1999; 353: 89–92.[CrossRef][Medline]
[Order article via Infotrieve]
- Jones DW, Chambless LE, Folsom AR, Heiss G, Hutchinson RG, Sharrett AR, Szklo M, Taylor HA Jr. Risk factors for coronary heart disease in African Americans: the Atherosclerotic Risk in Communities Study, 1987–1997. Arch Intern Med. 2002; 162: 2565–2571.
[Abstract/Free Full Text] - Kannel WB, Hjortland MC, McNamara PM, Gordon T. Menopause and risk of cardiovascular disease: the Framingham study. Ann Intern Med. 1976; 85: 447–452.[Medline]
[Order article via Infotrieve]
- Rea TD, Pearce RM, Raghunathan TE, Lemaitre RN, Sotoodehnia N, Jouven X, Siscovick DS. Incidence of out-of-hospital cardiac arrest. Am J Cardiol. 2004; 93: 1455–1460.[CrossRef][Medline]
[Order article via Infotrieve]
- Fox CS, Evans JC, Larson MG, Kannel WB, Levy D. Temporal trends in coronary heart disease mortality and sudden cardiac death from 1950–1999: the Framingham Heart Study. Circulation. 2004; 110: 522–527.
[Abstract/Free Full Text] - NRMI. Available at: www.nrmi.org/nrmi_data.html.
- Rogers WJ, Canto JG, Lambrew CT, Tiefenbrunn AJ, Kinkaid B, Shoultz DA, Frederick PD, Every N. Temporal trends in the treatment of over 1.5 million patients with myocardial infarction in the US from 1990 through 1999: the National Registry of Myocardial Infarction 1, 2 and 3. J Am Coll Cardiol. 2000; 36: 2056–2063.
[Abstract/Free Full Text] - French WJ. Trends in acute myocardial management: use of the National Registry of Myocardial Infarction in quality improvement. Am J Cardiol. 2000; 85: 5B–9B.[CrossRef][Medline]
[Order article via Infotrieve]
- Vaccarino V, Parsons L, Every NR, Barron HV, Krumholz HM. Sex-based differences in early mortality after myocardial infarction: National Registry of Myocardial Infarction 2 participants. N Engl J Med. 1999; 341: 217–225.
[Abstract/Free Full Text] - Greenland P, Knoll MD, Stamler J, Neaton JD, Dyer AR, Garside DB, Wilson PW. Major risk factors as antecedents of fatal and nonfatal coronary heart disease events. JAMA. 2003; 290: 891–897.
[Abstract/Free Full Text] - Yusuf S, Hawken S, Ounpuu S, Dans T, Avezum A, Lanas F, McQueen M, Budaj A, Pais P, Varigos J, Lisheng L; INTERHEART Study Investigators. Effect of potentially modifiable risk factors associated with myocardial infarction in 52 countries (the INTERHEART study): case-control study. Lancet. 2004; 364: 937–952.[CrossRef][Medline]
[Order article via Infotrieve]
- Balady GJ, Larson MG, Vasan RS, Leip EP, O’Donnell CJ, Levy D. Usefulness of exercise testing in the prediction of coronary disease risk among asymptomatic persons as a function of the Framingham risk score. Circulation. 2004; 110: 1920–1925.
[Abstract/Free Full Text] - Manolio TA, et al. U.S. trends in prevalence of low coronary risk: National Health and Nutrition Examination Surveys. Circulation. 2004; 109: 32. Abstract.
- Ford ES, Giles WH, Mokdad AH. The distribution of 10-year risk for coronary heart disease among US adults: findings from the National Health and Nutrition Survey III. J Am Coll Cardiol. 2004; 43: 1791–1796.
[Abstract/Free Full Text] - Vasan RS, Sullivan LM, Wilson PW, Sempos CT, Sundstrom J, Kannel WB, Levy D, D’Agostino RB. Relative importance of borderline and elevated levels of coronary heart disease risk factors. Ann Intern Med. 2005; 142: 393–402.
[Abstract/Free Full Text] - Witt BJ, Jacobsen SJ, Weston SA, Killian JM, Meverden RA, Allison TG, Reeder GS, Roger VL Cardiac rehabilitation after myocardial infarction in the community. J Am Coll Cardiol. 2004; 44: 988–996.
[Abstract/Free Full Text] - NCHS. Vital Health Stat. 2004; 13 (157).
- Mosca L, Ferris A, Fabunmi R, Robertson RM; American Heart Association. Tracking women’s awareness of heart disease: an American Heart Association national study. Circulation. 2004; 109: 573–579.
[Abstract/Free Full Text] - Mosca L, Jones WK, King KB, Ouyang P, Redberg RF, Hill MN. Awareness, perception, and knowledge of heart disease risk and prevention among women in the United States: American Heart Association Women’s Heart Disease and Stroke Campaign Task Force. Arch Fam Med. 2000; 9: 506–515.
[Abstract/Free Full Text] - Biswas MS, Calhoun PS, Bosworth HB, Bastian LA. Are women worrying about heart disease? Womens Health Issues. 2002; 12: 204–211.[CrossRef][Medline]
[Order article via Infotrieve]
- Greenlund KJ, Keenan NL, Giles WH, Zheng ZJ, Neff LJ, Croft JB, Mensah GA. Public recognition of major signs and symptoms of heart attack: seventeen states and the US Virgin Islands, 2001. Am Heart J. 2004; 147: 1010–1016.[CrossRef][Medline]
[Order article via Infotrieve]
- Gans KM, Assmann SF, Sallar A, Lasater TM. Knowledge of cardiovascular disease prevention: an analysis from two New England communities. Prev Med. 1999; 29: 229–237.[CrossRef][Medline]
[Order article via Infotrieve]
- Davis SK, Winkleby MA, Farquhar JW. Increasing disparity in knowledge of cardiovascular disease risk factors and risk-reduction strategies by socioeconomic status: implications for policymakers. Am J Prev Med. 1995; 11: 318–323.[Medline]
[Order article via Infotrieve]
- Mosca L, Linfante AH, Benjamin EJ, Berra K, Hayes SN, Walsh BW, Fabunmi RP, Kwan J, Mills T, Simpson SL. National study of physician awareness and adherence to cardiovascular disease prevention guidelines. Circulation. 2005; 111: 499–510.
[Abstract/Free Full Text] - McGinn AP, Rosamond WD, Goff DC Jr, Taylor HA, Miles JS, Chambless L. Trends in prehospital delay time and use of emergency medical services for acute myocardial infarction: experience in 4 US communities from 1987-2000. Am Heart J. 2005; 150: 392–400.[CrossRef][Medline]
[Order article via Infotrieve]
- Morrow DA, et al. Performance of the Thrombolysis in Myocardial Infarction Risk Index for Early Acute Coronary Syndrome in the National Registry of Myocardial Infarction: a simple risk index predicts mortality in both ST and non-ST elevation myocardial infarction. J Am Coll Cardiol. 2003; 41 (suppl A): 365A–366A.
- Moriel M, Behar S, Tzivoni D, Hod H, Boyko V, Gottlieb S. Management and outcomes of elderly women and men with acute coronary syndromes in 2000 and 2002. Arch Intern Med. 2005; 165: 1521–1526.
[Abstract/Free Full Text] - Wilson PW, D’Agostino RB, Levy D, Belanger AM, Silbershatz H, Kannel WB. Prediction of coronary heart disease using risk factor categories. Circulation. 1998; 97: 1837–1847.
[Abstract/Free Full Text] - Broderick J, Brott T, Kothari R, Miller R, Khoury J, Pancioli A, Gebel J, Mills D, Minneci L, Shukla R. The Greater Cincinnati/Northern Kentucky Stroke Study: preliminary first-ever and total incidence rates of stroke among blacks. Stroke. 1998; 29: 415–421.
[Abstract/Free Full Text] - Muntner P, Garrett E, Klag MJ, Coresh J. Trends in stroke prevalence between 1973 and 1991 in the US population 25 to 74 years of age. Stroke. 2002; 33: 1209–1213.
[Abstract/Free Full Text] - Advance data from Vital and Health Statistics. No. 356. April 27, 2005.
- Centers for Disease Control and Prevention (CDC). Disparities in deaths from stroke among persons <75 years: United States, 2002. MMWR Morb Mortal Wkly Rep. 2005; 54: 477–481.[Medline]
[Order article via Infotrieve]
- Howard G, Wagenknecht LE, Cai J, Cooper L, Kraut MA, Toole JF. Cigarette smoking and other risk factors for silent cerebral infarction in the general population. Stroke. 1998; 29: 913–917.
[Abstract/Free Full Text] - Bryan RN, Wells SW, Miller TJ, Elster AD, Jungreis CA, Poirier VC, Lind BK, Manolio TA. Infarctlike lesions in the brain: prevalence and anatomic characteristics at MR imaging of the elderly: data from the Cardiovascular Health Study. Radiology. 1997; 202: 47–54.
[Abstract/Free Full Text] - Price TR, Psaty B, O’Leary D, Burke G, Gardin J. Assessment of cerebrovascular disease in the Cardiovascular Health Study. Ann Epidemiol. 1993; 3: 504–5077.[Medline]
[Order article via Infotrieve]
- Hankey et al. Impact of people with transient ischemic attack on stroke incidence and public health. Cerebrovasc Dis. 1996; 6 (suppl 1): 26–33.
- Ovbiagele B, Kidwell CS, Saver JL. Epidemiological impact in the United States of a tissue-based definition of transient ischemic attack. Stroke. 2003; 34: 919–924.
[Abstract/Free Full Text] - Hill MD, Yiannakoulias N, Jeerakathil T, Tu JV, Svenson LW, Schopflocher DP. The high risk of stroke immediately after transient ischemic attack: a population-based study. Neurology. 2004; 62: 2015–2020.
[Abstract/Free Full Text] - Kleindorfer D, Panagos P, Pancioli A, Khoury J, Kissela B, Woo D, Schneider A, Alwell K, Jauch E, Miller R, Moomaw C, Shukla R, Broderick JP. Incidence and short-term prognosis of transient ischemic attack in a population-based study. Stroke. 2005; 36: 720–723.
[Abstract/Free Full Text] - Johnston SC, Fayad PB, Gorelick PB, Hanley DF, Shwayder P, van Husen D, Weiskopf T. Prevalence and knowledge of transient ischemic attack among US adults. Neurology. 2003; 60: 1429–1434.
[Abstract/Free Full Text] - Dennis MS, Bamford JM, Sandercock PA, Warlow CP. Incidence of transient ischemic attack in Oxfordshire, England. Stroke. 1989; 20: 333–339.
[Abstract/Free Full Text] - Lisabeth LD, Ireland JK, Risser JM, Brown DL, Smith MA, Garcia NM, Morgenstern LB. Stroke risk after transient ischemic attack in a population-based setting. Stroke. 2004; 35: 1842–1846.
[Abstract/Free Full Text] - Coull AJ, Lovett JK, Rothwell PM, for the Oxford Vascular Study. Population-based study of early risk of stroke after transient ischemic attack or minor stroke: implications for public education and organization of services. BMJ. 2004; 328: 326.
[Abstract/Free Full Text] - Sherman DG. Reconsideration of TIA diagnostic criteria. Neurology. 2004; 62: S20–S21.
[Abstract/Free Full Text] - Clark TG, Murphy MF, Rothwell PM. Long term risks of stroke, myocardial infarction, and vascular death in "low-risk" patients with a non-recent transient ischaemic attack. J Neurol Neurosurg Psychiatry. 2003; 74: 577–580.
[Abstract/Free Full Text] - Eliasziw M, Kennedy J, Hill MD, Buchan AM, Barnett HJ, for the North American Symptomatic Carotid Endarterectomy Trial Group. Early risk of stroke after a transient ischemic attack in patients with internal carotid artery disease. CMAJ. 2004; 170: 1105–1109.
[Abstract/Free Full Text] - Deleted in proof.
- Deleted in proof.
- Morgenstern LB, Smith MA, Lisabeth LD, Risser JM, Uchino K, Garcia N, Longwell PJ, McFarling DA, Akuwumi O, Al-Wabil A, Al-Senani F, Brown DL, Moye LA. Excess stroke in Mexican Americans compared with non-Hispanic whites: the Brain Attack Surveillance in Corpus Christi Project. Am J Epidemiol. 2004; 160: 376–383.
[Abstract/Free Full Text] - White H, Boden-Albala B, Wang C, Elkind MS, Rundek T, Wright CB, Sacco RL. Ischemic stroke subtype incidence among whites, blacks, and Hispanics: the Northern Manhattan Study. Circulation. 2005; 111: 1327–1331.
[Abstract/Free Full Text] - Rosamond WD, Folsom AR, Chambless LE, Wang CH, McGovern PG, Howard G, Copper LS, Shahar E. Stroke incidence and survival among middle-aged adults: 9-year follow-up of the Atherosclerotic Risk in Communities (ARIC) Cohort. Stroke. 1999; 30: 736–743.
[Abstract/Free Full Text] - Deleted in proof.
- Ayala C, Greenlund KJ, Croft JB, Keenan NL, Donehoo RS, Giles WH, Kittner SJ, Marks JS. Racial/ethnic disparities in mortality by stroke subtype in the United States, 1995–1998. Am J Epidemiol. 2001; 154: 1057–1063.
[Abstract/Free Full Text] - Johnston SC, Gress DR, Browner WS, Sidney S. Short-term prognosis after emergency department diagnosis of TIA. JAMA. 2000; 284: 2901–2906.
[Abstract/Free Full Text] - Wolf PA, D’Agostino RB, Kannel WB, Bonita R, Belanger AJ. Cigarette smoking as a risk factor for stroke: the Framingham study. JAMA. 1988; 259: 1025–1029.[Abstract]
- Wolf PA, Abbott RD, Kannel WB. Atrial fibrillation as an independent risk factor for stroke: the Framingham study. Stroke. 1991; 22: 983–988.
[Abstract/Free Full Text] - Seshadri S et al. Lifetime risk of stroke: results from the Framingham study. Stroke. In press.
- Kissela BM, Khoury J, Kleindorfer D, Woo D, Schneider A, Alwell K, Miller R, Ewing I, Moomaw CJ, Szaflarski JP, Gebel J, Shukla R, Broderick JP. Epidemiology of ischemic stroke in patients with diabetes: the greater Cincinnati/Northern Kentucky Stroke Study. Diabetes Care. 2005; 28: 355–359.
[Abstract/Free Full Text] - Lee IM, Hennekens CH, Berger K, Buring JE, Manson JE. Exercise and risk of stroke in male physicians. Stroke. 1999; 30: 1–6.
[Abstract/Free Full Text] - Lee IM, Paffenbarger RS Jr. Physical activity and stroke incidence: the Harvard Alumni Health Study. Stroke. 1998; 29: 2049–2054.
[Abstract/Free Full Text] - Hu FB, Stampfer MJ, Colditz GA, Ascherio A, Rexrode KM, Willett WC, Manson JE. Physical activity and risk of stroke in women. JAMA. 2000; 283: 2961–2967.
[Abstract/Free Full Text] - Sacco RL, Gan R, Boden-Albala B, Lin IF, Kargman DE, Hauser WA, Shea S, Paik MC. Leisure-time physical activity and ischemic stroke risk: the Northern Manhattan Stroke Study. Stroke. 1998; 29: 380–387.
[Abstract/Free Full Text] - Evenson KR, Rosamond WD, Cai J, Toole JF, Hutchinson RG, Shahar E, Folsom AR. Physical activity and ischemic stroke risk: the Atherosclerosis Risk in Communities Study. Stroke. 1999; 30: 1333–1339.
[Abstract/Free Full Text] - Kittner SJ, Stern BJ, Feeser BR, Hebel R, Nagey DA, Buchholz DW, Earley CJ, Johnson CJ, Macko RF, Sloan MA, Wityk RJ, Wozniak MA. Pregnancy and the risk of stroke. N Engl J Med. 1996; 335: 768–774.
[Abstract/Free Full Text] - Salonen Ros H, Lichtenstein P, Bellocco R, Petersson G, Cnattingius S. Increased risks of circulatory diseases in late pregnancy and puerperium. Epidemiology. 2001; 12: 456–460.[CrossRef][Medline]
[Order article via Infotrieve]
- Curb JD, Abbott RD, Rodriguez BL, Masaki KH, Chen R, Popper JS, Petrovitch H, Ross GW, Schatz IJ, Belleau GC, Yano K. High density lipoprotein cholesterol and the risk of stroke in elderly men: the Honolulu Heart Program. Am J Epidemiol. 2004; 160: 150–157.
[Abstract/Free Full Text] - James AH, Bushnell CD, Jamison MG, Myers ER. Incidence and risk factors for stroke in pregnancy and the puerperium. Obstet Gynecol. 2005; 106: 509–516.
[Abstract/Free Full Text] - Bousser MG. Stroke in women: the 1997 Paul Dudley White International Lecture. Circulation. 1999; 99: 463–467.
[Free Full Text] - Bonita R. Epidemiology of stroke. Lancet. 1992; 339: 342–344.[CrossRef][Medline]
[Order article via Infotrieve]
- Wassertheil-Smoller S, Hendrix SL, Limacher M, Heiss G, Kooperberg C, Baird A, Kotchen T, Curb JD, Black H, Rossouw JE, Aragaki A, Safford M, Stein E, Laowattana S, Mysiw WJ, for the WHI Investigators. Effect of estrogen plus progestin on stroke in postmenopausal women: the Women’s Health Initiative: a randomized trial. JAMA. 2003; 289: 2673–2684.
[Abstract/Free Full Text] - Anderson GL, Limacher M, Assaf AR, Bassford T, Beresford SA, Black H, Bonds D, Brunner R, Brzyski R, Caan B, Chlebowski R, Curb D, Gass M, Hays J, Heiss G, Hendrix S, Howard BV, Hsia J, Hubbell A, Jackson R, Johnson KC, Judd H, Kotchen JM, Kuller L, LaCroix AZ, Lane D, Langer RD, Lasser N, Lewis CE, Manson J, Margolis K, Ockene J, O’Sullivan MJ, Phillips L, Prentice RL, Ritenbaugh C, Robbins J, Rossouw JE, Sarto G, Stefanick ML, Van Horn L, Wactawski-Wende J, Wallace R, Wassertheil-Smoller S, for the Women’s Health Initiative Steering Committee. Effects of conjugated equine estrogen in postmenopausal women with hysterectomy: the Women’s Health Initiative randomized controlled trial. JAMA. 2004; 291: 1701–1712.
[Abstract/Free Full Text] - Simon JA, Hsia J, Cauley JA, Richards C, Harris F, Fong J, Barrett-Connor E, Hulley SB. Postmenopausal hormone therapy and risk of stroke: the Heart and Estrogen-Progestin Replacement Study (HERS). Circulation. 2001; 103: 638–642.
[Abstract/Free Full Text] - Viscoli CM, Brass LM, Kernan WN, Sarrel PM, Suissa S, Horwitz RI. A clinical trial of estrogen-replacement therapy after ischemic stroke. N Engl J Med. 2001; 345: 1243–1249.
[Abstract/Free Full Text] - Rossouw JE, Anderson GL, Prentice RL, LaCroix AZ, Kooperberg C, Stefanick ML, Jackson RD, Beresford SA, Howard BV, Johnson KC, Kotchen JM, Ockene J, for the Writing Group for the Women’s Health Initiative Investigators. Risks and benefits of estrogen plus progestin in healthy postmenopausal women: principal results from the Women’s Health Initiative randomized controlled trial. JAMA. 2002; 288: 321–333.
[Abstract/Free Full Text] - Centers for Disease Control and Prevention (CDC). Prevalence of disabilities and associated health conditions among adults: United States, 1999. MMWR. 2001; 50: 120–125.[Medline]
[Order article via Infotrieve]
- Evenson KR, Rosamond WD, Morris DL. Pre-hospital and in-hospital delays in acute stroke care. Neuroepidemiology. 2001; 20: 65–76.[CrossRef][Medline]
[Order article via Infotrieve]
- Kelley-Hayes M, et al. The influence of gender and age on disability following ischemic stroke: the Framingham study. J Stroke Cerebrovasc Dis. 2003; 12: 119–126.[CrossRef][Medline]
[Order article via Infotrieve]
- Arora S, Broderick JP, Frankel M, Heinrich JP, Hickenbottom S, Karp H, LaBresh KA, Malarcher A, Moomaw CJ, Reeves MJ, Schwamm L, Weiss P, for the Paul Coverdell Prototype Registries Writing Group. Acute stroke care in the US: results from 4 pilot prototypes of the Paul Coverdell National Acute Stroke Registry. Stroke. 2005; 36: 1232–1240.
[Abstract/Free Full Text] - California Acute Stroke Pilot Registry (CASPR) Investigators. Prioritizing interventions to improve rates of thrombolysis for ischemic Stroke. Neurology. 2005; 64: 654–659.
[Abstract/Free Full Text] - California Acute Stroke Pilot Registry Investigators. The impact of standardized stroke orders on adherence to best practices. Neurology. 2005; 65: 360–365.
[Abstract/Free Full Text] - Fang J, Alderman MH. Trend of stroke hospitalization, United States, 1988–1997. Stroke. 2001; 32: 2221–2226.
[Abstract/Free Full Text] - Kennedy BS, Kasl SV, Brass LM, Vaccarino V. Trends in hospitalized stroke for blacks and whites in the United States, 1980–1999. Neuroepidemiology. 2002; 21: 131–141.[CrossRef][Medline]
[Order article via Infotrieve]
- Kozak LJ. Underreporting of race in the National Hospital Discharge Survey. Advance Data 1995; No. 265.
- Centers for Disease Control and Prevention (CDC). Awareness of stroke warning signs: 17 states and the U.S. Virgin Islands, 2001. MMWR Morbid Mortal Wkly Rep. 2004; 53: 359–362.[Medline]
[Order article via Infotrieve]
- Kothari R, Sauerbeck L, Jauch E, Broderick J, Brott T, Khoury J, Liu T. Patient’s awareness of stroke signs, symptoms, and risk factors. Stroke. 1997; 28: 1871–1875.
[Abstract/Free Full Text] - Schneider AT, Pancioli AM, Khoury JC, Rademacher E, Tuchfarber A, Miller R, Woo D, Kissela B, Broderick JP. Trends in community knowledge of the warning signs and risk factors for stroke. JAMA. 2003; 289: 343–346.
[Abstract/Free Full Text] - Silver FL, Rubini F, Black D, Hodgson CS. Advertising strategies to increase public knowledge of the warning signs of stroke. Stroke. 2003; 34: 1965–1968.
[Abstract/Free Full Text] - Greenlund KJ, Neff LJ, Zheng ZJ, Keenan NL, Giles WH, Ayala CA, Croft JB, Mensah GA. Low public recognition of major stroke symptoms. Am J Prev Med. 2003; 25: 315–319.[CrossRef][Medline]
[Order article via Infotrieve]
- Pancioli AM, Broderick J, Kothari R, Brott T, Tuchfarber A, Miller R, Khoury J, Jauch E. Public perception of stroke warning signs and knowledge of potential risk factors. JAMA. 1998; 279: 1288–1292.
[Abstract/Free Full Text] - Samsa GP, Cohen SJ, Goldstein LB, Bonito AJ, Duncan PW, Enarson C, DeFriese GH, Horner RD, Matchar DB. Knowledge of risk among patients at increased risk for Stroke. Stroke. 1997; 28: 916–921.
[Abstract/Free Full Text] - Ferris A, Robertson RM, Fabunmi R, Mosca L, for the American Heart Association and American Stroke Association. American Heart Association and American Stroke Association national survey of stroke risk awareness among women. Circulation. 2005; 111: 1321–1326.
[Abstract/Free Full Text] - Robinson KA, Merrill RM. Relation among stroke knowledge, lifestyle, and stroke-related screening results. Geriatr Nurs. 2003; 24: 300–305.[CrossRef][Medline]
[Order article via Infotrieve]
- Taylor TN, Davis PH, Torner JC, Holmes J, Meyer JW, Jacobson MF. Lifetime cost of stroke in the United States. Stroke. 1996; 27: 1459–1466.
[Abstract/Free Full Text] - Leibson CL, Hu T, Brown RD, Hass SL, O’Fallon WM, Whisnant JP. Utilization of acute care services in the year before and after first stroke: a population-based study. Neurology. 1996; 46: 861–869.[Medline]
[Order article via Infotrieve]
- Diringer MN, Edwards DF, Mattson DT, Akins PT, Sheedy CW, Hsu CY, Dromerick AW. Predictors of acute hospital costs for treatment of ischemic stroke in an academic center. Stroke. 1999; 30: 724–728.
[Abstract/Free Full Text] - Metz R. Cost-effective, risk-free, evidence-based medicine. Arch Intern Med. 2003; 163: 2795.
[Free Full Text] - Lynch JK, Hirtz DG, DeVeber G, Nelson KB. Report of the National Institute of Neurological Disorders and Stroke workshop on perinatal and childhood stroke. Pediatrics. 2002; 109: 116–123.
[Abstract/Free Full Text] - Lee J, Croen LA, Backstrand KH, Yoshida CK, Henning LH, Lindan C, Ferriero DM, Fullerton HJ, Barkovich AJ, Wu YW. Maternal and infant characteristics associated with perinatal arterial stroke in the infant. JAMA. 2005; 293: 723–729.
[Abstract/Free Full Text] - Broderick J, Talbot GT, Prenger E, Leach A, Brott T. Stroke in children within a major metropolitan area: the surprising importance of intracerebral hemorrhage. J Child Neurol. 1993; 8: 250–255.[Medline]
[Order article via Infotrieve]
- Earley CJ, Kittner SJ, Feeser BR, Gardner J, Epstein A, Wozniak MA, Wityk R, Stern BJ, Price TR, Macko RF, Johnson C, Sloan MA, Buchholz D. Stroke in children and sickle-cell disease: Baltimore-Washington Cooperative Young Stroke Study. Neurology. 1998; 51: 169–176.
[Abstract/Free Full Text] - deVeber GA, MacGregor D, Curtis R, Mayank S. Neurologic outcome in survivors of childhood arterial ischemic stroke and sinovenous thrombosis. J Child Neurol. 2000; 15: 316–324.
[Abstract/Free Full Text] - Fullerton HJ, Wu YW, Zhao S, Johnston SC. Risk of stroke in children: ethnic and gender disparities. Neurology. 2003; 61: 189–194.
[Abstract/Free Full Text] - Strater R, Becker S, von Eckardstein A, Heinecke A, Gutsche S, Junker R, Kurnik K, Schobess R, Nowak-Gottl U. Prospective assessment of risk factors for recurrent stroke during childhood: a 5-year follow-up study. Lancet. 2002; 360: 1540–1545.[CrossRef][Medline]
[Order article via Infotrieve]
- Fullerton HJ, Chetkovich DM, Wu YW, Smith WS, Johnston SC. Deaths from stroke in U.S. children, 1979 to 1998. Neurology. 2002; 59: 34–39.
[Abstract/Free Full Text] - Fullerton HJ, Adams RJ, Zhao S, Johnston SC. Declining stroke rates in Californian children with sickle cell disease. Blood. 2004; 104: 336–339.
[Abstract/Free Full Text] - Kissela B, Schneider A, Kleindorfer D, Khoury J, Miller R, Alwell K, Woo D, Szaflarski J, Gebel J, Moomaw C, Pancioli A, Jauch E, Shukla R, Broderick J. Stroke in a biracial population: the excess burden of stroke among blacks. Stroke. 2004; 35: 426–431.
[Abstract/Free Full Text] - Wolf PA, D’Agostino RB, Belanger AJ, Kannel WB. Probability of stroke: a risk profile from the Framingham Study. Stroke. 1991; 22: 312–318.
[Abstract/Free Full Text] - Fields LE, Burt VL, Cutler JA, Hughes J, Roccella EJ, Sorlie P. The burden of adult hypertension in the United States, 1999–2000: a rising tide. Hypertension. 2004; 44: 398–404.
[Abstract/Free Full Text] - Greenlund KJ, Croft JB, Mensah GA. Prevalence of heart disease and stroke risk factors in persons with prehypertension in the United States, 1999–2000. Arch Intern Med. 2004; 164: 2113–2118.
[Abstract/Free Full Text] - Collins R, Winkleby MA. African-American women and men at high and low risk for hypertension: a signal detection analysis of NHANES III, 1988–1994. Prev Med. 2002; 35: 303–312.[CrossRef][Medline]
[Order article via Infotrieve]
- Brett KM, et al. Utilization of ambulatory medical care by women: United States, 1997–98. Vital Health Stat 13. 2001; 149: 1–46.
- Muntner P, He J, Cutler JA, Wildman RP, Whelton PK. Trends in blood pressure among children and adolescents. JAMA. 2004; 291: 2107–2113.
[Abstract/Free Full Text] - Vital and Health Statistics. No. 356, April 27, 2005.
- Hajjar I, Kotchen TA. Trends in prevalence, awareness, treatment and control of hypertension in the Unites States, 1988–2000. JAMA. 2003; 290: 199–206.
[Abstract/Free Full Text] - Psaty BM, Manolio TA, Smith NL, Heckbert SR, Gottdiener JS, Burke GL, Weissfeld J, Enright P, Lumley T, Powe N, Furberg CD, for the Cardiovascular Health Study. Time trends in high blood pressure control and the use of antihypertensive medications in older adults: the Cardiovascular Health Study. Arch Intern Med. 2002; 162: 2325–2332.
[Abstract/Free Full Text] - Lloyd-Jones DM, Evans JC, Levy D. Hypertension in adults across the age spectrum: current outcomes and control in the community. JAMA. 2005; 294: 466–472.
[Abstract/Free Full Text] - MacMahon S, et al. The epidemiological association between blood pressure and stroke: implications for primary and secondary prevention. Hypertens Res. 1994; 17 (suppl 1): S23–S32
- Levy D, Larson MG, Vasan RS, Kannel WB, Ho KK. The progression from hypertension to congestive heart failure. JAMA. 1996; 275: 1557–1562.[Abstract]
- Deleted in proof.
- CDC/NCHS.Health, United States, 2004. Data based on 3 measures of blood pressure.
- Centers for Disease Control and Prevention (CDC). Racial/ethnic disparities in prevalence, treatment, and control of hypertension—United States, 1999–2002. MMWR Morb Mortal Wkly Rep. 2005; 54 (1): 7–9.[Medline]
[Order article via Infotrieve]
- Go AS, Chertow GM, Fan D, McCulloch CE, Hsu CY. Chronic kidney disease and the risks of death, cardiovascular events, and hospitalizations. N Engl J Med. 2004; 351: 1296–1305.
[Abstract/Free Full Text] - Coresh J, Astor BC, Greene T, Eknoyan G, Levey AS. Prevalence of chronic kidney disease and decreased kidney function in the adult United States population: Third National Health and Nutrition Examination Survey. Am J Kidney Dis. 2003; 41: 1–12.[Medline]
[Order article via Infotrieve]
- Collins AJ, Li S, Gilbertson DT, Liu J, Chen SC, Herzog CA. Chronic kidney disease and cardiovascular disease in the Medicare population. Kidney Int Suppl. 2003; 87: S24–S31.[Medline]
[Order article via Infotrieve]
- Perspectives in Pediatric Cardiology, Volume 6. Armonk, NY: Futura Publishing Co; 1998
- Botto LD, Correa A, Erickson JD. Racial and temporal variations in the prevalence of heart defects. Pediatrics. 2001; 107: E32.[CrossRef][Medline]
[Order article via Infotrieve]
- Prevalence and incidence of cardiac malformations. In: Moller JH, ed. Surgery of Congenital Heart Disease: Pediatric Cardiac Care Consortium 1984–1995. Armonk, NY: Futura Publishing Co; 1998: 20.
- Hoffman JI, Kaplan S. The incidence of congenital heart disease. J Am Coll Cardiol. 2002; 39: 1890–1900.
[Abstract/Free Full Text] - Larson EW, Edwards WD. Risk factors for aortic dissection: a necropsy study of 161 cases. Am J Cardiol. 1984; 53: 849–855.[CrossRef][Medline]
[Order article via Infotrieve]
- Roguin N, Du ZD, Barak M, Nasser N, Hershkowitz S, Milgram E. High prevalence of muscular ventricular septal defect in neonates. J Am Coll Cardiol. 1995; 26: 1545–1548.[Abstract]
- Sands AJ, Casey FA, Craig BG, Dornan JC, Rogers J, Mulholland HC. Incidence and risk factors for ventricular septal defect in "low-risk" neonates. Arch Dis Child Fetal Neonatal Ed. 1999; 81: F61–F63
[Abstract/Free Full Text] - Boneva RS, Botto LD, Moore CA, Yang Q, Correa A, Erickson JD. Mortality associated with congenital heart defects in the United States: trends and racial disparities, 1979–1997. Circulation. 2001; 103: 2376–2381.
[Abstract/Free Full Text] - Redfield MM, Jacobsen SJ, Burnett JC Jr, Mahoney DW, Bailey KR, Rodeheffer RJ. Burden of systolic and diastolic ventricular dysfunction in the community: appreciating the scope of the heart failure epidemic. JAMA. 2003; 289: 194–202.
[Abstract/Free Full Text] - Lloyd-Jones DM, Larson MG, Leip EP, Beiser A, D’Agostino RB, Kannel WB, Murabito JM, Vasan RS, Benjamin EJ, Levy D, for the Framingham Heart Study. Lifetime risk for developing congestive heart failure: the Framingham Heart Study. Circulation. 2002; 106: 3068–3072.
[Abstract/Free Full Text] - Roger VL, Weston SA, Redfield MM, Hellermann-Homan JP, Killian J, Yawn BP, Jacobsen SJ. Trends in heart failure incidence and survival in a community-based population. JAMA. 2004; 292: 344–350.
[Abstract/Free Full Text] - Bibbins-Domingo K, Lin F, Vittinghoff E, Barrett-Connor E, Hulley SB, Grady D, Shlipak MG. Predictors of heart failure among women with coronary disease. Circulation. 2004; 110: 1424–1430.
[Abstract/Free Full Text] - Go AS. The epidemiology of atrial fibrillation in elderly persons: the tip of the iceberg. Am J Geriatr Cardiol. 2005; 14: 56–61.[Medline]
[Order article via Infotrieve]
- Lloyd-Jones DM, Wang TJ, Leip EP, Larson MG, Levy D, Vasan RS, D’Agostino RB, Massaro JM, Beiser A, Wolf PA, Benjamin EJ. Lifetime risk for development of atrial fibrillation: the Framingham Heart Study. Circulation. 2004; 110: 1042–1046.
[Abstract/Free Full Text] - Khairallah F, Ezzedine R, Ganz LI, London B, Saba S. Epidemiology and determinants of outcome of admissions for atrial fibrillation in the United States from 1996 to 2001. Am J Cardiol. 2004; 94: 500–504.[CrossRef][Medline]
[Order article via Infotrieve]
- Centers for Disease Control and Prevention. Atrial fibrillation as a contributing cause of death and Medicare hospitalization: United States, 1999. MMWR. 2003; 52: 128, 130–131.
- Go AS, Hylek EM, Phillips KA, Chang Y, Henault LE, Selby JV, Singer DE. Prevalence of diagnosed atrial fibrillation in adults: national implications for rhythm management and stroke prevention: The Anticoagulation and Risk Factors in Atrial Fibrillation (ATRIA) Study. JAMA. 2001; 285: 2370–2375.
[Abstract/Free Full Text] - Penado S, Cano M, Acha O, Hernandez JL, Riancho JA. Atrial fibrillation as a risk factor for stroke recurrence. Am J Med. 2003; 114: 206–210.[CrossRef][Medline]
[Order article via Infotrieve]
- Dulli DA, Stanko H, Levine RL. Atrial fibrillation is associated with severe acute ischemic stroke. Neuroepidemiology. 2003; 22: 118–123.[CrossRef][Medline]
[Order article via Infotrieve]
- Eaker ED, Sullivan LM, Kelly-Hayes M, D’Agostino RB Sr, Benjamin EJ. Does job strain increase the risk for coronary heart disease or death in men and women? The Framingham Offspring Study. Am J Epidemiol. 2004; 159: 950–958.
[Abstract/Free Full Text] - Newburger JW, Takahashi M, Gerber MA, Gewitz MH, Tani LY, Burns JC, Shulman ST, Bolger AF, Ferrieri P, Baltimore RS, Wilson WR, Baddour LM, Levison ME, Pallasch TJ, Falace DA, Taubert KA, for the Committee on Rheumatic Fever, Endocarditis and Kawasaki Disease, Council on Cardiovascular Disease in the Young, American Heart Association and American Academy of Pediatrics. Diagnosis, treatment, and long-term management of Kawasaki disease: a statement for health professionals from the Committee on Rheumatic Fever, Endocarditis and Kawasaki Disease, Council on Cardiovascular Disease in the Young, American Heart Association. Circulation. 2004; 110: 2747–2771.
[Abstract/Free Full Text] - Taubert KA, Rowley AH, Shulman ST. Seven-year national survey of Kawasaki disease and acute rheumatic fever. Pediatr Infect Dis J. 1994; 13: 704–708.[Medline]
[Order article via Infotrieve]
- Holman RC, Curns AT, Belay ED, Steiner CA, Schonberger LB. Kawasaki syndrome hospitalizations in the United States, 1997 and 2000. Pediatrics. 2003; 112: 495–501.
[Abstract/Free Full Text] - Hirsch AT, Criqui MH, Treat-Jacobson D, Regensteiner JG, Creager MA, Olin JW, Krook SH, Hunninghake DB, Comerota AJ, Walsh ME, McDermott MM, Hiatt WR. Peripheral arterial disease detection, awareness, and treatment in primary care. JAMA. 2001; 286: 1317–1324.
[Abstract/Free Full Text] - Criqui MH, Langer RD, Fronek A, Feigelson HS, Klauber MR, McCann TJ, Browner D. Mortality over a period of 10 years in patients with peripheral arterial disease. N Engl J Med. 1992; 326: 381–386.[Abstract]
- Selvin E, Erlinger TP. Prevalence of and risk factors for peripheral arterial disease in the United States: National Health and Nutrition Examination Survey, 1999-2000. Circulation. 2004; 110: 738–743.
[Abstract/Free Full Text] - Becker GJ, McClenny TE, Kovacs ME, Raabe RD, Katzen BT. The importance of increasing public and physician awareness of peripheral arterial disease. J Vasc Interv Radiol. 2002; 13: 7–11.[Medline]
[Order article via Infotrieve]
- Criqui MH, Fronek A, Klauber MR, Barrett-Connor E, Gabriel S. The sensitivity, specificity, and predictive value of traditional clinical evaluation of peripheral arterial disease: results from noninvasive testing in a defined population. Circulation. 1985; 71: 516–522.
[Abstract/Free Full Text] - McDermott MM, Fried L, Simonsick E, Ling S, Guralnik JM. Asymptomatic peripheral arterial disease is independently associated with impaired lower extremity functioning: the women’s health and aging study. Circulation. 2000; 101: 1007–1012.
[Abstract/Free Full Text] - Criqui MH, et al. Peripheral arterial disease in large vessels is epidemiologically distinct from small vessel disease: an analysis of risk factors. Am J Epidemiol. 1989; 129: 1110–1119.
[Abstract/Free Full Text] - McDermott MM, Greenland P, Liu K, Guralnik JM, Celic L, Criqui MH, Chan C, Martin GJ, Schneider J, Pearce WH, Taylor LM, Clark E. The ankle brachial index is associated with leg function and physical activity: the Walking and Leg Circulation Study. Ann Intern Med. 2002; 136: 873–883.
[Abstract/Free Full Text] - McDermott MM, Liu K, Greenland P, Guralnik JM, Criqui MH, Chan C, Pearce WH, Schneider JR, Ferrucci L, Celic L, Taylor LM, Vonesh E, Martin GJ, Clark E. Functional decline in peripheral arterial disease: associations with the ankle brachial index and leg symptoms. JAMA. 2004; 292: 453–461.
[Abstract/Free Full Text] - Newman AB, Sutton-Tyrrell K, Vogt MT, Kuller LH. Morbidity and mortality in hypertensive adults with a low ankle/arm blood pressure index. JAMA. 1993; 270: 487–489.[Abstract]
- Levy PJ. Epidemiology and pathology of peripheral arterial disease. Clin Cornerstone. 2002; 4: 1–15.[Medline]
[Order article via Infotrieve]
- Murabito JM, Evans JC, D’Agostino RB Sr, Wilson PW, Kannel WB. Temporal trends in the incidence of intermittent claudication from 1950 to 1999. Am J Epidemiol. 2005; 162: 430–437.
[Abstract/Free Full Text] - Criqui MH, Vargas V, Denenberg JO, Ho E, Allison M, Langer RD, Gamst A, Bundens WP, Fronek A. Ethnicity and peripheral arterial disease: the San Diego Population Study. Circulation. 2005; 112: 2703–2707.
[Abstract/Free Full Text] - Navas-Acien A, Selvin E, Sharrett AR, Calderon-Aranda E, Silbergeld E, Guallar E. Lead, cadmium, smoking, and increased risk of peripheral arterial disease. Circulation. 2004; 109: 3196–3201.
[Abstract/Free Full Text] - O’Hare AM, Glidden DV, Fox CS, Hsu CY. High prevalence of peripheral arterial disease in persons with renal insufficiency: results from the National Health and Nutrition Examination Survey 1999–2000. Circulation. 2004; 109: 320–323.
[Abstract/Free Full Text] - Nerheim P, Birger-Botkin S, Piracha L, Olshansky B. Heart failure and sudden death in patients tachycardia-induced cardiomyopathy and recurrent tachycardia. Circulation. 2004; 110: 247–252.
[Abstract/Free Full Text] - Lipshultz SE, Sleeper LA, Towbin JA, Lowe AM, Orav EJ, Cox GF, Lurie PR, McCoy KL, McDonald MA, Messere JE, Colan SD. The incidence of pediatric cardiomyopathy in two regions of the United States. N Engl J Med. 2003; 348: 1647–1655.
[Abstract/Free Full Text] - Maron BJ, Shirani J, Poliac LC, Mathenge R, Roberts WC, Mueller FO. Sudden death in young competitive athletes: clinical, demographic, and pathological profiles. JAMA. 1996; 276: 199–204.[Abstract]
- White RH. The epidemiology of venous thromboembolism. Circulation. 2003; 107 (suppl): I-4–I-8.[Medline]
[Order article via Infotrieve]
- Goldhaber SZ. Pulmonary embolism. N Engl J Med. 1998; 339: 93–104.
[Free Full Text] - Tsai AW, Cushman M, Rosamond WD, Heckbert SR, Tracy RP, Aleksic N, Folsom AR. Coagulation factors, inflammation markers, and venous thromboembolism: the Longitudinal Investigation of Thromboembolism Etiology (LITE). Am J Med. 2002; 113: 636–642.[CrossRef][Medline]
[Order article via Infotrieve]
- Semin Thromb Hemost. 2002; 28: suppl 2.
- Cushman M, Tsai AW, White RH, Heckbert SR, Rosamond WD, Enright P, Folsom AR. Deep vein thrombosis and pulmonary embolism in two cohorts: the Longitudinal Investigation of Thromboembolism Etiology. Am J Med. 2004; 117: 19–25.[CrossRef][Medline]
[Order article via Infotrieve]
- Fowkes FJ, Price JF, Fowkes FG. Incidence of diagnosed deep vein thrombosis in the general population: systematic review. Eur J Vasc Endovasc Surg. 2003; 25: 1–5.[CrossRef][Medline]
[Order article via Infotrieve]
- Horlander KT, Mannino DM, Leeper KV. Pulmonary embolism mortality in the United States, 1979–1998: an analysis using multiple-cause mortality data. Arch Intern Med. 2003; 163: 1711–1717.
[Abstract/Free Full Text] - Centers for Disease Control and Prevention (CDC). Centers for Disease Control and Prevention (CDC). Cigarette smoking among adults–United States, 2003. MMWR. 2004; 54: 1121–1124.
- Centers for Disease Control and Prevention (CDC). Annual smoking-attributable mortality, years of potential life lost, and productivity losses: United States, 1997-2001. MMWR. 2005; 54: 625–628.[Medline]
[Order article via Infotrieve]
- Centers for Disease Control and Prevention. National survey on drug use and health, U.S., 1999–2001. MMWR Mortal Morbid Wkly Rep. 2004; 53.
- Grunbaum JA, Kann L, Kinchen S, Ross J, Hawkins J, Lowry R, Harris WA, McManus T, Chyen D, Collins J. Youth risk behavior surveillance: United States, 2003, MMWR Surveill Summ. 2004; 53: 1–96.[Medline]
[Order article via Infotrieve]
- Winkleby MA, Robinson TN, Sundquist J, Kraemer HC. Ethnic variation in cardiovascular disease risk factors among children and young adults: findings from the Third National Health and Nutrition Examination Survey, 1988–1994. JAMA. 1999; 281: 1006–1013.
[Abstract/Free Full Text] - Federal Interagency Forum on Child and Family Statistics. America’s Children: Key National Indicators of Well-Being, 2005. Washington, DC: US Government Printing Office; 2005.
- Third National Report on Human Exposure to Environmental Chemicals. http://www.cdc.gov/exposurereport/.
- Deleted in proof.
- Deleted in proof.
- Deleted in proof.
- Centers for Disease Control and Prevention (CDC). Cigarette smoking among high school students: 11 states, 1991-1997. MMWR. 1999; 48: 686–692.[Medline]
[Order article via Infotrieve]
- Centers for Disease Control and Prevention (CDC). Annual smoking-attributable mortality, years of potential life lost, and productivity losses–United States, 1997-2001. MMWR. 2005; 54: 625–628.[Medline]
[Order article via Infotrieve]
- Surgeon General’s Health Consequences of Smoking 2004
- MMWR. 2005;54, No. 25.
- Goldenberg I, Jonas M, Tenenbaum A, Boyko V, Matetzky S, Shotan A, Behar S, Reicher-Reiss H, for the Bezafibrate Infarction Prevention Study Group. Current smoking, smoking cessation, and the risk of sudden cardiac death in patients with coronary artery disease. Arch Intern Med. 2003; 163: 2301–2305.
[Abstract/Free Full Text] - Tobacco-Related Mortality, Fact Sheet. Available at: CDC.gov/tobacco. Accessed February 2004.
- Anthonisen NR, Skeans MA, Wise RA, Manfreda J, Kanner RE, Connett JE, for the Lung Health Study Research Group. The effects of a smoking cessation intervention on 14.5-year mortality: a randomized clinical trial. Ann Intern Med. 2005; 142: 233–239.
[Abstract/Free Full Text] - Smoking Among Adults: Coronary Heart Disease and Stroke. Available at: www.cdc.gov/tobacco/sgr/sgr_2004/Factsheets/3.htm.
- Centers for Disease Control and Prevention (CDC). Cigarette use among high school students: United States, 1991–2003. MMWR. 2004; 53; 499–502.[Medline]
[Order article via Infotrieve]
- Deleted in proof.
- MMWR. 2000;49:No. SS-2.
- Centers for Disease Control and Prevention (CDC). Trends in cholesterol screening and awareness of high blood cholesterol–United States, 1991-2003. MMWR. 2005; 54; 865–870.[Medline]
[Order article via Infotrieve]
- Centers for Disease Control and Prevention (CDC). State-specific cholesterol screening trends–United States, 1991–1999. MMWR. 2000; 49: 750–755.[Medline]
[Order article via Infotrieve]
- Centers for Disease Control and Prevention (CDC). Disparities in screening for and awareness of high blood cholesterol–United States, 1999–2002. MMWR. 2005; 54; 117–119.[Medline]
[Order article via Infotrieve]
- Carroll MD, Lacher DA, Sorlie PD, Cleeman JI, Gordon DJ, Wolz M, Grundy SM, Johnson CL. Trends in serum lipids and lipoproteins of adults, 1960–2002. JAMA. 2005; 294: 1773–1781.
[Abstract/Free Full Text] - Third Report of the National Cholesterol Education Program (NCEP) Expert Panel on Detection, Evaluation, and Treatment of High Blood Cholesterol in Adults (Adult Treatment Panel) Final Report. Circulation. 2002; 106: 3143–3421.
[Free Full Text] - Hickman TB, Briefel RR, Carroll MD, Rifkind BM, Cleeman JI, Maurer KR, Johnson CL. Distributions and trends of serum lipid levels among United States children and adolescents ages 4–19 years: data from the Third National Health and Nutrition Examination Survey. Prev Med. 1998; 27: 879–890.[CrossRef][Medline]
[Order article via Infotrieve]
- Centers for Disease Control and Prevention (CDC). MMWR. 2004; 53: No. SS-2.
- Centers for Disease Control and Prevention (CDC). MMWR. 2005; 54: No. 39.
- Centers for Disease Control and Prevention (CDC). Physical activity levels among children aged 9–13 years: United States, 2002. MMWR. 2003; 52: 785–788.[Medline]
[Order article via Infotrieve]
- Kimm SY, Glynn NW, Kriska AM, Barton BA, Kronsberg SS, Daniels SR, Crawford PB, Sabry ZI, Liu K. Decline in physical activity in black girls and white girls during adolescence. N Engl J Med. 2002; 347: 709–715.
[Abstract/Free Full Text] - Centers for Disease Control and Prevention (CDC). Physical activity among Asians and native Hawaiian or other Pacific islanders: 50 states and the District of Columbia, 2001–2003. MMWR Morb Mortal Wkly Rep. 2004; 53: 756–760.[Medline]
[Order article via Infotrieve]
- Schoenborn CA, Adams PF, Barnes PM, Vickerie JL, Schiller JS. Health behaviors of adults: United States, 1999-2001. Vital Health Stat 10. 2004; (219): 1–79.
- Pate RR, Pratt M, Blair SN, Haskell WL, Macera CA, Bouchard C, Buchner D, Ettinger W, Heath GW, King AC, et al. Physical activity and public health: a recommendation from the Centers for Disease Control and Prevention and the American College of Sports Medicine. JAMA. 1995; 273: 402–407.[Abstract]
- Crespo CJ, Smit E, Carter-Pokras O, Andersen R. Acculturation and leisure-time physical inactivity in Mexican-American adults: results from NHANES III, 1988–1994. Am J Public Health. 2001; 91: 1254–1257.
[Abstract/Free Full Text] - Hedley AA, Ogden CL, Johnson CL, Carroll MD, Curtin LR, Flegal KM. Prevalence of overweight and obesity among US children, adolescents, and adults, 1999–2002. JAMA. 2004; 291: 2847–2850.
[Abstract/Free Full Text] - Centers for Disease Control and Prevention (CDC). MMWR. 2005; 54: No. 24.
- Centers for Disease Control and Prevention (CDC). Children and teens told by doctors that they were overweight–United States, 1999-2002. MMWR. 2005; 54: 848–849.[Medline]
[Order article via Infotrieve]
- Vasan RS, Pencina MJ, Cobain M, Freiberg MS, D’Agostino RB. Estimated risks for developing obesity in the Framingham Heart Study. Ann Intern Med. 2005; 143: 473–480.
[Abstract/Free Full Text] - Suk SH, Sacco RL, Boden-Albala B, Cheun JF, Pittman JG, Elkind MS, Paik MC, for the Northern Manhattan Stroke Study. Abdominal obesity and risk of ischemic stroke: the Northern Manhattan Stroke Study. Stroke. 2003; 34: 1586–1592.
[Abstract/Free Full Text] - Deleted in proof.
- Rodriguez BL, D’Agostino R, Abbott RD, Kagan A, Burchfiel CM, Yano K, Ross GW, Silbershatz H, Higgins MW, Popper J, Wolf PA, Curb JD. Risk of hospitalized stroke in men enrolled in the Honolulu Heart Program and the Framingham Heart Study: a comparison of incidence and risk factor effects. Stroke. 2002; 33: 230–237.
[Abstract/Free Full Text] - Centers for Disease Control and Prevention (CDC). State-specific prevalence of obesity among adults with disabilities: eight states and the District of Columbia, 1998–1999. MMWR. 2002; 51: 805–808.[Medline]
[Order article via Infotrieve]
- Peeters A, Barendregt JJ, Willekens F, Mackenbach JP, Al Mamun A, Bonneux L, for NEDCOM, the Netherlands Epidemiology and Demography Compression of Morbidity Research Group. Obesity in adulthood and its consequences for life expectancy: a life-table analysis. Ann Intern Med. 2003; 138: 24–32.
[Abstract/Free Full Text] - www.who.int/mediacentre/news/release/2005
- Flegal KM, Graubard BI, Williamson DF, Gail MH. Excess deaths associated with underweight, overweight, and obesity. JAMA. 2005; 293: 1861–1867.
[Abstract/Free Full Text] - www.cdc.gov/nccdphp/pe_factsheets
- Mokdad AH, Ford ES, Bowman BA, Dietz WH, Vinicor F, Bales VS, Marks JS. Prevalence of obesity, diabetes, and obesity-related health risk factors, 2001. JAMA. 2003; 289: 76–79.
[Abstract/Free Full Text] - Centers for Disease Control and Prevention (CDC). Diabetes prevalence among American Indians and Alaska Natives and the overall population: United States, 1994–2002. MMWR. 2003: 52: 702–704.[Medline]
[Order article via Infotrieve]
- Harris MI, Flegal KM, Cowie CC, Eberhardt MS, Goldstein DE, Little RR, Wiedmeyer HM, Byrd-Holt DD. Prevalence of diabetes, impaired fasting glucose, and impaired glucose tolerance in US adults: the Third National Health and Examination Survey, 1988–1994. Diabetes Care. 1998; 21: 518–524.[Abstract]
- Centers for Disease Control and Prevention (CDC). Prevalence of diabetes and impaired fasting glucose in adults: United States, 1999–2000. MMWR Morb Mortal Wkly Rep. 2003; 52: 833–837.[Medline]
[Order article via Infotrieve]
- Centers for Disease Control and Prevention (CDC). Prevalence of diabetes among Hispanics: selected areas, 1998-2002. MMWR Morb Mortal Wkly Rep. 2004; 53: 941–944.[Medline]
[Order article via Infotrieve]
- Wild S, Roglic G, Green A, Sicree R, King H. Global prevalence of diabetes: estimates for the year 2000 and projections for 2030. Diabetes Care. 2004; 27: 1047–1053.
[Abstract/Free Full Text] - National Diabetes Education Program. E-Newsletter. May 2004.
- Diabetes Surveillance Report, 1999. CDC, USDHHS.
- Centers for Disease Control and Prevention (CDC). Major cardiovascular disease (CVD) during 1997-1999 and major CVD hospital discharge rates in 1997 among women with diabetes: United States. MMWR. 2001; 50: 948–954.[Medline]
[Order article via Infotrieve]
- Almdal T, Scharling H, Jensen JS, Vestergaard H. The independent effect of type 2 diabetes mellitus on ischemic heart disease, stroke, and death: a population-based study of 13,000 men and women with 20 years of follow-up. Arch Intern Med. 2004; 164: 1422–1426.
[Abstract/Free Full Text] - Goldstein LB, Adams R, Becker K, Furberg CD, Gorelick PB, Hademenos G, Hill M, Howard G, Howard VJ, Jacobs B, Levine SR, Mosca L, Sacco RL, Sherman DG, Wolf PA, del Zoppo GJ. Primary prevention of ischemic stroke: a statement for healthcare professionals from the Stroke Council of the American Heart Association. Stroke. 2001; 32: 280–299.
[Free Full Text] - Utilization of Ambulatory Medical Care by Women: United States, 1997–98. NCHS. 2001.
- Imperatore G, Cadwell BL, Geiss L, Saadinne JB, Williams DE, Ford ES, Thompson TJ, Narayan KM, Gregg EW. Thirty-year trends in cardiovascular risk factors among US adults with diabetes: National Health and Nutrition surveys, 1971–2000. Am J Epidemiol. 2004; 160: 531–539.
[Abstract/Free Full Text] - The Burden of Chronic Diseases and Their Risk Factors. Atlanta, Ga: CDC/NCHS; February 2004.
- Winkleby MA, Cubbin C, Ahn DK, Kraemer HC. Pathways by which SES and ethnicity influence cardiovascular disease risk factors. Ann N Y Acad Sci. 1999; 896: 191–209.
[Abstract/Free Full Text] - Cook S, Weitzman M, Auinger P, Nguyen M, Dietz WH. Prevalence of a metabolic syndrome phenotype in adolescents: findings from the Third National Health and Nutrition Examination Survey, 1988–1994. Arch Pediatr Adolesc Med. 2003; 157: 821–827.
[Abstract/Free Full Text] - De Ferranti, et al. Prevalence of the metabolic syndrome in children using NHANES data. Circulation. 2003; 108: IV-727. Abstract 3286.
- Weiss R, Dziura J, Burgert TS, Tamborlane WV, Taksali SE, Yeckel CW, Allen K, Lopes M, Savoye M, Morrison J, Sherwin RS, Caprio S. Obesity and the metabolic syndrome in children and adolescents. N Engl J Med. 2004; 350: 2362–2374.
[Abstract/Free Full Text] - Ford ES, Giles WH, Dietz WH. Prevalence of the metabolic syndrome among US adults: findings from the Third National Health and Examination Survey. JAMA. 2002; 287: 356–359.
[Abstract/Free Full Text] - Park YW, Zhu S, Palaniappan L, Heshka S, Carnethon MR, Heymsfield SB. The metabolic syndrome prevalence and associated risk factor findings in the US population from the Third National Health and Nutrition Examination Survey, 1988–1994. Arch Intern Med. 2003; 163: 427–436.
[Abstract/Free Full Text] - McNeill AM, Rosamond WD, Girman CJ, Heiss G, Golden SH, Duncan BB, East HE, Ballantyne C. Prevalence of coronary heart disease and carotid artery thickening in patients with the metabolic syndrome (the ARIC Study). Am J Cardiol. 2004; 94: 1249–1254.[CrossRef][Medline]
[Order article via Infotrieve]
- Malik S, Wong ND, Franklin SS, Kamath TV, L’Italien GJ, Pio JR, Williams GR. Impact of the metabolic syndrome on mortality from coronary heart disease, cardiovascular disease, and all causes in United States adults. Circulation. 2004; 110: 1245–1250.
[Abstract/Free Full Text] - www.ers.usda.gov/briefing/consumption.
- Popkin BM, Siega-Riz AM, Haines PS, Jahns L. Where’s the fat? Trends in U.S. diets, 1965–96. Prev Med. 2001; 32: 245–254.[CrossRef][Medline]
[Order article via Infotrieve]
- Federal Interagency Forum on Child and Family Statistics. America’s Children: Key National Indicators of Well-Being. Washington, DC: US Government Printing Office; 2003.
- Putnam J, et al. U.S. per capita food supply trends. Food Review [USDA]. Winter 2002. Available at: http://ers.usda.gov/publications/FoodReview/DEC2002/frvol25i3a.pdf.
- Nielsen, SJ, Popkin BM. Patterns and trends in food portion sizes, 1977–1998. JAMA. 2003; 289: 450–453.
[Abstract/Free Full Text] - Mozaffarian D, Kumanyika SK, Lemaitre RN, Olson JL, Burke GL, Siscovick DS. Cereal, fruit, and vegetable fiber intake and the risk of cardiovascular disease in elderly individuals. JAMA. 2003; 289: 1659–1666.
[Abstract/Free Full Text] - Enns CW, et al. Trends in food and nutrient intakes by children in the United States. Fam Econ Nutr Rev. 2002; 14: 56–68.
- Appel LJ, Moore TJ, Obarzanek E, Vollmer WM, Svetkey LP, Sacks FM, Bray GA, Vogt TM, Cutler JA, Windhauser MM, Lin PH, Karanja N. A clinical trial of the effects of diet patterns on blood pressure: DASH Collaborative Research Group. N Engl J Med. 1997; 336: 1117–1112.
[Abstract/Free Full Text] - YRBS, U.S., 2003, MMWR, Vol. 53, No. SS-2, May 21, 2004, CDC
- Gleason P, et al. Children’s Diets in the Mid-1990s. Alexandria, Va: US Department of Agriculture; 2001.
- YES Occasional Papers. Ann Arbor, Mich: Institute for Social Research, May 2003. Paper 3.
- Institute of Medicine, Committee on Quality of Health Care in America. Crossing the Quality Chasm: A New Health System for the 21st Century. Washington, DC: National Academy Press; 2001: 232.
- Spertus JA, Eagle KA, Krumholz HM, Mitchell KR, Normand SL, for the American College of Cardiology, American Heart Association Task Force on Performance Measures. American College of Cardiology and American Heart Association methodology for the selection and creation of performance measures for quantifying the quality of cardiovascular care. Circulation. 2005; 111: 1703–1712.
[Abstract/Free Full Text] - Williams SC, Schmaltz SP, Morton DJ, Koss RG, Loeb JM. Quality of care in U.S. hospitals as reflected by standardized measures 2002–2004. N Engl J Med. 2005; 353: 255–264.
[Abstract/Free Full Text] - Jha AK, Li Z, Orav EJ, Epstein AM. Care in U.S. hospitals: the Hospital Quality Alliance program. N Engl J Med. 2005; 353: 265–274.
[Abstract/Free Full Text] - Tapson VF, Hyers TM, Waldo AL, Ballard DJ, Becker RC, Caprini JA, Khetan R, Wittkowsky AK, Colgan KJ, Shillington AC, for the NABOR (National Anticoagulation Benchmark and Outcomes Report) Steering Committee. Antithrombotic therapy practices in US hospitals in an era of practice guidelines. Arch Intern Med. 2005; 165: 1458–1464.
[Abstract/Free Full Text] - Trivedi AN, Zaslavsky AM, Schneider EC, Ayanian JZ. Trends in the quality of care and racial disparities in Medicare managed care. N Engl J Med. 2005; 353: 692–700.
[Abstract/Free Full Text] - Jha AK, Fisher ES, Li Z, Orav EJ, Epstein AM. Racial trends in the use of major procedures among the elderly. N Engl J Med. 2005; 353: 683–691.
[Abstract/Free Full Text] - Vaccarino V, Rathore SS, Wenger NK, Frederick PD, Abramson JL, Barron HV, Manhapra A, Mallik S, Krumholz HM, for the National Registry of Myocardial Infarction Investigators. Sex and racial differences in the management of acute myocardial infarction, 1994 through 2002. N Engl J Med. 2005; 353: 671–682.
[Abstract/Free Full Text] - Agency for Healthcare Research and Quality, Healthcare Cost and Utilization Project, HCUPnet, hcup.ahrq.gov.
- Eisenberg MJ, Filion KB, Azoulay A, Brox AC, Haider S, Pilote L. Outcomes and cost of coronary artery bypass graft surgery in the United States and Canada. Arch Intern Med. 2005; 165: 1506–1513.
[Abstract/Free Full Text] - Health Care in America: Trends in Utilization. CDC/NCHS. 2003.
- MMWR Morb Mortal Wkly Rep. 2005; 54: 310.
- Hodgson TA, Cohen AJ. Medical care expenditures for selected circulatory diseases: opportunities for reducing national health expenditures. Med Care. 1999; 37: 994–1012.[CrossRef][Medline]
[Order article via Infotrieve]
- National health expenditures amounts, and average annual percent change, by type of expenditure: selected calendar years 1990–2013. Available at: cms.hhs.gov.
- Rice DP, Hodgson TA, Kopstein AN. The economic costs of illness: a replication and update. Health Care Financ Rev. 1985; 7: 61–80.[Medline]
[Order article via Infotrieve]
- Deaths for 358 selected causes by 5-year age groups, race, and sex, United States, 2002. Available at: cdc.nchs/default/htm.
This article has been cited by other articles:
 |
B.-A. Nguyen-Khoa, E. L. Goehring Jr, W. Werther, E. W. Gower, D. V. Do, and J. K. Jones Hospitalized Cardiovascular Diseases in Neovascular Age-Related Macular Degeneration Arch Ophthalmol, September 1, 2008; 126(9): 1280 - 1286. [Abstract] [Full Text] [PDF] |
||||
 |
K. J. Anstrom, D. F. Kong, L. K. Shaw, R. M. Califf, J. M. Kramer, E. D. Peterson, S. V. Rao, D. B. Matchar, D. B. Mark, R. A. Harrington, et al. Long-term Clinical Outcomes Following Coronary Stenting Arch Intern Med, August 11, 2008; 168(15): 1647 - 1655. [Abstract] [Full Text] [PDF] |
||||
 |
V. Mehta, R. E. Peterson, and W. Heideman 2,3,7,8-Tetrachlorodibenzo-p-dioxin Exposure Prevents Cardiac Valve Formation in Developing Zebrafish Toxicol. Sci., August 1, 2008; 104(2): 303 - 311. [Abstract] [Full Text] [PDF] |
||||
 |
J. Butler, A. Kalogeropoulos, V. Georgiopoulou, R. Belue, N. Rodondi, M. Garcia, D. C. Bauer, S. Satterfield, A. L. Smith, V. Vaccarino, et al. Incident Heart Failure Prediction in the Elderly: The Health ABC Heart Failure Score Circ Heart Fail, July 1, 2008; 1(2): 125 - 133. [Abstract] [Full Text] [PDF] |
||||
 |
C. A. Warnes Sex Differences in Congenital Heart Disease: Should a Woman Be More Like a Man? Circulation, July 1, 2008; 118(1): 3 - 5. [Full Text] [PDF] |
||||
 |
T. Koyanagi, L. Y. Wong, K. Inagaki, O. V. Petrauskene, and D. Mochly-Rosen Alteration of gene expression during progression of hypertension-induced cardiac dysfunction in rats Am J Physiol Heart Circ Physiol, July 1, 2008; 295(1): H220 - H226. [Abstract] [Full Text] [PDF] |
||||
 |
T. G. Pickering, N. H. Miller, G. Ogedegbe, L. R. Krakoff, N. T. Artinian, and D. Goff Call to Action on Use and Reimbursement for Home Blood Pressure Monitoring: A Joint Scientific Statement From the American Heart Association, American Society of Hypertension, and Preventive Cardiovascular Nurses Association Hypertension, July 1, 2008; 52(1): 10 - 29. [Abstract] [Full Text] [PDF] |
||||
|
|
R. G. Victor, D. Leonard, P. Hess, D. G. Bhat, J. Jones, P. A. C. Vaeth, J. Ravenell, A. Freeman, R. P. Wilson, and R. W. Haley Factors Associated With Hypertension Awareness, Treatment, and Control in Dallas County, Texas Arch Intern Med, June 23, 2008; 168(12): 1285 - 1293. [Abstract] [Full Text] [PDF] |
||||
|
|
D. Mozaffarian, P. W.F. Wilson, and W. B. Kannel Beyond Established and Novel Risk Factors: Lifestyle Risk Factors for Cardiovascular Disease Circulation, June 10, 2008; 117(23): 3031 - 3038. [Full Text] [PDF] |
||||
 |
F. Baldazzi, E. Jorgensen, R. S. Ripa, and J. Kastrup Release of biomarkers of myocardial damage after direct intramyocardial injection of genes and stem cells via the percutaneous transluminal route Eur. Heart J., June 4, 2008; (2008) ehn233v1. [Abstract] [Full Text] [PDF] |
||||
 |
D. Mozaffarian Fish and n-3 fatty acids for the prevention of fatal coronary heart disease and sudden cardiac death Am. J. Clinical Nutrition, June 1, 2008; 87(6): 1991S - 1996S. [Abstract] [Full Text] [PDF] |
||||
 |
N. F. Mamoun, M. Xu, D. I. Sessler, J. F. Sabik, and C. A. Bashour Propensity matched comparison of outcomes in older and younger patients after coronary artery bypass graft surgery. Ann. Thorac. Surg., June 1, 2008; 85(6): 1974 - 1979. [Abstract] [Full Text] [PDF] |
||||
 |
H. Taylor, J. Liu, G. Wilson, S. H. Golden, E. Crook, C. D. Brunson, M. Steffes, W. D. Johnson, and J. H. Sung Distinct Component Profiles and High Risk Among African Americans With Metabolic Syndrome: The Jackson Heart Study Diabetes Care, June 1, 2008; 31(6): 1248 - 1253. [Abstract] [Full Text] [PDF] |
||||
 |
A. Kelley-Hedgepeth, D. M. Lloyd-Jones, A. Colvin, K. A. Matthews, J. Johnston, M. R. Sowers, B. Sternfeld, R. C. Pasternak, C. U. Chae, and for the SWAN Investigators Ethnic Differences in C-Reactive Protein Concentrations Clin. Chem., June 1, 2008; 54(6): 1027 - 1037. [Abstract] [Full Text] [PDF] |
||||
 |
J. D. Douketis, P. B. Berger, A. S. Dunn, A. K. Jaffer, A. C. Spyropoulos, R. C. Becker, and J. Ansell The Perioperative Management of Antithrombotic Therapy: American College of Chest Physicians Evidence-Based Clinical Practice Guidelines (8th Edition) Chest, June 1, 2008; 133(6_suppl): 299S - 339S. [Abstract] [Full Text] [PDF] |
||||
|
|
E. O'Brien Ambulatory Blood Pressure Measurement: The Case for Implementation in Primary Care Hypertension, June 1, 2008; 51(6): 1435 - 1441. [Full Text] [PDF] |
||||
 |
R. G. Robinson, R. E. Jorge, D. J. Moser, L. Acion, A. Solodkin, S. L. Small, P. Fonzetti, M. Hegel, and S. Arndt Escitalopram and Problem-Solving Therapy for Prevention of Poststroke Depression: A Randomized Controlled Trial JAMA, May 28, 2008; 299(20): 2391 - 2400. [Abstract] [Full Text] [PDF] |
||||
 |
J.-A. Eastwood, L. Doering, J. Roper, and R. D. Hays Uncertainty and Health-Related Quality of Life 1 Year After Coronary Angiography Am. J. Crit. Care., May 1, 2008; 17(3): 232 - 242. [Abstract] [Full Text] [PDF] |
||||
|
|
L. M. Fedoruk, H. Wang, M. R. Conaway, I. L. Kron, and K. C. Johnston Statin therapy improves outcomes after valvular heart surgery. Ann. Thorac. Surg., May 1, 2008; 85(5): 1521 - 1525. [Abstract] [Full Text] [PDF] |
||||
|
|
R. Movva and D. J. Rader Laboratory Assessment of HDL Heterogeneity and Function Clin. Chem., May 1, 2008; 54(5): 788 - 800. [Abstract] [Full Text] [PDF] |
||||
 |
K. J. Ottenbacher, J. Campbell, Y.-F. Kuo, A. Deutsch, G. V. Ostir, and C. V. Granger Racial and Ethnic Differences in Postacute Rehabilitation Outcomes After Stroke in the United States Stroke, May 1, 2008; 39(5): 1514 - 1519. [Abstract] [Full Text] [PDF] |
||||
|
|
J. Ma and R. S. Stafford Screening, Treatment, and Control of Hypertension in US Private Physician Offices, 2003-2004 Hypertension, May 1, 2008; 51(5): 1275 - 1281. [Abstract] [Full Text] [PDF] |
||||
|
|
D. Darbar, P. J. Kannankeril, B. S. Donahue, G. Kucera, T. Stubblefield, J. L. Haines, A. L. George Jr, and D. M. Roden Cardiac Sodium Channel (SCN5A) Variants Associated with Atrial Fibrillation Circulation, April 15, 2008; 117(15): 1927 - 1935. [Abstract] [Full Text] [PDF] |
||||
 |
B. I. Jugdutt and A. Jelani Aging and Defective Healing, Adverse Remodeling, and Blunted Post-Conditioning in the Reperfused Wounded Heart J. Am. Coll. Cardiol., April 8, 2008; 51(14): 1399 - 1403. [Full Text] [PDF] |
||||
 |
R. K. Voeller, M. S. Bailey, A. Zierer, S. C. Lall, S.-i. Sakamoto, K. Aubuchon, J. S. Lawton, N. Moazami, C. B. Huddleston, N. A. Munfakh, et al. Isolating the entire posterior left atrium improves surgical outcomes after the Cox maze procedure. J. Thorac. Cardiovasc. Surg., April 1, 2008; 135(4): 870 - 877. [Abstract] [Full Text] [PDF] |
||||
 |
E. W Miller, S. A Combs, C. Fish, B. Bense, A. Owens, and A. Burch Running Training After Stroke: A Single-Subject Report Physical Therapy, April 1, 2008; 88(4): 511 - 522. [Abstract] [Full Text] [PDF] |
||||
|
|
R. Sherva, M. B. Miller, J. S. Pankow, S. C. Hunt, E. Boerwinkle, T. H. Mosley, A. B. Weder, J. D. Curb, A. Luke, A. C. Morrison, et al. A Whole-Genome Scan for Stroke or Myocardial Infarction in Family Blood Pressure Program Families Stroke, April 1, 2008; 39(4): 1115 - 1120. [Abstract] [Full Text] [PDF] |
||||
|
|
P. Verro, P. B. Gorelick, and D. Nguyen Aspirin Plus Dipyridamole Versus Aspirin for Prevention of Vascular Events After Stroke or TIA: A Meta-Analysis Stroke, April 1, 2008; 39(4): 1358 - 1363. [Abstract] [Full Text] [PDF] |
||||
|
|
M. Pho, W. Lee, D. R. Watt, C. Laschinger, C. A. Simmons, and C. A. McCulloch Cofilin is a marker of myofibroblast differentiation in cells from porcine aortic cardiac valves Am J Physiol Heart Circ Physiol, April 1, 2008; 294(4): H1767 - H1778. [Abstract] [Full Text] [PDF] |
||||
 |
W. S. Weintraub and G. A. Diamond Predicting Cardiovascular Events with Coronary Calcium Scoring N. Engl. J. Med., March 27, 2008; 358(13): 1394 - 1396. [Full Text] [PDF] |
||||
|
|
R. C. Bourge, W. T. Abraham, P. B. Adamson, M. F. Aaron, J. M. Aranda Jr, A. Magalski, M. R. Zile, A. L. Smith, F. W. Smart, M. A. O'Shaughnessy, et al. Randomized controlled trial of an implantable continuous hemodynamic monitor in patients with advanced heart failure: the COMPASS-HF study. J. Am. Coll. Cardiol., March 18, 2008; 51(11): 1073 - 1079. [Abstract] [Full Text] [PDF] |
||||
|
|
D. H. Smith, J. M. Kramer, N. Perrin, R. Platt, D. W. Roblin, K. Lane, M. Goodman, W. W. Nelson, X. Yang, and S. B. Soumerai A Randomized Trial of Direct-to-Patient Communication to Enhance Adherence to {beta}-Blocker Therapy Following Myocardial Infarction Arch Intern Med, March 10, 2008; 168(5): 477 - 483. [Abstract] [Full Text] [PDF] |
||||
 |
M. R. Vesely and V. Dilsizian Nuclear Cardiac Stress Testing in the Era of Molecular Medicine J. Nucl. Med., March 1, 2008; 49(3): 399 - 413. [Abstract] [Full Text] [PDF] |
||||
 |
J. K. Inrig, U. D. Patel, L. P. Briley, L. She, B. S. Gillespie, J. D. Easton, E. J. Topol, and L. A. Szczech Mortality, kidney disease and cardiac procedures following acute coronary syndrome Nephrol. Dial. Transplant., March 1, 2008; 23(3): 934 - 940. [Abstract] [Full Text] [PDF] |
||||
 |
A. O. Gramolini, T. Kislinger, R. Alikhani-Koopaei, V. Fong, N. J. Thompson, R. Isserlin, P. Sharma, G. Y. Oudit, M. G. Trivieri, A. Fagan, et al. Comparative Proteomics Profiling of a Phospholamban Mutant Mouse Model of Dilated Cardiomyopathy Reveals Progressive Intracellular Stress Responses Mol. Cell. Proteomics, March 1, 2008; 7(3): 519 - 533. [Abstract] [Full Text] [PDF] |
||||
 |
C. B. Roberts, A. I. Vines, J. S. Kaufman, and S. A. James Cross-Sectional Association between Perceived Discrimination and Hypertension in African-American Men and Women: The Pitt County Study Am. J. Epidemiol., March 1, 2008; 167(5): 624 - 632. [Abstract] [Full Text] [PDF] |
||||
 |
R. J DiDomenico, A. Perez, H. M Schumann, D. R Fontana, G. T Kondos, and G. T Schumock Impact of Treatment Guidelines on Clinical and Economic Outcomes of Acute Decompensated Heart Failure Ann. Pharmacother., March 1, 2008; 42(3): 327 - 333. [Abstract] [Full Text] [PDF] |
||||
|
|
P. M. Ho, D. J. Magid, S. M. Shetterly, K. L. Olson, P. N. Peterson, F. A. Masoudi, and J. S. Rumsfeld Importance of Therapy Intensification and Medication Nonadherence for Blood Pressure Control in Patients With Coronary Disease Arch Intern Med, February 11, 2008; 168(3): 271 - 276. [Abstract] [Full Text] [PDF] |
||||
 |
S. Prabhakaran, C. B. Wright, M. Yoshita, R. Delapaz, T. Brown, C. DeCarli, and R. L. Sacco Prevalence and determinants of subclinical brain infarction: The Northern Manhattan Study Neurology, February 5, 2008; 70(6): 425 - 430. [Abstract] [Full Text] [PDF] |
||||
|
|
H. R. Reynolds and J. S. Hochman Cardiogenic Shock: Current Concepts and Improving Outcomes Circulation, February 5, 2008; 117(5): 686 - 697. [Full Text] [PDF] |
||||
|
|
B. S. Abella, T. P. Aufderheide, B. Eigel, R. W. Hickey, W.T. Longstreth Jr, V. Nadkarni, G. Nichol, M. R. Sayre, C. E. Sommargren, and M. F. Hazinski Reducing Barriers for Implementation of Bystander-Initiated Cardiopulmonary Resuscitation: A Scientific Statement From the American Heart Association for Healthcare Providers, Policymakers, and Community Leaders Regarding the Effectiveness of Cardiopulmonary Resuscitation Circulation, February 5, 2008; 117(5): 704 - 709. [Full Text] [PDF] |
||||
|
|
F. Zannad, W. G. Stough, B. Pitt, J. G.F. Cleland, K. F. Adams, N. L. Geller, C. Torp-Pedersen, B.-A. Kirwan, and F. Follath Heart failure as an endpoint in heart failure and non-heart failure cardiovascular clinical trials: the need for a consensus definition Eur. Heart J., February 1, 2008; 29(3): 413 - 421. [Abstract] [Full Text] [PDF] |
||||
|
|
M. J. Magee, J. H. Alexander, G. Hafley, T. B. Ferguson Jr, C. M. Gibson, R. A. Harrington, E. D. Peterson, R. M. Califf, N. T. Kouchoukos, M. A. Herbert, et al. Coronary Artery Bypass Graft Failure After On-Pump and Off-Pump Coronary Artery Bypass: Findings From PREVENT IV Ann. Thorac. Surg., February 1, 2008; 85(2): 494 - 500. [Abstract] [Full Text] [PDF] |
||||
|
|
K. Lertsburapa, C. M. White, J. Kluger, O. Faheem, J. Hammond, and C. I. Coleman Preoperative statins for the prevention of atrial fibrillation after cardiothoracic surgery. J. Thorac. Cardiovasc. Surg., February 1, 2008; 135(2): 405 - 411. [Abstract] [Full Text] [PDF] |
||||
 |
A. Gupta, M. K. O'Malley, V. Patoglu, and C. Burgar Design, Control and Performance of RiceWrist: A Force Feedback Wrist Exoskeleton for Rehabilitation and Training The International Journal of Robotics Research, February 1, 2008; 27(2): 233 - 251. [Abstract] [PDF] |
||||
|
|
D. Kurnik, M. Muszkat, G. G. Sofowora, E. A. Friedman, W. D. Dupont, M. Scheinin, A. J.J. Wood, and C. M. Stein Ethnic and Genetic Determinants of Cardiovascular Response to the Selective {alpha}2-Adrenoceptor Agonist Dexmedetomidine Hypertension, February 1, 2008; 51(2): 406 - 411. [Abstract] [Full Text] [PDF] |
||||
|
|
H. R. Superko and S. King III Lipid Management to Reduce Cardiovascular Risk: A New Strategy Is Required Circulation, January 29, 2008; 117(4): 560 - 568. [Full Text] [PDF] |
||||
|
|
A. I. Lynch, E. Boerwinkle, B. R. Davis, C. E. Ford, J. H. Eckfeldt, C. Leiendecker-Foster, and D. K. Arnett Pharmacogenetic Association of the NPPA T2238C Genetic Variant With Cardiovascular Disease Outcomes in Patients With Hypertension JAMA, January 23, 2008; 299(3): 296 - 307. [Abstract] [Full Text] [PDF] |
||||
|
|
D. L. Leslie, E. R. Marcantonio, Y. Zhang, L. Leo-Summers, and S. K. Inouye One-Year Health Care Costs Associated With Delirium in the Elderly Population Arch Intern Med, January 14, 2008; 168(1): 27 - 32. [Abstract] [Full Text] [PDF] |
||||
 |
T. F. Luscher and J. Steffel Sweet and Sour: Unraveling Diabetic Vascular Disease Circ. Res., January 4, 2008; 102(1): 9 - 11. [Full Text] [PDF] |
||||
|
|
H. A. DeVon, C. J. Ryan, A. L. Ochs, and M. Shapiro Symptoms Across the Continuum of Acute Coronary Syndromes: Differences Between Women and Men Am. J. Crit. Care., January 1, 2008; 17(1): 14 - 24. [Abstract] [Full Text] [PDF] |
||||
|
|
C. J. Lavie and R. V. Milani Shedding light on high-density lipoprotein cholesterol: the post-ILLUMINATE era. J. Am. Coll. Cardiol., January 1, 2008; 51(1): 56 - 58. [Full Text] [PDF] |
||||
 |
R. F. Padera Jr. and F. J. Schoen Pathology of Cardiac Surgery Card. Surg. Adult, January 1, 2008; 3(2008): 111 - 178. [Full Text] |
||||
 |
T. Wolff, J. Guirguis-Blake, T. Miller, M. Gillespie, and R. Harris Screening for Carotid Artery Stenosis: An Update of the Evidence for the U.S. Preventive Services Task Force Ann Intern Med, December 18, 2007; 147(12): 860 - 870. [Abstract] [Full Text] [PDF] |
||||
|
|
W. D. Nelson, A. G. Zenovich, H. C. Ott, C. Stolen, G. J. Caron, A. Panoskaltsis-Mortari, S. A. Barnes III, X. Xin, and D. A. Taylor Sex-Dependent Attenuation of Plaque Growth After Treatment With Bone Marrow Mononuclear Cells Circ. Res., December 7, 2007; 101(12): 1319 - 1327. [Abstract] [Full Text] [PDF] |
||||
 |
R. A. Preston, P. Harvey, O. Herfert, G. Dykstra, J. W. Jukema, F. Sun, and D. Gillen A Randomized, Placebo-Controlled Trial to Evaluate the Efficacy, Safety, and Pharmacodynamic Interaction of Coadministered Amlodipine and Atorvastatin in 1660 Patients With Concomitant Hypertension and Dyslipidemia: The Respond Trial J. Clin. Pharmacol., December 1, 2007; 47(12): 1555 - 1569. [Abstract] [Full Text] [PDF] |
||||
 |
M. Hamon, R. Morello, J. W. Riddell, and M. Hamon Coronary Arteries: Diagnostic Performance of 16- versus 64-Section Spiral CT Compared with Invasive Coronary Angiography Meta-Analysis Radiology, December 1, 2007; 245(3): 720 - 731. [Abstract] [Full Text] [PDF] |
||||
|
|
H. L. Lujan and S. E. DiCarlo T5 spinal cord transection increases susceptibility to reperfusion-induced ventricular tachycardia by enhancing sympathetic activity in conscious rats Am J Physiol Heart Circ Physiol, December 1, 2007; 293(6): H3333 - H3339. [Abstract] [Full Text] [PDF] |
||||
|
|
J. Juhl Majersik, M. A. Smith, D. B. Zahuranec, B. N. Sanchez, and L. B. Morgenstern Population-Based Analysis of the Impact of Expanding the Time Window for Acute Stroke Treatment Stroke, December 1, 2007; 38(12): 3213 - 3217. [Abstract] [Full Text] [PDF] |
||||
|
|
R. J. Gibbons and S. D. Fihn Coronary Revascularization: New Evidence, New Challenges Ann Intern Med, November 20, 2007; 147(10): 732 - 734. [Full Text] [PDF] |
||||
 |
N. Rajagopalan, Y. F. Pung, Y. Z. Zhu, P. T. H. Wong, P. P. Kumar, and R. M. Kini {beta}-Cardiotoxin: a new three-finger toxin from Ophiophagus hannah (king cobra) venom with beta-blocker activity FASEB J, November 1, 2007; 21(13): 3685 - 3695. [Abstract] [Full Text] [PDF] |
||||
 |
S. Khella and M. B. Bleicher Stroke and Its Prevention in Chronic Kidney Disease Clin. J. Am. Soc. Nephrol., November 1, 2007; 2(6): 1343 - 1351. [Abstract] [Full Text] [PDF] |
||||
|
|
J. E. Acker III, A. M. Pancioli, T. J. Crocco, M. K. Eckstein, E. C. Jauch, H. Larrabee, N. M. Meltzer, W. C. Mergendahl, J. W. Munn, S. M. Prentiss, et al. Implementation Strategies for Emergency Medical Services Within Stroke Systems of Care: A Policy Statement From the American Heart Association/ American Stroke Association Expert Panel on Emergency Medical Services Systems and the Stroke Council Stroke, November 1, 2007; 38(11): 3097 - 3115. [Full Text] [PDF] |
||||
|
|
M. A. Allison, E. O. Lillie, D. DiTomasso, C. M. Wright, and M. H. Criqui Renal Artery Calcium Is Independently Associated With Hypertension J. Am. Coll. Cardiol., October 16, 2007; 50(16): 1578 - 1583. [Abstract] [Full Text] [PDF] |
||||
|
|
M. Fischer, B. Mayer, A. Baessler, G. Riegger, J. Erdmann, C. Hengstenberg, and H. Schunkert Familial aggregation of left main coronary artery disease and future risk of coronary events in asymptomatic siblings of affected patients Eur. Heart J., October 3, 2007; (2007) ehm377v1. [Abstract] [Full Text] [PDF] |
||||
|
|
S. I. Chaudhry, Y. Wang, J. Concato, T. M. Gill, and H. M. Krumholz Patterns of Weight Change Preceding Hospitalization for Heart Failure Circulation, October 2, 2007; 116(14): 1549 - 1554. [Abstract] [Full Text] [PDF] |
||||
|
|
R. J Johnson, M. S Segal, Y. Sautin, T. Nakagawa, D. I Feig, D.-H. Kang, M. S Gersch, S. Benner, and L. G Sanchez-Lozada Potential role of sugar (fructose) in the epidemic of hypertension, obesity and the metabolic syndrome, diabetes, kidney disease, and cardiovascular disease Am. J. Clinical Nutrition, October 1, 2007; 86(4): 899 - 906. [Abstract] [Full Text] [PDF] |
||||
 |
A. Behfar and A. Terzic Cardioprotective repair through stem cell-based cardiopoiesis J Appl Physiol, October 1, 2007; 103(4): 1438 - 1440. [Abstract] [Full Text] [PDF] |
||||
 |
G. T. Wilson, P. Gopalakrishnan, and T. Tak Noninvasive Cardiac Imaging with Computed Tomography Clin. Med. Res., October 1, 2007; 5(3): 165 - 171. [Abstract] [Full Text] [PDF] |
||||
 |
R. J. Westrick, M. E. Winn, and D. T. Eitzman Murine Models of Vascular Thrombosis Arterioscler. Thromb. Vasc. Biol., October 1, 2007; 27(10): 2079 - 2093. [Abstract] [Full Text] [PDF] |
||||
 |
C. S. Rigsby, A. E. Burch, S. Ogbi, D. M. Pollock, and A. M. Dorrance Intact female stroke-prone hypertensive rats lack responsiveness to mineralocorticoid receptor antagonists Am J Physiol Regulatory Integrative Comp Physiol, October 1, 2007; 293(4): R1754 - R1763. [Abstract] [Full Text] [PDF] |
||||
|
|
E. R. Fox, N. Alnabhan, A. D. Penman, K. R. Butler, H. A. Taylor Jr, T. N. Skelton, and T. H. Mosley Jr Echocardiographic Left Ventricular Mass Index Predicts Incident Stroke in African Americans: Atherosclerosis Risk in Communities (ARIC) Study Stroke, October 1, 2007; 38(10): 2686 - 2691. [Abstract] [Full Text] [PDF] |
||||
|
|
S. H. Goldbarg, S. Elmariah, M. A. Miller, and V. Fuster Insights Into Degenerative Aortic Valve Disease J. Am. Coll. Cardiol., September 25, 2007; 50(13): 1205 - 1213. [Abstract] [Full Text] [PDF] |
||||
|
|
L. B. Goldstein Acute Ischemic Stroke Treatment in 2007 Circulation, September 25, 2007; 116(13): 1504 - 1514. [Full Text] [PDF] |
||||
|
|
K. Nasir, L. J. Shaw, S. T. Liu, S. R. Weinstein, T. R. Mosler, P. R. Flores, F. R. Flores, P. Raggi, D. S. Berman, R. S. Blumenthal, et al. Ethnic Differences in the Prognostic Value of Coronary Artery Calcification for All-Cause Mortality J. Am. Coll. Cardiol., September 4, 2007; 50(10): 953 - 960. [Abstract] [Full Text] [PDF] |
||||
|
|
A. C. Shuros, R. W. Salo, V. G. Florea, J. Pastore, M. A. Kuskowski, Y. Chandrashekhar, and I. S. Anand Ventricular Preexcitation Modulates Strain and Attenuates Cardiac Remodeling in a Swine Model of Myocardial Infarction Circulation, September 4, 2007; 116(10): 1162 - 1169. [Abstract] [Full Text] [PDF] |
||||
 |
A. H. Friedlander CALCIFIED CAROTID ARTERY ATHEROMAS J Am Dent Assoc, September 1, 2007; 138(9): 1191 - 1192. [Full Text] [PDF] |
||||
|
|
M. M. Luke, J. P. Kane, D. M. Liu, C. M. Rowland, D. Shiffman, J. Cassano, J. J. Catanese, C. R. Pullinger, D. U. Leong, A. R. Arellano, et al. A Polymorphism in the Protease-Like Domain of Apolipoprotein(a) Is Associated With Severe Coronary Artery Disease Arterioscler. Thromb. Vasc. Biol., September 1, 2007; 27(9): 2030 - 2036. [Abstract] [Full Text] [PDF] |
||||
 |
S. E. Hofkamp, C. A. Henrikson, and S. T. Wegener An Interactive Model of Pain and Myocardial Ischemia Psychosom Med, September 1, 2007; 69(7): 632 - 639. [Abstract] [Full Text] [PDF] |
||||
 |
P. Jais and D. L. Packer Ablation vs. drug use for atrial fibrillation Eur. Heart J. Suppl., September 1, 2007; 9(suppl_G): G26 - G34. [Abstract] [Full Text] [PDF] |
||||
 |
R. Valdez, K. J. Greenlund, M. J. Khoury, and P. W. Yoon Is Family History a Useful Tool for Detecting Children at Risk for Diabetes and Cardiovascular Diseases? A Public Health Perspective Pediatrics, September 1, 2007; 120(SUPPLEMENT_2): S78 - S86. [Abstract] [Full Text] [PDF] |
||||
|
|
J. A. Ezekowitz, B. H. Rowe, D. M. Dryden, N. Hooton, B. Vandermeer, C. Spooner, and F. A. McAlister Systematic Review: Implantable Cardioverter Defibrillators for Adults with Left Ventricular Systolic Dysfunction Ann Intern Med, August 21, 2007; 147(4): 251 - 262. [Abstract] [Full Text] [PDF] |
||||
|
|
S. M. Donahoe, G. C. Stewart, C. H. McCabe, S. Mohanavelu, S. A. Murphy, C. P. Cannon, and E. M. Antman Diabetes and Mortality Following Acute Coronary Syndromes JAMA, August 15, 2007; 298(7): 765 - 775. [Abstract] [Full Text] [PDF] |
||||
|
|
I. Kardys, R. Vliegenthart, M. Oudkerk, A. Hofman, and J. C. M. Witteman The Female Advantage in Cardiovascular Disease: Do Vascular Beds Contribute Equally? Am. J. Epidemiol., August 15, 2007; 166(4): 403 - 412. [Abstract] [Full Text] [PDF] |
||||
 |
E. Atallah, J.-B. Durand, H. Kantarjian, and J. Cortes Congestive heart failure is a rare event in patients receiving imatinib therapy Blood, August 15, 2007; 110(4): 1233 - 1237. [Abstract] [Full Text] [PDF] |
||||
|
|
D. V. Menon, Z. Wang, P. J. Fadel, D. Arbique, D. Leonard, J.-L. Li, R. G. Victor, and W. Vongpatanasin Central Sympatholysis as a Novel Countermeasure for Cocaine-Induced Sympathetic Activation and Vasoconstriction in Humans J. Am. Coll. Cardiol., August 14, 2007; 50(7): 626 - 633. [Abstract] [Full Text] [PDF] |
||||
|
|
J. L. Anderson, C. D. Adams, E. M. Antman, C. R. Bridges, R. M. Califf, D. E. Casey Jr, W. E. Chavey II, F. M. Fesmire, J. S. Hochman, T. N. Levin, et al. ACC/AHA 2007 Guidelines for the Management of Patients With Unstable Angina/Non ST-Elevation Myocardial Infarction Executive Summary: A Report of the American College of Cardiology/American Heart Association Task Force on Practice Guidelines (Writing Committee to Revise the 2002 Guidelines for the Management of Patients With Unstable Angina/Non ST-Elevation Myocardial Infarction) Developed in Collaboration with the American College of Emergency Physicians, the Society for Cardiovascular Angiography and Interventions, and the Society of Thoracic Surgeons Endorsed by the American Association of Cardiovascular and Pulmonary Rehabilitation and the Society for Academic Emergency Medicine J. Am. Coll. Cardiol., August 14, 2007; 50(7): 652 - 726. [Full Text] [PDF] |
||||
|
|
J. D. Snoep, M. M. C. Hovens, J. C. J. Eikenboom, J. G. van der Bom, and M. V. Huisman Association of Laboratory-Defined Aspirin Resistance With a Higher Risk of Recurrent Cardiovascular Events: A Systematic Review and Meta-analysis Arch Intern Med, August 13, 2007; 167(15): 1593 - 1599. [Abstract] [Full Text] [PDF] |
||||
|
|
G. A. Lin, R. A. Dudley, and R. F. Redberg Cardiologists' Use of Percutaneous Coronary Interventions for Stable Coronary Artery Disease Arch Intern Med, August 13, 2007; 167(15): 1604 - 1609. [Abstract] [Full Text] [PDF] |
||||
| ||||||||||||||||||||||||||||||||||||||||||||||||||||||||||||||||||||||||||||||||||||||||||||