| US Imports of Steel Mill Products | |||
| FOR Ingots and Steel for Castings -- C & A |
|||
| Average Unit Value in US$ per Metric Ton | |||
| Same Table - Metric Tons |
Same Table - US Dollars |
||
| 'C & A' = Carbon and Alloy products, 'S' = Stainless products | |||
| Graph | Country | Census Data | Preliminary Census Data |
License Data | |||||||||||||
|---|---|---|---|---|---|---|---|---|---|---|---|---|---|---|---|---|---|
| FEB08 | MAR08 | APR08 | MAY08 | JUN08 | JUL08 | AUG08 | SEP08 | OCT08 | NOV08 | DEC08 | JAN09 | FEB09 | MAR09 | MAR09 | APR09 | ||
| M | WORLD | $823 | $1,805 | $1,420 | $1,494 | $1,778 | $1,865 | $2,810 | $1,487 | $2,228 | $3,399 | $3,321 | $3,934 | $2,805 | $3,453 | $1,733 | $3,245 |
| M | ITALY | . | $2,878 | . | $2,922 | $2,276 | . | $2,922 | $2,922 | $3,799 | $3,884 | $4,184 | $4,088 | $3,884 | $3,704 | $1,661 | $3,513 |
| M | CANADA | $831 | $824 | $792 | $826 | $847 | $875 | . | $764 | $728 | $534 | $584 | . | $769 | $897 | $900 | $1,874 |
| M | BELGIUM | . | . | $1,264 | $1,315 | . | $1,365 | . | . | . | . | . | . | . | . | . | . |
| M | UNITED KINGDOM | . | . | $2,640 | $5,891 | $3,163 | $14,281 | $2,845 | . | $5,126 | . | $895 | $3,743 | $4,182 | $1,537 | $10,660 | . |
| M | UKRAINE | . | . | . | . | . | . | $2,359 | . | . | $2,991 | . | . | . | . | $11,000 | $1,553 |
| M | NETHERLANDS | . | . | $2,417 | . | . | . | . | . | . | . | . | . | . | . | . | . |
| M | FRANCE | . | . | . | . | . | . | . | . | . | $2,012 | . | . | $1,109 | . | . | . |
| M | CHINA | $1,276 | $1,762 | $1,605 | $518 | $518 | $2,970 | . | . | . | $1,039 | . | $715 | $5,854 | . | $9,778 | $3,556 |
| M | AUSTRALIA | . | . | . | . | . | . | . | . | . | . | . | $1,331 | $3,468 | $23,699 | $23,699 | . |
| M | INDIA | $518 | $2,243 | . | . | . | . | . | . | $2,606 | $2,556 | . | . | . | . | . | . |
| M | MEXICO | . | . | . | . | . | . | . | . | $440 | . | . | $1,014 | . | . | . | . |
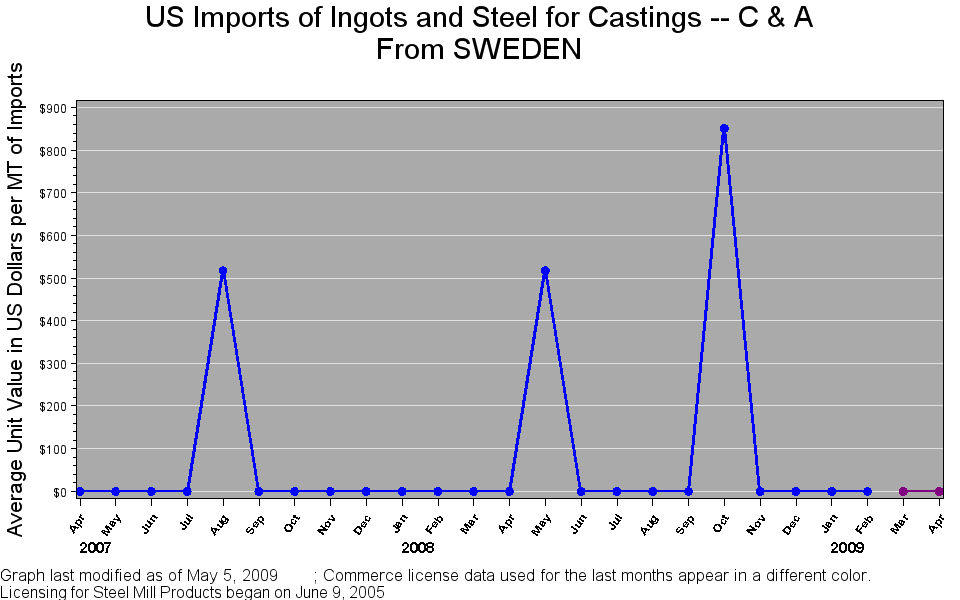
| M | SWEDEN | . | . | . | $518 | . | . | . | . | $851 | . | . | . | . | . | . | . |
| M | JAPAN | $518 | $518 | . | . | . | . | . | . | . | . | . | . | . | . | . | . |
| M | GERMANY | . | . | . | . | . | . | . | . | . | . | . | . | . | . | $31,000 | . |
| M | HONG KONG | . | . | . | . | . | . | . | . | . | . | . | . | . | . | $28,293 | . |
| M | SINGAPORE | . | . | . | . | . | . | . | . | . | . | . | . | . | . | $918,261 | $800,000 |
| M | TAIWAN | . | . | . | . | . | . | . | . | . | . | . | . | . | . | $756 | . |
| M | UNITED STATES | . | . | . | . | . | . | . | . | . | . | . | . | . | . | $2,183 | . |
| SOURCE: US Department of Commerce, Import Administration |
| Table last modified on: May 5, 2009, with |
| Licensing data collected through May 5, 2009 and |
| Preliminary Census data compiled through March 2009 |
| Data listed in order of descending volume imported during last THREE months of Census data, including peliminary data |
| Steel mill categories are defined by 10-digit HTS codes |
| Data extracted from the import licenses are not official Census data |
| To see License Data at HTS 6-digit level click on chart title at the top of the page. |
| Link to Annual Summary of Census Data |
| Link to Summary Level of Monthly Census Data |