
 | |||||||||||
|
|||||||||||
Virginia School Drives Up Achievement With Data-Driven Decisions
| ||||||||||||||||||||||||||
Ocean View Elementary School Principal Lauren Campsen contends that there is indeed a silver bullet for improving education for all students—at least at her Norfolk, Va., school, where the achievement gap has been virtually eradicated.
She credits data-driven decision making, in which student outcomes inform decisions affecting student learning, with narrowing the margin in performance between white students and their ethnic minority peers, who historically have lagged behind at the school.
In fact, at Ocean View—a 2008 recipient of the U.S. Department of Education's Blue Ribbon Award—the students are doing about equally well. In reading, 100 percent of Hispanic students and 99 percent of black students followed by 94 percent of white students in grades 3-5 performed at proficient or advanced levels on the latest state exam. Results were similar in math, in which 100 percent of Hispanic students, 97 percent of white students and 93 percent of black students scored at grade level or above.
 Principal Lauren Campsen joined by kindergarten students-of-the-month. 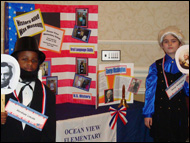 Third-grader Malkym as Abraham Lincoln and fourth-grader Arthur as George Washington pose for the school's "History Alive Wax Museum."  Fifth-grade maritime rangers pull up a trolley net during a trip on the Chesapeake Bay. |
"The secret to getting rid of the achievement gap is to have everybody proficient," says Campsen, who was one of five principals the Department honored last year with the Terrel H. Bell Award for outstanding leadership.
While the school reached that goal in the fifth grade in 2008, with every student achieving Virginia's Standards of Learning (SOL) in reading, writing and science, Campsen is hoping to shrink the gap to under 3 percent this year at other grade levels.
Collecting Data vs. Using It
Pointing to one of the data charts posted outside of her office, Campsen says that promoting educational equity in an urban school with black and white populations that are nearly equal and a small percentage of Hispanic students "looks like that," as she traces with her finger a line that slides from 30 to 0 percent. The chart illustrates the reading achievement gap among fifth-graders that has faded over the past seven years.
Scores overall have risen sharply ever since Ocean View implemented the data-driven decision-making model at the start of the 2001-02 school year. Campsen received training the previous summer at the Colorado-based Center for Performance Assessments (now called the Leadership and Learning Center) on how to effectively use test-score data to make administrative and instructional decisions that would improve student achievement. She in turn taught her staff how to collect data and assemble it in binders.
Presuming the newly adopted strategy would raise two years' of slumping proficiency rates since the state first began testing, Campsen looked forward to receiving the results with great anticipation. But when the data came in, she noticed there was little difference. "I was in tears, because we had worked so hard organizing our data notebooks," she recalls. She says she realized after that "there's collecting data, then there's using it."
Yet, still hopeful by the slight progress, Campsen returned to the center the following summer for additional training. This time she learned about building the leadership capacity of the school by creating vertical data teams, assembling teachers across grade levels to examine student data by subject. She reorganized the school around this concept right before the 2002-03 school year, handpicking four instructional specialists as team leaders for each core subject.
At the end of the school year, the scores were released—publicly for the first time over the Internet—to the amazement of Ocean View's educators. Third-grade reading and math, for instance, increased by an average of 27 percentage points from 2002 to 2003 (54 to 77 percent proficient and 58 to 89 percent proficient, respectively). The gains proved that the new system, which called for additional assessments to monitor students' academic needs, was worthwhile, as one reluctant teacher admitted.
"He looked at me and said, 'I guess all those things you made us do really do work,'" says Campsen. "And you can talk to people in this building—I'm sure they're going to tell you the same thing—they wouldn't go back to the way it was before. They just can't imagine how you can teach without knowing where your kids are on a consistent basis."
Debbie Price, who is teaching in her ninth year at Ocean View, agrees. "I can look at my 20 students and everybody looks like they're doing a great job—everybody's answering the questions, they're participating. But what they're doing is participating only on the questions they know. So through data—it's very concrete—I can see who still doesn't know something. ... I was missing kids before. I'm not missing them now."
Children Coming and Going
Preventing children from falling through the cracks can be a feat at a school with challenging demographics like Ocean View's. Nearly two-thirds of its 559 students receive federally subsidized meals, indicating a high-level of poverty. And, as one of the schools in the area serving military families stationed at Norfolk Naval Base, the world's largest base of its kind, Ocean View has a cultural diversity unlike that of the typical inner-city school with a relatively dominant racial group. Its population is dichotomous: 47 percent are black and 45 percent white, reflecting also the increasing integration of the neighborhood. Students from Hispanic and other racial groups account for the remaining 8 percent.
But the most troubling statistic is the mobility rate. One in four students transfers each year because their families are: in the low socio-economic strata, renting rather than owning homes and thereby more likely to move; in the military and often reassigned to another base; or homeless, living temporarily in a shelter. Campsen says the transient rate is also fueled by an inestimable group of "underground" homeless families who have no fixed address and reside with family or friends.
"Our great challenge is the children coming and going," she laments. "If we got them all in pre-K and kept them all the way through fifth grade, our challenge would be greatly reduced—even with the fact that we draw from mostly low socio-economic children."
Which is why Campsen says there is such a heavy reliance on data, not merely for accountability purposes to prove students are on grade level, but primarily for its diagnostic capabilities to identify where extra help should be targeted.
The data are drawn from a battery of tests. The state administers assessments annually, the district quarterly, and Ocean View assesses students' knowledge against state standards more regularly—from monthly schoolwide exams to daily teacher-created quizzes—because the teachers want more immediate information before they plan for the following week what needs to be re-taught, explains Campsen.
Ocean View's assessments are far shorter than the Commonwealth of Virginia's SOLs and, compared to Norfolk Public Schools', have just a quarter of the 50 questions on each of the district's subject tests. These monthly assessments—developed by the data team of specialists for reading, math, science and social studies—run about 10-12 questions per subject. They evaluate the skills-of-the month. For example, math in one month may focus on place value, followed by decimals and fractions the next month.
Additionally, during the first 15 minutes of the school day, students are given a "daily review" quiz. Teachers then extract the problems proven to be the most difficult to create a cumulative assessment administered at the end of the week.
Price, who teaches third grade, gives a reason for the multiple tests: "With any 8-, 9-year old, the average child cannot apply what they've learned in a different context. If you've asked an addition problem in a certain way, and they've never seen it asked another way, they don't know what to do with it. So through daily reviews and our assessments we try to provide as many different opportunities to see the same type of problem."
To enable students to demonstrate their understanding in more than one way, the math vertical team recently discussed using more writing prompts, which have open-ended questions, and less the traditional multiple-choice format. "A lot of times students don't have [an opportunity] to actually show all their ideas and what their mathematical thinking is so teachers can diagnose what their problems are [in order] to see what their misconceptions are," says the team's leader Tamara Smith-Moyler, a math instructional specialist.
Students nonetheless are constantly told "justify your answer," which is the first of the Big Three Power Strategies posted in every classroom and designed to develop high-order thinking. A combination of research-based strategies, they also advise children to "compare and contrast" as well as to "focus on vocabulary."
"We're just not teaching so the kids can pass a test," says Annette Bonner, the school's communications skills instructional specialist. "We want those children to become lifelong readers and writers. We want them to become scientists or mathematicians one day."
Opening Doors With Intervention
When it comes to evaluating the quality of teaching at Ocean View, test score data has a dual function: it reveals whether or not instruction is effective and whether the intervention that follows is just routine or is really making a difference. The basis of this data is a two-tiered program of monthly assessments that tests specific skills on "Form A" following instruction and subsequently on "Form B" after intervention for those who were not proficient on the initial test. (Reading is the only subject for which there is no Form B because all students are assessed invariably on the same 12 comprehension skills. In writing, students revise papers following instructional rewrites aligned with the district's rubric.)
The children identified for extra help are grouped according to the skill that needs shoring up. Thanks to flexible scheduling, the school's instructional specialists and literacy teachers move in and out of classrooms all day long, giving skill-specific teaching, which is woven with current class content so children receiving intervention do not have to play catch up with the class lessons.
For example, in one class where 15 percent of the students did not fare well on September's Form A test, the students pulled aside for additional instruction had to take the post-intervention Form B retest and then be ready to take a new Form A test the following month. The process restarts each month with a new skill goal.
Consequently, some children are receiving a "triple dose" of instruction. A special needs student who is a struggling reader may get a guided reading lesson from three teachers: first, her regular classroom teacher; second, the special education teacher who will provide the necessary accommodations to help compensate for her learning disability; and third, the literacy teacher who will focus on the lagging comprehension skill.
"They're not going to make it unless you make sure they can read and compute and write at a level where they can leave elementary school and be successful in middle and high school and then have [additional] options," says Campsen. "Every time you don't intervene with a child, you've closed doors for that child's future."
Pulling out a notebook filled with data spreadsheets that track individual student and class performance, Campsen delights in counting the increases in forms A and B test results. There are two towering bookcases in her office lined with data binders, of which the teachers also have copies for their individual classrooms. "This is how we're on track with AYP [adequate yearly progress] and closing gaps," she says.
Data is everywhere at Ocean View, which has exceeded the state's AYP targets since 2004. Every classroom has a data chart right at the door showing both assessment and reassessment outcomes. Campsen says having on display the data, which is updated monthly with each new skill set, means "nothing is a secret, that you have to face the brutal facts."
She adds that even when the numbers were not favorable for her a few years ago she maintained a bulletin board of data outside of her office where visitors are seated. This data wall reports school achievement by grade, subject and student subgroup, as well as the achievement gap between racial groups since the second year of state testing in 1999-2000, when Campsen was promoted from assistant principal.
Ocean View's elaborate data system is the result of years of the staff's hard work and fine-tuning, but Campsen credits the district, which initiated implementation of the data-driven decision-making model, for facilitating the process of data collection and use at all 61 city schools. Along with sending its school leaders to training, Norfolk Public Schools—a 2005 winner of the prestigious Broad Prize for Urban Education—acquired software that scans answer sheets for the school and district's major benchmark tests. The program, which Campsen admits is too expensive for a single school to purchase, has provided educators with immediate feedback on student performance, enabling them to respond quicker to students' academic needs.
A Shift in Management's Focus
The district's executive director of leadership and capacity development believes the role of data has evolved successfully over the years, from the school district dispensing student outcomes to schools privately in an envelope to schools posting them publicly on a poster board outside of each teacher's classroom, based on the trust established.
"Trust had to come from central office to promise that the data was not going to be used punitively, but [because] it's going to help you grow as a school and meet the needs of the students," says Christine Harris.
Campsen remembers the former days when they had to calculate scores by hand; when, as an elementary school teacher early in her career, classroom assessments were called "quizzes" but were far less extensive and standards-intensive; and when she arrived at Ocean View as an assistant principal 14 years ago and the school was a site-based management model before adopting the data-driven approach.
Under the former model, intended to decentralize decision making and empower local schools to govern their own operations, she says the use of allocated funds was determined by a committee of teachers whose priority was managing the budget—a contrast to how decisions are made now, with the data leadership team centering them on student outcomes. "It's really a shift in the focus of the management," says Campsen. "So if we talk about budget around the table [today], it's simply about how do we need to enhance our instructional program."
Despite its hierarchical organization, the data-driven model thrives on participatory decision making at all levels. Second in leadership to the principal and assistant principal, the lead data team comprises instructional specialists who each chair one of four vertical content teams for English, math, science, and history and social studies. These vertical teams consist of teacher representatives from each grade level, pre-K to fifth, along with staff members from special education and resources (art, speech therapist and literacy). Each team averages 14 people.
As a result, teachers attend at least four mandatory meetings per month to discuss student data: twice a month for the vertical team; once a week for the horizontal team for their grade level; and once a month to go over individual student performance with the principal.
The data leadership team is responsible for collecting and organizing data and implementing intervention strategies schoolwide, and, in collaboration with the vertical data teams, for analyzing data, improving instruction and tracking student achievement. Campsen says many of the innovative initiatives in the school are the result of these meetings, such as the recent creation of a "live" wax museum, a la Madame Tussaud's, to highlight historical figures for a social studies lesson. For the one-day project, students did research and performed as costumed historical interpreters.
Teaching to the Test
But Campsen says their efforts involving data have not always been welcomed with praise. She heard about a blog in which someone accused her of leading the school to a Blue Ribbon Award "'because all she's doing is testing the kids to death,'" Campsen recalls. "And I'm like, 'They're going to be tested their whole lives.'"
She even argues for training students on how to take a test, considering there are some who are simply "bad test-takers," she says, and most will have to face high-stakes testing in their future. "I don't understand what all the complaints are. In high school, you should have a class that's called 'Test Taking,' not because it's going to make you more intelligent, but because you're going to have to take the SAT."
Bonner, who leads the English vertical data team, chimes in with the defense against the teaching-to-the-test accusation. "People think sometimes when we look at data we're just looking at a number or a score. We're looking at the whole child. We're looking at what the whole child needs."
Offering another viewpoint, Harris, who oversees data support for the district, suspects that the criticism stems from a misunderstanding about the intent for assessing. "There's a big difference between tests and assessments," she says, though acknowledging that the words are often used interchangeably." You can test students too much. But you can't assess enough to see the progress. ... It's more about using the assessments to inform instruction than posting grades."
Adds Campsen, "The myth that this is all we do is really still a myth. In addition to all this [testing and retesting], our school is a maritime-focus school."
Practically a stone's throw away from the Chesapeake Bay, Ocean View started its environmental education program as one of three area schools that collaborated to offer the "Maritime Studies Pathway," an initiative funded initially by a federal grant from the Environmental Protection Agency. Now supported by the Elizabeth River Project and other local partners, it engages students in service-learning projects linked to the curriculum that supports the restoration of the bay—the largest estuary in the country.
With the expert guidance of a retired science teacher, students have created a veritable outdoor classroom in the backyard of their school. Serving as maritime rangers, they have cleaned the last remaining sand dune in Ocean View, the only one to survive the leveling of the beach to build the naval base during World War II; set up nature trails on part of the 64,000-square-mile watershed; and raise 300,000 oysters to put on reefs they're creating in the rivers flowing into the Chesapeake Bay. Also, a room in the school decorated with life preservers, netting drapes and saltwater tanks has been devoted as the maritime laboratory.
A few years ago, when local residents were suffering from an infestation of mosquitoes, students found that a natural combatant of mosquitoes are praying mantises, which they then raised in the laboratory to later release in the maritime forest.
"We do a lot of those type of activities," says Campsen. "What the data allows us to do is to make sure that we're not just doing some cutesy things that look great and look like they're a lot of fun, but aren't actually helping our children achieve and learn so that they can have all the opportunities this country makes available to them."
Unsubscribe
To unsubscribe from The Achiever:
- Send email to listserv@listserv.ed.gov
- Write in the body of the message: unsub nochildleftbehind
|
|
|
|||||||||||
| |
||||||||||||