

 Products
Additional Contacts:
- Chad Ostheimer, USGS at ostheime@usgs.gov or 614-430-7750
- Scott Jackson, USGS at sjackson@usgs.gov or 614-430-7707
Note to reporters: Contacts are available for interviews after the press conference at 2:00 p.m., Thursday, April 23, at the Owens Community College, Room 111, 3200 Bright Road, Findlay, OH 45840 (see Media Advisory (PDF). Beginning Friday, April 24, contacts are available at the listed numbers. Photos of scientists locating high-water marks and a hydrograph of the Blanchard River at Findlay during the August 2007 flood are available on the USGS Ohio Water Science Center Web page.
A new flood-warning system was put to the test during the recent flooding in Findlay, Ohio. It came through with flying colors, providing Findlay officials and emergency managers information needed about the Blanchard River's impending floodwaters. The warning system is now complete with interactive flood-inundation maps on the Web.
The flood-warning system is the first of its kind in Ohio and was developed by the U.S. Geological Survey (USGS) in cooperation with the City of Findlay and the National Weather Service.
"We prepared a series of flood-inundation maps to show areas that would be under water when the Blanchard River stages are between 11 and 18.46 feet, which was the peak stage of the 2007 flood," said Matt Whitehead, USGS hydrologist and project leader. "The maps bring meaning to predicted river stages because they help people visualize what areas will likely be flooded as the stage gets higher."
The USGS report and flood-inundation maps were published in February, just in time to give city officials the information they needed to prepare for the Blanchard River flooding that occurred on March 9.
"We set up a high-tech 'war room' where we used the most current information to get a picture of how widespread the flooding would be," said Brian Hurt, chief engineer for the City of Findlay. "The USGS stream gages and inundation maps made a difference in how we were able to plan and strategically respond to the flooding."
The National Weather Service (NWS) has now posted Web-based interactive flood-inundation maps for the Blanchard River at Findlay.
"We posted the USGS maps to add to the other information displayed on our Advanced Hydrologic Prediction Services Web page," said Brian Astifan, National Weather Service senior service hydrologist. "We are delighted to provide the first interactive flood-inundation maps for Ohio on the Web, and we are looking forward to adding more maps as they become available."
The USGS installed four new stream gages and accompanying rain gages with multiple forms of telemetry in October 2007 during the first phase of the project. In addition to helping the City of Findlay prepare for future floods, the new gages, flood-inundation maps, and report, will enhance the NWS's ability to more accurately forecast flood peaks in Findlay on the Blanchard River. The new gages are installed upstream of Findlay-two on the Blanchard River and one each on Eagle Creek and Lye Creek, the two main tributaries to the Blanchard River in Findlay.
Real-time streamflow data for all USGS stream gages in Ohio are available online. For more information about floods, see the USGS fact sheet, "Flood Hazards-A National Threat."
NOAA understands and predicts changes in the Earth's environment, from the depths of the ocean to the surface of the sun, and conserves and manages our coastal and marine resources. For more information, visit the NOAA Web site.
The NWS Advanced Hydrologic Prediction Services (AHPS), is a Web-based suite of accurate and information-rich river forecast products providing real-time information on the magnitude and uncertainty of occurrence of floods or droughts.
 |
 |
| USGS hydrologist Carrie Huitger pointing at the August 2007 flood high-water mark (just downstream of the Interstate 75 bridge) and confirming the warning sign message. |
USGS scientist locating high-water mark at the Blanchard River above Findlay stream gage (station number 04188400) after the August 2007 flood. As evidenced by the activity on the platform, the stream gage was still in the process of being installed when the flood occurred. |
 |
 |
|
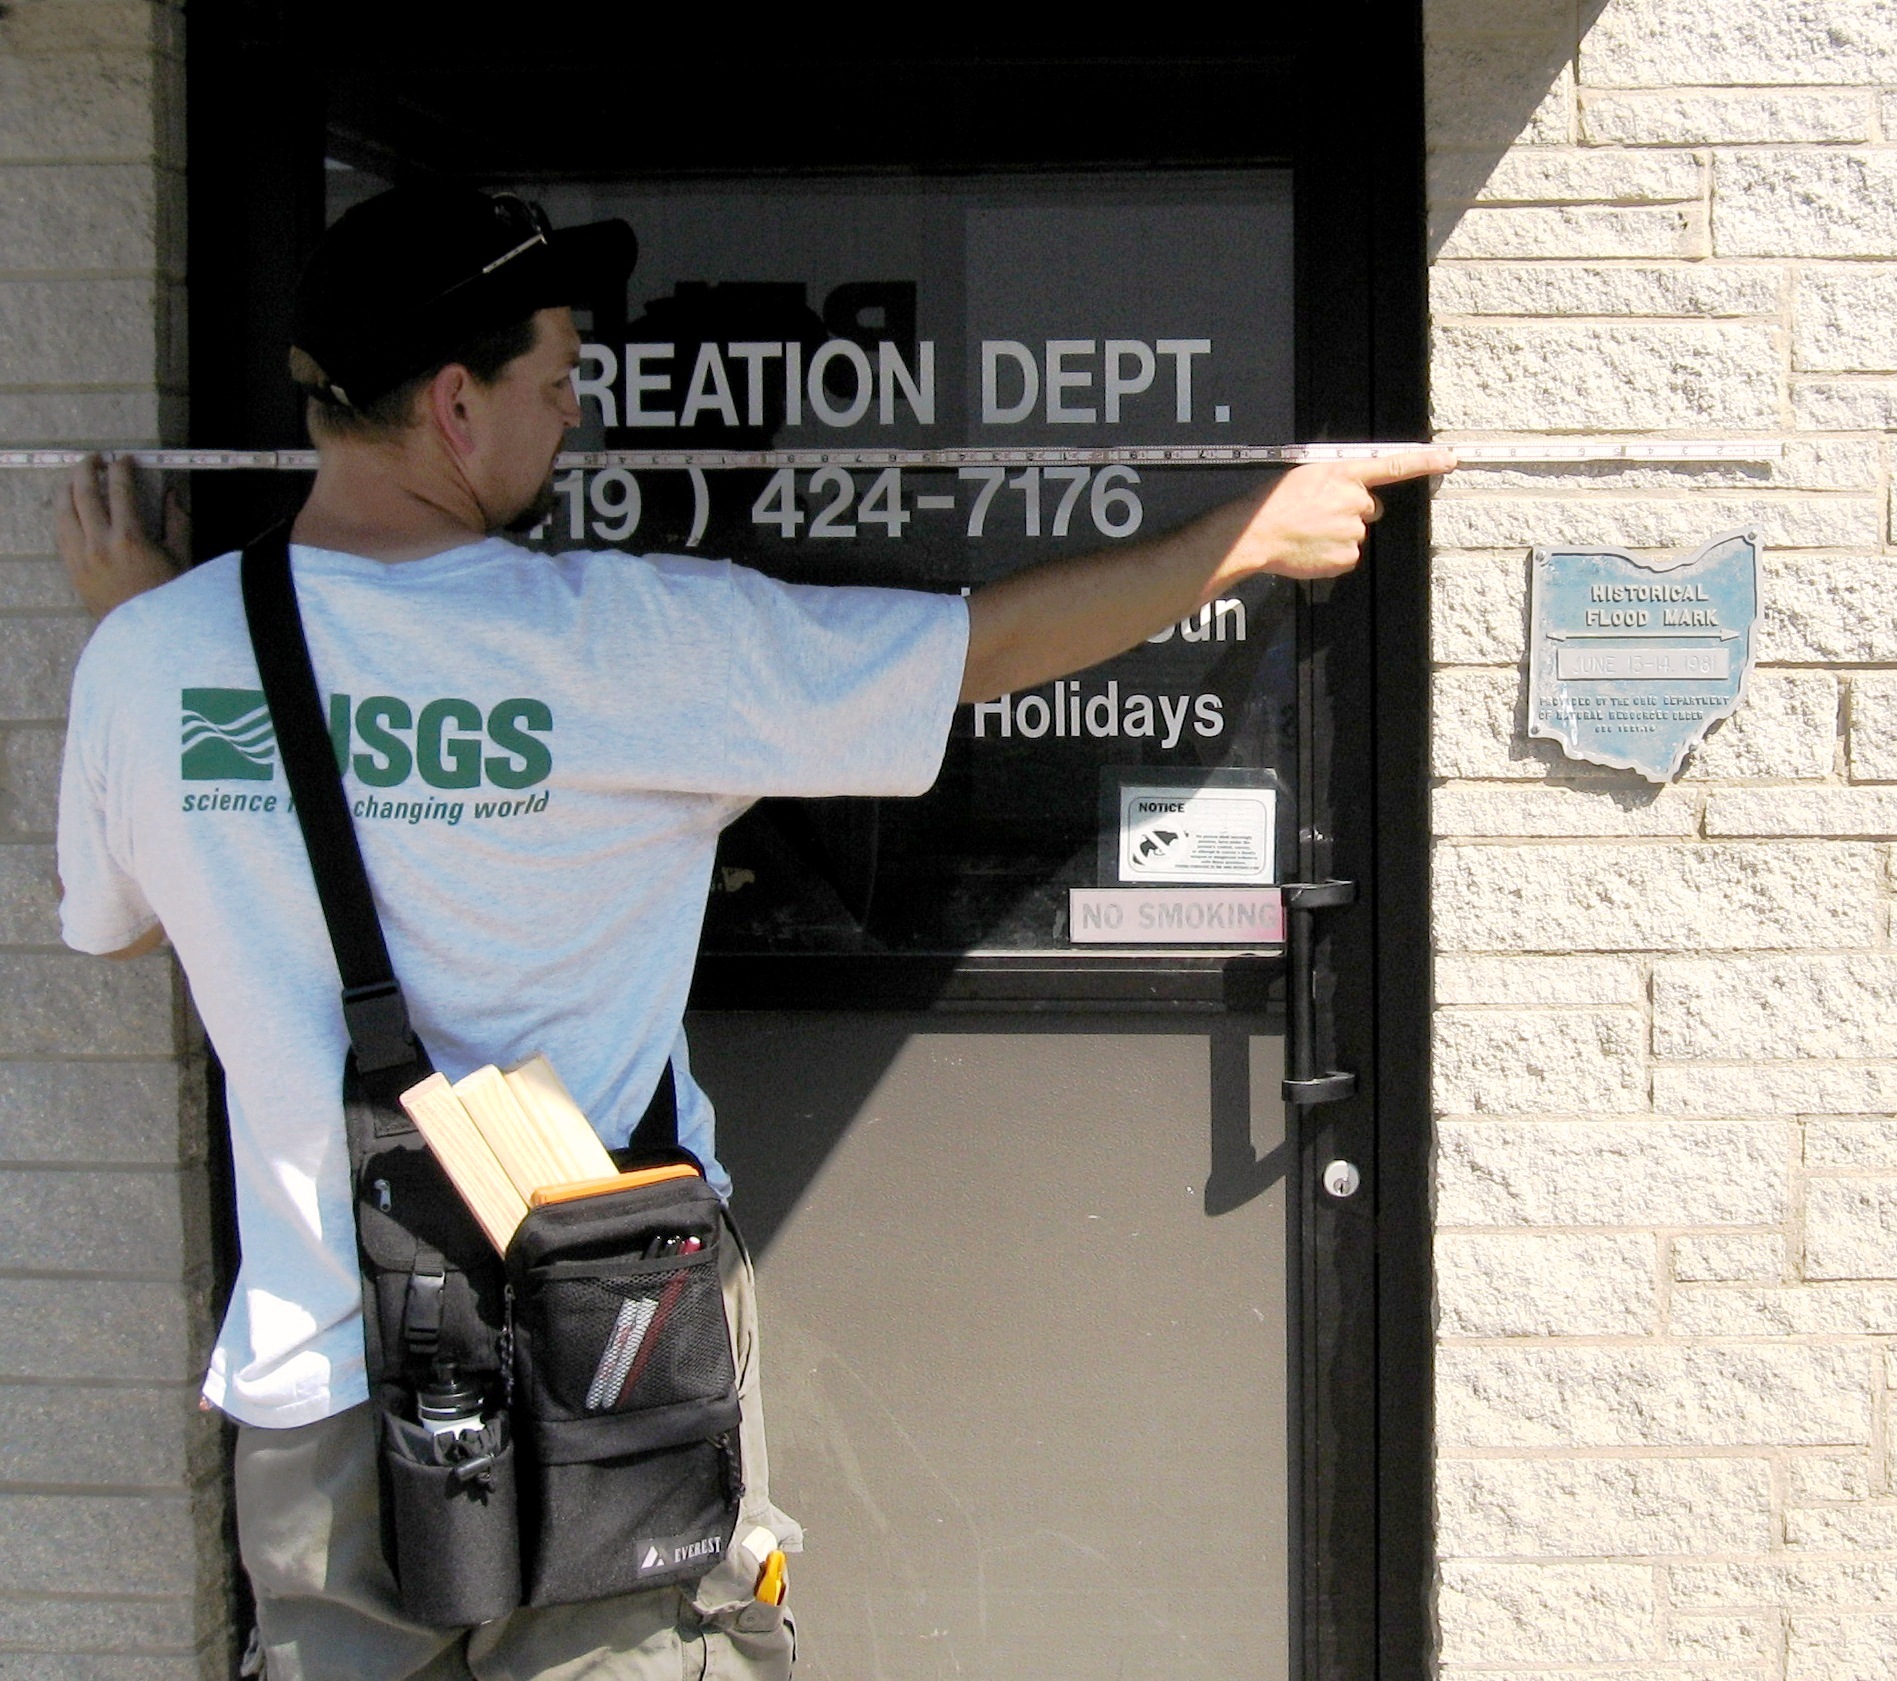
USGS hydrologist Chad Ostheimer is marking the August 2007 flood high-water mark on the City of Findlay Recreation Department Building (see enlarged plaque image to the right). The August 2007 flood level is approximately 0.6 foot above the flood level shown on the plaque denoting the June 13-14, 1981, flood. |
Enlarged plaque. |
 |
Hydrograph of the Blanchard River near Findlay, Ohio, during the August 2007 flood. |
