
Maryland Real-Time Computed Water Quality
Real-time computed concentrations of water-quality constituents such as suspended sediment, total nitrogen, and total phosphorus are calculated using ordinary least squares regression models. The results of these models, along with direct water-quality measurements, can be viewed here as time-series graphs, or downloaded as tabular data.
Ordinary least squares regression models on this site use conventional sensor measurements (for example, discharge, temperature, pH, specific conductance, turbidity, and dissolved oxygen) to compute concentrations and loads of other water-quality constituents in real time. This makes it possible to compute instantaneous values of many constituents in real time for public safety without the lengthy time delay of collecting a sample and waiting for analysis of a sample at a laboratory.
Please select a site from the map or table below to start viewing data. You also can read more about the methods, measured constituents, and disclaimers by using the navigation bar at the top of each page.
NOTE: This website only covers water-quality stations in Maryland that have computed water quality. There are additional real-time water-quality stations, as well as dozens of streamflow stations, available on NWISWeb. While the stations seen on this page also can be found on NWISWeb, computed water-quality data are not available through NWISWeb.
| Station Name | Station Identifier | County | Computation Period |
|---|---|---|---|
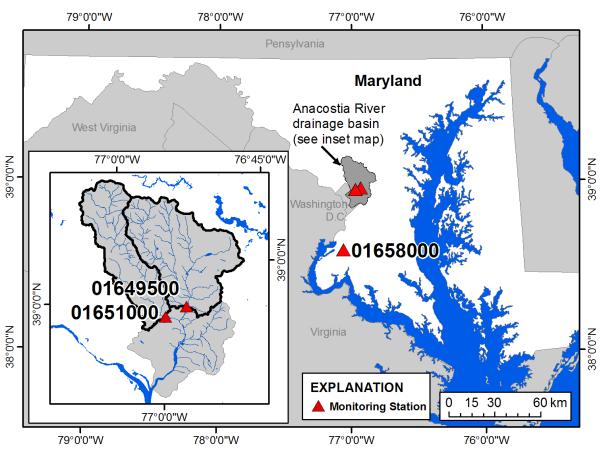
| Mattawoman Creek near Pomonkey, MD | 01658000 | Charles | Jan. 2005 to present |
| Northeast Branch Anacostia River at Riverdale, MD | 01649500 | Prince George's | 2004-2005, 9/2006-10/2007, 2/2008-present |
| Northwest Branch Anacostia River near Hyattsville, MD | 01651000 | Prince George's | 2004 through 2005, Sep. 2006 to present |
