Mid Year 2008 BRAC Program Snapshot
BRAC Federal Facilities by BRAC Round
Top of page
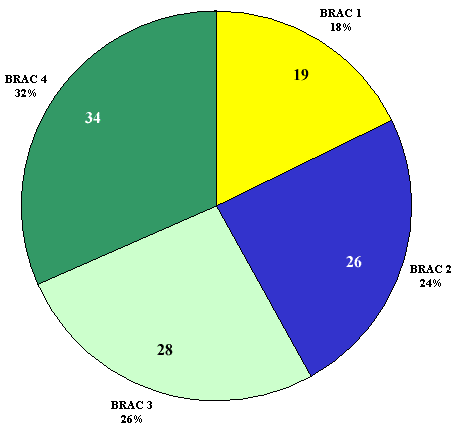
NPL Status of BRAC Facilities
| NPL Status |
Number of BRAC Facilities |
| Proposed |
3 |
| Final |
34 |
| Deleted |
1 |
| Soon to be Proposed |
1 |
| Non NPL |
68 |
| Total |
107 |
Top of page
Current Site Work
Top of page
Completed Site Work
Top of page
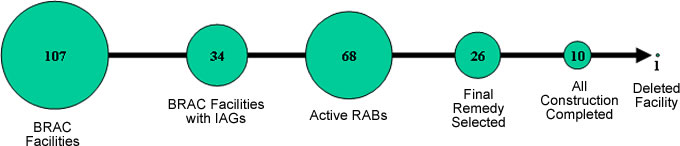
BRAC Federal Facility Site Cleanup Pipeline
Top of page
Interagency Agreements
| % of BRAC Federal Facilities with Completed IAGs |
| Federal Agencies that have not acheived 100% of their IAGs/FFAs: |
| Agency |
# w/ IAG |
Total # |
Percent |
| Navy |
9 |
35 |
25.7% |
| Army |
11 |
40 |
27.5% |
| Air Force |
12 |
29 |
41.4% |
| Dept. of Defense |
0 |
1 |
0.0% |
| Federal Agencies that have acheived 100% of their IAGs/FFAs: |
| Agency |
# w/ IAG |
Total # |
Percent |
| DLA |
2 |
2 |
100.0% |
Top of page
Remedial Actions and Removal Actions with Institutional Controls at BRAC Facilities
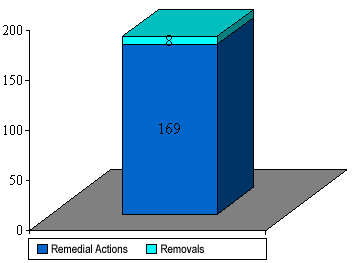
Note: There are 47 BRAC Federal Facilities with Institutional Controls.
Top of page
Status of Remedies Requiring Monitoring at BRAC Facilities
Total Number of Sites with Completed 5 Year Reviews = 39
(Latest Protectivness Statment at Site)

Note: In the second quarter of FY 2005, EPA implemented a change in the way 5 Year Review data is recorded.
Top of page
Environmental Indicators Status for Final NPL BRAC at Federal Facilities
(Total Facilities = 35)
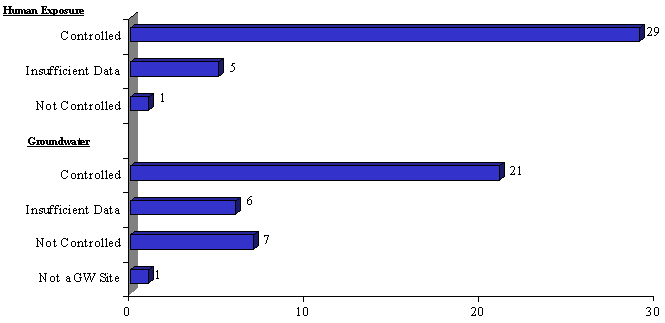
Note: 57% of Facilities have both Human Exposure and Groundwater controlled;
3% of Facilities have neither Human Exposure nor Groundwater controlled.
Top of page
BRAC Federal Facilities which are Sitewide Ready for Anticipated Use
Top of page
Notes:
- Notes: All data from 10/16/2008 CERCLIS 3.
- BRAC cleanup data includes both Superfund and RCRA activity at Superfund Federal Facilities.
Top of page |