Jump to main content.


Ozone

Trends in Ozone Adjusted for Weather Conditions

Variations in weather conditions play an important role in determining ozone levels. Ozone is more readily formed on warm, sunny days when the air is stagnant. Conversely, ozone production is more limited when it is cloudy, cool, rainy, and windy.  EPA uses a statistical model to account for the weather-related variability of seasonal ozone concentrations to provide a more accurate assessment of the underlying trend in the precursor emissions that cause ozone. More Information

Graph showing seasonal average ozone air quality, 1997 - 2007, for 85 urban and 48 rural sites, unadjusted and adjusted for weather

National Trends in Ozone Levels
Local Trends in Ozone Levels

National Trends in Ozone Levels

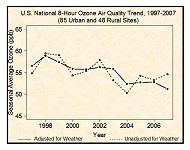
Using a nationwide network of monitoring sites, EPA has developed ambient air quality trends for ozone. Trends are shown here for the 8-hour ozone standards. Under the Clean Air Act, EPA sets and reviews national air quality standards for ozone. Air quality monitors measure concentrations of ozone throughout the country. EPA, state, tribal and local agencies use that data to ensure that ozone is at levels that protect public health and the environment. Nationally, average ozone levels declined in the 1980's, leveled off in the 1990's, and showed a notable decline after 2002. For information on ozone standards, sources, health effects, and programs to reduce ozone, please see www.epa.gov/air/ozonepollution/.


Ozone air quality between 1980 and 2007, based on the annual 4th maximum 8-hour average.  Chart shows a range of concentrations in 269 monitoring sites nationwide, with the average decreasing 21% from 1980 to 2007.

How to Interpret the Graphs
View the chart data in Microsoft Excel  (Download Excel Viewer) Exit EPA Disclaimer
View the chart data in HTML  (New window opens)


Ozone air quality between 1990 and 2007, based on the annual 4th maximum 8-hour average.  Chart shows a range of concentrations in 568 monitoring sites nationwide, with the average decreasing 9% from 1990 to 2007.

How to Interpret the Graphs
View the chart data in Microsoft Excel  (Download Excel Viewer) Exit EPA Disclaimer
View the chart data in HTML  (New window opens)


Local Trends in Ozone Levels Note to users of screen readers:  The Local Trends information is available on the web only as graphical images.  Please call 919-541-5224 for assistance.

Air quality trends can vary from one area to another. Local trends are available at individual monitoring locations with an adequate record of historical data.

Map of the United States Alabama Alaska Arizona Arkansas California Colorado Connecticut Delaware Washington, DC Florida Georgia Hawaii Idaho Illinois Indiana Iowa Kansas Kentucky Louisiana Maine Maryland Massachussets Michigan Minnesota Mississippi Missouri Montana Nebraska Nevada New Hampshire New Jersey New Mexico New York North Carolina North Dakota Ohio Oklahoma Oregon Pennsylvania Puerto Rico Rhode Island South Carolina South Dakota Tennessee Texas Utah Vermont Virginia Washington West Virginia Wisconsin Wyoming


Related Links | Acronyms | Hardcopies


Local Navigation


Jump to main content.