U.S. personal income grew at a 1.2 percent rate in the second quarter of 2007 after growing 2.5 percent in the first quarter, according to estimates released today by the U.S. Bureau of Economic Analysis. Personal income growth in all regions of the country slowed. First-quarter growth, the second strongest in the current economic expansion, reflected the receipt of bonuses for 2006. Personal income in the second quarter of 2007 was 6.4 percent higher than the second quarter of 2006.
Earnings and transfer receipts accounted for the entire fall in nominal personal income growth. Property income contributed 0.4 percentage points to growth in the second quarter, just as it did in the first.
Earnings decelerated in the second quarter in part because first quarter growth had been boosted by unusually large bonus payments in the finance industry. Transfers decelerated in the second quarter because first quarter growth had been boosted by annual cost of living adjustments and because of a slowdown in second quarter Medicaid and social security payments.
Professional services, health care, and state and local government contributed more than other industries to second quarter growth.
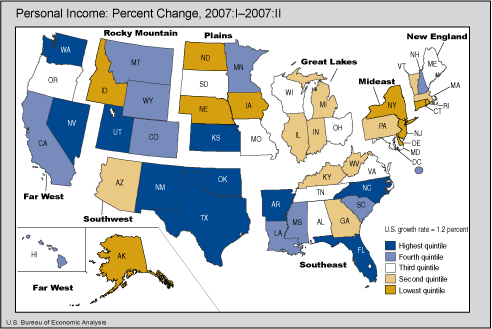
States. Most state personal income growth rates were very similar to the national average. Utah, however, had a notably higher growth rate in the second quarter and has grown substantially faster than all other states over the past year. The main contributors to its second quarter growth were professional services, construction and durable manufacturing.
New York, Connecticut, and North Dakota, on the other hand, had notably slower growth than the nation. The slow growth in New York and Connecticut in the second quarter reflects unusually large first quarter bonuses in the finance industry that is heavily concentrated in those states. North Dakota's slow growth was concentrated in farming which reduced personal income growth nearly 1 percentage point.
Inflation, as measured by the national price index for personal consumption expenditures, increased 1.0 percent in the second quarter after increasing 0.9 percent in the first quarter, leaving real U.S. personal income little changed. Two regions (New England and the Mideast) had income growth less than the national inflation rate.
Revisions. BEA also released today revised quarterly and annual estimates of state personal income beginning with the first quarter of 2004. Revisions are usually made each September to incorporate source data that are more complete, more detailed, and otherwise more consistent than previously available. The average revision to the 2006 personal incomes of the 50 states and the District of Columbia was 0.7 percentage point. A fuller presentation and discussion of the data and revisions will be provided in the October issue of the Survey of Current Business.
Note—the national estimate of first–quarter wages and salaries in the securities industry reflects an adjustment of $50 billion (at an annual rate) for unusually large bonus payments and the exercise of stock options. These types of irregular payments are not accounted for in the primary source data for the preliminary estimate of wages and salaries. The adjustment to first–quarter wages was based on data from state governments and other sources.
NOTE.–Quarterly estimates are expressed at seasonally adjusted annual rates, unless otherwise specified. Quarter–to–quarter dollar changes are differences between published estimates. Quarter–to–quarter percent changes are calculated from unrounded data and are not annualized.
Definitions
Personal income is the income received by all persons from all sources. Personal income
is the sum of net earnings by place of residence, rental income of persons, personal dividend income, personal interest income,
and personal current transfer receipts. Net earnings is earnings by place of work (the sum of wage and
salary disbursements (payrolls), supplements to wages and salaries, and proprietors' income) less contributions for
government social insurance, plus an adjustment to convert earnings by place of work to a place–of–residence basis.
Personal income is measured before the deduction of personal income taxes and other personal taxes and is reported in
current dollars (no adjustment is made for price changes).
The estimate of personal income in the United States is derived as the sum of the state
estimates; it differs from the estimate of personal income in the
national income and product accounts (NIPAs) because of differences in coverage, in the methodologies used to prepare
the estimates, and in the timing of the availability of source data.
BEA groups all 50 states and the District of Columbia into eight distinct regions
for purposes of data collecting and analyses: New England (Connecticut, Maine, Massachusetts,
New Hampshire, Rhode Island, and Vermont); Mideast (Delaware, District of Columbia, Maryland,
New Jersey, New York, and Pennsylvania); Great Lakes (Illinois, Indiana, Michigan, Ohio, and
Wisconsin); Plains (Iowa, Kansas, Minnesota, Missouri, Nebraska, North Dakota, and South Dakota);
Southeast (Alabama, Arkansas, Florida, Georgia, Kentucky, Louisiana, Mississippi, North Carolina,
South Carolina, Tennessee, Virginia, and West Virginia); Southwest (Arizona, New Mexico, Oklahoma,
and Texas); Rocky Mountain (Colorado, Idaho, Montana, Utah, and Wyoming); and Far West (Alaska,
California, Hawaii, Nevada, Oregon, and Washington).
BEA's national, international, regional, and industry estimates; the Survey of
Current Business; and BEA news releases are available without charge on BEA's Web site at
www.bea.gov. By visiting the site, you can also subscribe to
receive free e–mail summaries of BEA releases and announcements.
****
Next state personal income release — December 19, 2007, at 8:30 A.M. ET for state personal income, third quarter 2007.
Table 1. Personal Income, by State and Region, 2006:I-2007:II
[Millons of dollars, seasonally adjusted at annual rate]
[Seasonally change from preceing quarter/1]
Rank
Percent change from preceding quarter/1
2006:I/r
2006:II/r
2006:III/r
2006:IV/r
2007:I/r
2007:II/p
2006:II
2006:III
2006:IV
2007:I
2007:II
2007:I-2007:II
r Revised.
p Preliminary.
1. Percent changes are expressed at quarterly rates.
Note: Estimates may not add to totals because of rounding.
Source: U.S. Bureau of Economic Analysis
United States
10,767,987
10,902,219
11,016,422
11,180,604
11,458,768
11,595,412
1.2
1.0
1.5
2.5
1.2
--
New England
Connecticut
176,270
176,845
177,893
180,981
187,829
188,663
0.3
0.6
1.7
3.8
0.4
48
Maine
41,481
42,178
42,425
42,714
43,705
44,240
1.7
0.6
0.7
2.3
1.2
29
Massachusetts
292,643
296,479
297,925
303,971
311,282
314,829
1.3
0.5
2.0
2.4
1.1
35
New Hampshire
51,227
51,662
51,988
53,690
53,797
54,518
0.9
0.6
3.3
0.2
1.3
19
Rhode Island
38,837
39,616
40,181
40,487
41,584
41,802
2.0
1.4
0.8
2.7
0.5
47
Vermont
21,470
21,412
21,674
21,849
22,324
22,580
-0.3
1.2
0.8
2.2
1.1
33
Mideast
Delaware
33,031
33,199
33,710
33,148
34,856
35,159
0.5
1.5
-1.7
5.2
0.9
45
District of Columbia
32,802
33,124
33,596
33,901
34,793
35,264
1.0
1.4
0.9
2.6
1.4
--
Maryland
241,867
244,172
246,913
250,333
255,480
258,557
1.0
1.1
1.4
2.1
1.2
30
New Jersey
398,096
403,803
403,852
411,018
423,159
426,221
1.4
0.0
1.8
3.0
0.7
46
New York
834,947
843,569
848,040
868,420
910,518
909,586
1.0
0.5
2.4
4.8
-0.1
50
Pennsylvania
448,613
453,931
458,321
464,851
475,333
480,944
1.2
1.0
1.4
2.3
1.2
31
Great Lakes
Illinois
483,025
489,447
492,904
500,312
511,555
516,949
1.3
0.7
1.5
2.2
1.1
40
Indiana
201,149
202,535
204,213
205,933
211,452
213,816
0.7
0.8
0.8
2.7
1.1
38
Michigan
337,269
341,006
342,697
343,329
349,507
353,326
1.1
0.5
0.2
1.8
1.1
39
Ohio
375,244
380,244
383,598
385,955
395,850
400,702
1.3
0.9
0.6
2.6
1.2
28
Wisconsin
188,817
190,344
192,362
194,745
199,122
201,686
0.8
1.1
1.2
2.2
1.3
22
Plains
Iowa
97,111
98,073
98,586
100,064
102,926
103,927
1.0
0.5
1.5
2.9
1.0
42
Kansas
93,749
95,394
96,246
98,748
100,654
102,331
1.8
0.9
2.6
1.9
1.7
4
Minnesota
197,301
200,195
200,765
202,667
208,422
211,491
1.5
0.3
0.9
2.8
1.5
11
Missouri
188,399
191,114
192,143
194,752
198,739
201,272
1.4
0.5
1.4
2.0
1.3
23
Nebraska
59,654
60,792
60,787
61,972
63,532
64,123
1.9
0.0
2.0
2.5
0.9
44
North Dakota
20,545
21,020
21,004
21,452
22,024
22,093
2.3
-0.1
2.1
2.7
0.3
49
South Dakota
24,940
25,153
25,459
25,800
26,693
27,026
0.9
1.2
1.3
3.5
1.2
27
Southeast
Alabama
138,803
141,080
142,932
144,537
147,612
149,486
1.6
1.3
1.1
2.1
1.3
24
Arkansas
78,295
79,581
80,458
81,470
83,501
84,823
1.6
1.1
1.3
2.5
1.6
8
Florida
649,242
657,763
669,342
676,695
690,106
701,386
1.3
1.8
1.1
2.0
1.6
6
Georgia
294,930
297,845
301,001
305,763
315,344
318,921
1.0
1.1
1.6
3.1
1.1
37
Kentucky
122,711
124,484
125,611
127,196
129,944
131,427
1.4
0.9
1.3
2.2
1.1
34
Louisiana
131,861
133,251
135,365
137,541
140,088
141,975
1.1
1.6
1.6
1.9
1.3
18
Mississippi
77,175
77,886
78,566
79,642
81,506
82,656
0.9
0.9
1.4
2.3
1.4
13
North Carolina
280,482
284,020
288,013
293,103
300,284
304,707
1.3
1.4
1.8
2.5
1.5
10
South Carolina
126,059
127,546
128,836
130,723
133,547
135,349
1.2
1.0
1.5
2.2
1.3
17
Tennessee
190,897
194,580
195,489
199,374
201,185
203,728
1.9
0.5
2.0
0.9
1.3
25
Virginia
298,201
301,092
303,612
306,623
314,722
318,868
1.0
0.8
1.0
2.6
1.3
21
West Virginia
50,132
50,791
51,310
51,923
52,823
53,424
1.3
1.0
1.2
1.7
1.1
36
Southwest
Arizona
192,840
194,569
199,083
201,544
206,814
209,191
0.9
2.3
1.2
2.6
1.1
32
New Mexico
56,728
57,634
58,738
59,304
60,781
61,774
1.6
1.9
1.0
2.5
1.6
7
Oklahoma
113,807
115,075
116,827
118,130
120,559
122,434
1.1
1.5
1.1
2.1
1.6
9
Texas
800,906
818,206
829,736
847,730
868,787
883,621
2.2
1.4
2.2
2.5
1.7
3
Rocky Mountain
Colorado
185,115
186,126
189,798
191,654
195,447
198,177
0.5
2.0
1.0
2.0
1.4
14
Idaho
42,717
43,777
43,993
45,182
46,384
46,818
2.5
0.5
2.7
2.7
0.9
43
Montana
28,557
28,913
29,407
29,827
30,533
30,939
1.2
1.7
1.4
2.4
1.3
20
Utah
73,519
75,081
76,551
78,502
80,454
82,062
2.1
2.0
2.5
2.5
2.0
1
Wyoming
19,976
20,691
21,255
21,650
22,124
22,425
3.6
2.7
1.9
2.2
1.4
15
Far West
Alaska
25,192
25,848
25,995
26,480
26,888
27,154
2.6
0.6
1.9
1.5
1.0
41
California
1,412,521
1,424,566
1,440,963
1,461,588
1,491,077
1,511,381
0.9
1.2
1.4
2.0
1.4
16
Hawaii
46,181
46,988
47,819
48,370
49,349
50,069
1.7
1.8
1.2
2.0
1.5
12
Nevada
94,606
96,904
97,884
100,056
102,044
103,733
2.4
1.0
2.2
2.0
1.7
5
Oregon
120,768
121,941
123,732
125,796
128,179
129,774
1.0
1.5
1.7
1.9
1.2
26
Washington
237,280
240,673
246,823
249,109
253,547
258,004
1.4
2.6
0.9
1.8
1.8
2
BEA Regions
New England
621,928
628,193
632,085
643,693
660,522
666,632
1.0
0.6
1.8
2.6
0.9
--
Mideast
1,989,356
2,011,797
2,024,431
2,061,673
2,134,140
2,145,732
1.1
0.6
1.8
3.5
0.5
--
Great Lakes
1,585,503
1,603,575
1,615,775
1,630,273
1,667,485
1,686,479
1.1
0.8
0.9
2.3
1.1
--
Plains
681,699
691,741
694,991
705,455
722,992
732,264
1.5
0.5
1.5
2.5
1.3
--
Southeast
2,438,789
2,469,920
2,500,535
2,534,590
2,590,662
2,626,749
1.3
1.2
1.4
2.2
1.4
--
Southwest
1,164,280
1,185,485
1,204,384
1,226,708
1,256,940
1,277,020
1.8
1.6
1.9
2.5
1.6
--
Rocky Mountain
349,884
354,588
361,004
366,815
374,942
380,421
1.3
1.8
1.6
2.2
1.5
--
Far West
1,936,548
1,956,920
1,983,216
2,011,399
2,051,084
2,080,116
1.1
1.3
1.4
2.0
1.4
--
Table 2. Contributions to Percent Change in Personal Income, by State and Region, 2007:I-2007:II/1
[Percentage points, seasonally adjusted]
Percent change in personal income
Net earnings
Dividends, interest, and rent
Personal current transfer receipts
Earnings by place of work
Contributions for government social insurance
Residence adjustment
Excluding state unemployment insurance
State unemployment insurance
Wage and salary disbursements
Employer contributions for
Proprietors' income
Employee pension and insurance funds
Government social insurance
1. A component's contribution to percent change in personal income equals the dollar change in that component divided by personal income in the previous quarter times 100.
Source: U.S. Bureau of Economic Analysis
United States
1.19
0.61
0.10
0.04
0.03
-0.07
0.00
0.43
0.06
0.00
New England
Connecticut
0.44
0.01
0.01
0.00
0.05
0.01
-0.12
0.45
0.04
0.00
Maine
1.22
0.70
0.12
0.04
0.02
-0.09
0.03
0.32
0.08
0.01
Massachusetts
1.14
0.58
0.09
0.03
0.03
-0.06
-0.03
0.44
0.05
0.01
New Hampshire
1.34
0.85
0.13
0.05
0.03
-0.11
0.04
0.30
0.04
0.01
Rhode Island
0.52
-0.16
0.01
-0.03
0.06
0.05
0.10
0.39
0.06
0.04
Vermont
1.14
0.67
0.10
0.04
0.01
-0.08
0.01
0.32
0.07
0.02
Mideast
Delaware
0.87
0.17
0.05
-0.01
0.08
0.01
0.07
0.45
0.06
-0.02
District of Columbia
1.35
1.47
0.23
0.07
0.23
-0.14
-0.94
0.39
0.04
0.01
Maryland
1.20
0.66
0.08
0.04
0.03
-0.08
0.10
0.32
0.04
0.01
New Jersey
0.72
0.47
0.05
0.02
0.05
-0.05
-0.21
0.35
0.04
-0.01
New York
-0.10
-0.90
-0.07
-0.04
0.07
0.12
0.14
0.53
0.05
-0.01
Pennsylvania
1.18
0.75
0.11
0.05
0.04
-0.1
-0.02
0.31
0.06
-0.01
Great Lakes
Illinois
1.05
0.57
0.10
0.03
-0.01
-0.06
0.00
0.41
0.04
-0.02
Indiana
1.12
0.74
0.13
0.04
-0.09
-0.09
0.02
0.33
0.06
-0.02
Michigan
1.09
0.63
0.10
0.03
-0.02
-0.07
0.01
0.39
0.06
-0.03
Ohio
1.23
0.76
0.12
0.05
0.01
-0.09
-0.01
0.34
0.06
-0.01
Wisconsin
1.29
0.78
0.13
0.04
-0.02
-0.1
0.02
0.39
0.05
0.00
Plains
Iowa
0.97
0.70
0.12
0.04
-0.14
-0.09
0.01
0.29
0.05
-0.01
Kansas
1.67
0.82
0.20
0.05
0.21
-0.11
-0.01
0.44
0.05
0.01
Minnesota
1.47
0.88
0.13
0.05
0.08
-0.11
-0.01
0.39
0.05
0.03
Missouri
1.27
0.71
0.11
0.04
0.08
-0.08
-0.02
0.37
0.07
-0.01
Nebraska
0.93
0.70
0.11
0.04
-0.30
-0.09
-0.02
0.45
0.05
-0.01
North Dakota
0.31
0.56
0.08
0.03
-0.73
-0.06
-0.03
0.41
0.05
0.01
South Dakota
1.24
0.68
0.11
0.04
0.04
-0.09
-0.01
0.42
0.06
0.00
Southeast
Alabama
1.27
0.71
0.12
0.04
0.05
-0.09
0.01
0.37
0.08
-0.01
Arkansas
1.58
0.72
0.13
0.04
0.22
-0.1
-0.01
0.47
0.09
0.01
Florida
1.63
0.79
0.10
0.04
0.00
-0.1
0.00
0.72
0.07
0.01
Georgia
1.13
0.59
0.11
0.03
0.04
-0.06
0.00
0.38
0.06
-0.01
Kentucky
1.14
0.61
0.11
0.03
0.05
-0.07
0.00
0.36
0.07
-0.01
Louisiana
1.35
0.73
0.14
0.04
0.11
-0.09
0.00
0.35
0.06
0.01
Mississippi
1.41
0.69
0.13
0.04
0.15
-0.09
0.04
0.35
0.09
0.01
North Carolina
1.47
0.90
0.15
0.05
0.02
-0.12
-0.01
0.41
0.07
0.00
South Carolina
1.35
0.77
0.13
0.04
-0.01
-0.1
0.02
0.40
0.08
0.00
Tennessee
1.26
0.77
0.12
0.04
0.08
-0.1
-0.02
0.28
0.07
0.02
Virginia
1.32
0.86
0.13
0.05
0.02
-0.1
-0.01
0.33
0.05
0.00
West Virginia
1.14
0.60
0.13
0.04
0.08
-0.09
0.03
0.27
0.08
-0.01
Southwest
Arizona
1.15
0.60
0.09
0.03
-0.04
-0.07
0.01
0.44
0.08
0.01
New Mexico
1.63
0.88
0.12
0.05
0.07
-0.11
0.01
0.54
0.08
0.00
Oklahoma
1.56
0.70
0.10
0.04
0.35
-0.09
0.02
0.36
0.07
0.00
Texas
1.71
0.99
0.15
0.06
0.20
-0.12
-0.01
0.39
0.06
-0.01
Rocky Mountain
Colorado
1.40
0.80
0.10
0.05
0.04
-0.09
0.00
0.46
0.04
-0.01
Idaho
0.93
0.68
0.10
0.04
-0.33
-0.09
0.04
0.44
0.07
-0.02
Montana
1.33
0.75
0.13
0.05
0.03
-0.11
0.00
0.43
0.06
-0.01
Utah
2.00
1.31
0.20
0.09
0.05
-0.18
-0.01
0.50
0.05
-0.01
Wyoming
1.36
0.71
0.10
0.04
0.07
-0.09
0.00
0.47
0.05
0.01
Far West
Alaska
0.99
0.55
0.02
0.03
0.07
-0.06
-0.09
0.43
0.06
-0.01
California
1.36
0.74
0.13
0.05
-0.02
-0.09
0.00
0.51
0.05
0.01
Hawaii
1.46
0.87
0.11
0.05
0.02
-0.11
0.00
0.47
0.05
0.00
Nevada
1.66
0.85
0.13
0.04
-0.01
-0.09
-0.01
0.68
0.05
0.01
Oregon
1.24
0.78
0.11
0.05
-0.08
-0.11
-0.02
0.47
0.06
-0.02
Washington
1.76
1.20
0.19
0.09
-0.07
-0.18
0.01
0.47
0.05
-0.01
BEA Regions
New England
0.92
0.40
0.07
0.02
0.04
-0.04
-0.04
0.42
0.05
0.01
Mideast
0.54
-0.02
0.02
0.00
0.06
0.01
0.01
0.42
0.05
-0.01
Great Lakes
1.14
0.67
0.11
0.04
-0.02
-0.08
0.00
0.38
0.05
-0.02
Plains
1.28
0.77
0.13
0.04
0.01
-0.1
-0.01
0.39
0.06
0.01
Southeast
1.39
0.76
0.12
0.04
0.04
-0.09
0.00
0.46
0.07
0.00
Southwest
1.60
0.89
0.13
0.05
0.17
-0.11
0.00
0.41
0.06
0.00
Rocky Mountain
1.46
0.89
0.12
0.05
0.00
-0.11
0.01
0.47
0.05
-0.01
Far West
1.42
0.80
0.13
0.05
-0.03
-0.11
0.00
0.51
0.05
0.01
Table 3. Contributions to Percent Change in Personal Income by Major Industry, by State and Region, 2007:I-2007:II/1
[Percentage points, seasonally adjusted]
Earnings by industry
Total Earnings/1
Farm
Forestry, fishing, related activities and other/2
Mining
Utilities
Con- struction
Manufacturing
Wholesale trade
Retail trade
Transpor- tation and warehousing
Information
Finance and insurance
Durable goods
Nondurable goods
1. Earnings by place of work is the sum of wage and salary disbursements (payrolls), supplements to wages and salaries, and proprietors' income.
2. "Other" consists of the wage and salary disbursements to U.S. residents employed by international organizations and foreign
embassies and consulates in the U.S.
Source: U.S. Bureau of Economic Analysis
United States
0.78
- 0.03
0.00
0.03
0.01
0.03
0.08
0.06
0.08
0.04
0.01
0.01
- 0.18
New England
Connecticut
0.06
- 0.01
0.00
0.00
- 0.04
- 0.01
0.09
0.07
0.08
0.04
0.01
0.01
- 0.73
Maine
0.87
- 0.02
0.00
0.00
0.01
0.01
0.06
0.08
0.06
0.04
0.02
0.00
- 0.01
Massachusetts
0.73
0.00
0.00
0.00
0.01
0.00
0.08
0.05
0.08
0.03
0.01
0.01
- 0.30
New Hampshire
1.05
- 0.01
0.00
0.00
0.02
- 0.02
0.15
0.06
0.11
0.07
0.01
0.01
0.00
Rhode Island
- 0.12
0.00
0.00
0.00
0.02
0.03
- 0.26
0.05
- 0.12
- 0.25
0.01
0.00
- 0.01
Vermont
0.80
- 0.04
0.00
0.01
0.03
0.01
0.10
0.06
0.06
0.05
0.01
0.00
- 0.05
Mideast
Delaware
0.30
0.01
0.00
0.00
0.02
0.04
0.05
0.09
0.08
0.04
0.01
0.01
- 0.85
District of Columbia
2.00
0.00
- 0.03
0.00
0.03
0.01
0.00
0.01
0.03
0.00
- 0.01
0.06
0.07
Maryland
0.80
- 0.01
0.00
0.00
- 0.02
0.04
0.03
0.03
0.06
0.03
0.01
0.01
0.01
New Jersey
0.59
- 0.01
0.00
0.00
0.01
0.01
0.02
- 0.09
0.10
0.04
- 0.03
0.01
- 0.11
New York
- 0.94
- 0.01
0.00
0.01
0.02
0.06
0.06
0.02
0.05
0.02
0.01
0.01
- 1.78
Pennsylvania
0.94
- 0.02
0.00
0.02
- 0.01
0.00
0.08
0.08
0.08
0.03
0.02
0.01
0.01
Great Lakes
Illinois
0.68
- 0.09
0.00
0.02
0.02
0.02
0.07
0.10
0.09
0.03
0.02
0.00
- 0.18
Indiana
0.82
- 0.17
0.00
0.01
0.02
0.09
0.18
0.11
0.08
0.02
0.01
0.00
0.00
Michigan
0.75
- 0.04
0.00
0.01
0.02
- 0.05
0.12
0.07
0.07
0.01
0.00
0.01
- 0.01
Ohio
0.94
- 0.05
0.00
0.01
0.02
0.03
0.10
0.09
0.08
0.03
0.02
0.00
0.00
Wisconsin
0.93
- 0.05
0.00
0.00
0.01
- 0.03
0.13
0.13
0.09
0.04
0.02
0.01
0.00
Plains
Iowa
0.72
- 0.17
0.00
0.01
0.02
- 0.05
0.11
0.11
0.07
0.04
0.04
0.00
0.03
Kansas
1.29
0.10
0.00
0.04
0.02
- 0.03
0.14
0.13
0.08
0.04
0.01
0.01
0.02
Minnesota
1.14
0.04
0.00
0.01
0.02
0.01
0.07
0.09
0.12
0.04
0.01
0.00
0.03
Missouri
0.94
0.02
0.00
0.01
0.02
0.02
0.08
0.08
0.09
0.04
0.02
0.01
- 0.12
Nebraska
0.55
- 0.37
0.00
0.01
0.03
0.01
0.04
0.09
0.09
0.04
0.02
0.01
0.01
North Dakota
- 0.07
- 0.77
0.00
0.00
0.04
- 0.12
0.06
0.04
0.05
0.07
0.03
0.01
0.04
South Dakota
0.86
0.01
0.00
0.01
0.02
- 0.04
0.07
0.08
0.08
0.06
0.02
0.00
0.04
Southeast
Alabama
0.91
- 0.01
0.00
0.02
0.03
0.04
0.09
0.08
0.08
0.05
0.01
0.00
0.00
Arkansas
1.12
0.18
0.00
0.02
0.02
0.01
0.06
0.10
0.07
0.03
0.03
0.01
0.01
Florida
0.94
- 0.02
0.00
0.00
0.01
0.06
0.04
0.02
0.08
0.04
0.01
0.01
0.02
Georgia
0.77
- 0.01
0.00
0.01
0.02
0.04
0.07
0.10
0.12
0.05
0.02
- 0.14
0.01
Kentucky
0.79
- 0.02
0.00
0.05
0.01
0.01
0.10
0.08
0.09
0.04
- 0.13
0.01
0.01
Louisiana
1.01
0.00
0.00
0.10
0.02
0.06
0.09
0.04
0.06
0.04
0.05
0.02
- 0.02
Mississippi
1.01
0.08
0.00
0.03
0.02
0.03
0.14
0.04
0.07
0.04
0.03
0.01
0.01
North Carolina
1.12
- 0.02
0.00
0.00
0.01
0.04
0.09
0.11
0.09
0.04
0.01
0.01
0.02
South Carolina
0.95
- 0.04
0.00
0.00
0.02
0.04
0.10
0.10
0.08
0.04
0.01
0.01
0.00
Tennessee
1.01
0.00
0.00
0.01
0.00
0.01
0.10
0.10
0.10
0.05
0.03
0.01
0.00
Virginia
1.05
0.00
0.00
0.01
0.02
0.02
- 0.02
0.06
0.06
0.04
0.01
0.01
0.01
West Virginia
0.85
0.01
0.00
0.13
0.03
- 0.02
0.07
0.08
0.03
0.02
- 0.01
0.01
0.01
Southwest
Arizona
0.68
- 0.03
0.00
0.02
0.02
- 0.08
0.06
0.03
0.11
0.07
- 0.06
0.01
- 0.04
New Mexico
1.11
- 0.01
0.00
0.09
0.02
0.13
0.04
0.02
0.04
0.05
0.02
0.01
0.00
Oklahoma
1.20
0.09
0.00
0.25
- 0.06
0.01
0.11
0.17
0.08
0.00
0.04
- 0.05
0.00
Texas
1.39
- 0.01
0.00
0.18
0.03
0.08
0.09
0.11
0.11
0.05
0.04
0.01
0.01
Rocky Mountain
Colorado
0.99
- 0.02
0.00
0.10
0.02
- 0.01
0.01
- 0.09
0.08
0.05
0.03
0.06
- 0.01
Idaho
0.49
- 0.38
- 0.01
0.01
0.01
- 0.06
0.04
0.05
0.06
0.08
0.02
0.01
0.02
Montana
0.96
0.00
0.00
0.07
0.03
0.03
0.04
0.03
0.07
0.07
0.01
0.00
0.00
Utah
1.64
- 0.03
0.00
0.05
0.01
0.19
0.14
0.10
0.12
0.09
0.01
0.03
0.06
Wyoming
0.93
- 0.03
0.00
0.34
0.03
- 0.10
0.03
0.04
0.08
0.03
0.04
0.00
0.00
Far West
Alaska
0.67
- 0.01
0.00
0.11
0.02
0.10
0.01
0.05
0.02
0.03
0.09
- 0.01
0.01
California
0.88
- 0.06
0.00
0.01
0.02
0.00
0.07
0.06
0.08
0.03
0.02
0.01
- 0.02
Hawaii
1.05
- 0.02
0.00
0.00
0.02
0.19
0.02
0.04
0.06
0.09
0.00
- 0.01
0.03
Nevada
1.01
- 0.01
0.00
0.01
0.01
- 0.01
0.02
0.02
0.06
0.05
0.02
0.01
- 0.03
Oregon
0.87
- 0.14
0.00
0.01
0.01
0.09
0.07
0.04
0.10
0.06
0.02
0.02
- 0.01
Washington
1.42
- 0.11
- 0.01
0.01
0.00
0.09
0.28
0.04
0.11
0.08
0.01
0.27
0.01
BEA Regions
New England
0.53
- 0.01
0.00
0.00
0.00
0.00
0.07
0.06
0.07
0.02
0.01
0.01
- 0.35
Mideast
0.06
- 0.01
0.00
0.01
0.01
0.03
0.05
0.01
0.07
0.03
0.01
0.01
- 0.79
Great Lakes
0.80
- 0.07
0.00
0.01
0.02
0.01
0.11
0.09
0.08
0.03
0.01
0.00
- 0.06
Plains
0.95
- 0.05
0.00
0.01
0.02
- 0.01
0.08
0.09
0.09
0.04
0.02
0.00
- 0.01
Southeast
0.96
0.00
0.00
0.02
0.02
0.04
0.06
0.07
0.08
0.04
0.01
- 0.01
0.01
Southwest
1.24
- 0.01
0.00
0.16
0.02
0.05
0.08
0.10
0.10
0.05
0.02
0.01
0.00
Rocky Mountain
1.06
- 0.07
0.00
0.09
0.02
0.03
0.05
- 0.01
0.09
0.06
0.02
0.04
0.01
Far West
0.96
- 0.07
0.00
0.01
0.02
0.02
0.09
0.05
0.08
0.04
0.02
0.04
- 0.02
Table 3. Contributions to Percent Change in Personal Income by Major Industry, by State and Region, 2007:I-2007:II/1 (continued)
[Percentage points, seasonally adjusted]
Earnings by industry
Real estate and rental and leasing
Professional and technical services
Manage- ment of companies and enterprises
Adminis- trative and waste services
Educational services
Health care and social assistance
Arts, entertain- ment, and recreation
Accomo- dation and food services
Other services, except public administration
Government
Federal, civilian
Military
State and local
Source: U.S. Bureau of Economic Analysis
United States
- 0.01
0.19
0.05
0.03
0.00
0.15
0.02
0.05
0.03
0.01
0.01
0.11
New England
Connecticut
- 0.06
0.17
0.08
0.03
0.00
0.14
0.02
0.03
0.03
0.00
0.00
0.09
Maine
- 0.01
0.12
0.03
0.03
0.00
0.23
0.01
0.06
0.03
0.01
0.01
0.09
Massachusetts
- 0.01
0.28
0.07
0.03
0.00
0.19
0.02
0.05
0.03
0.01
0.00
0.08
New Hampshire
- 0.02
0.17
0.07
0.03
0.00
0.18
0.02
0.06
0.04
0.00
0.01
0.08
Rhode Island
0.00
- 0.15
0.09
0.01
0.01
0.16
0.02
0.05
0.03
0.02
0.05
0.11
Vermont
0.00
0.14
0.00
0.01
0.00
0.19
0.01
0.07
0.03
0.00
- 0.01
0.12
Mideast
Delaware
0.00
0.23
0.10
0.03
0.00
0.17
0.02
0.05
0.04
0.02
0.01
0.12
District of Columbia
- 0.04
1.06
- 0.37
0.15
- 0.02
0.21
0.01
0.16
0.34
0.15
0.08
0.09
Maryland
0.01
0.25
0.03
0.03
0.00
0.13
0.01
0.04
0.03
0.01
- 0.02
0.09
New Jersey
- 0.01
0.21
0.08
0.02
0.00
0.14
0.01
0.04
0.03
0.02
0.00
0.09
New York
0.01
0.24
0.06
- 0.01
0.01
0.13
0.04
0.03
0.02
0.00
0.00
0.06
Pennsylvania
- 0.01
0.18
0.08
0.03
0.00
0.19
0.02
0.04
0.03
0.02
- 0.01
0.07
Great Lakes
Illinois
- 0.07
0.22
0.08
0.05
- 0.01
0.14
0.01
0.05
0.03
0.00
0.01
0.09
Indiana
- 0.01
0.10
0.04
0.01
- 0.01
0.14
0.02
0.03
0.03
0.01
- 0.01
0.11
Michigan
- 0.04
0.14
0.06
0.02
0.00
0.17
0.01
0.04
0.02
0.01
- 0.01
0.10
Ohio
- 0.01
0.14
0.09
0.03
0.00
0.16
0.02
0.04
0.03
0.01
0.00
0.10
Wisconsin
0.00
0.11
0.05
0.05
0.00
0.17
0.02
0.04
0.04
0.00
0.00
0.10
Plains
Iowa
0.00
0.09
0.04
0.02
0.00
0.14
0.01
0.05
0.03
0.01
0.00
0.13
Kansas
- 0.01
0.15
0.03
0.04
0.00
0.13
0.00
0.04
0.05
- 0.02
0.22
0.10
Minnesota
- 0.01
0.17
0.11
0.04
0.00
0.18
0.02
0.04
0.03
0.01
0.00
0.12
Missouri
0.00
0.16
0.09
0.03
0.00
0.16
0.03
0.05
0.04
0.01
- 0.01
0.11
Nebraska
0.00
0.11
0.08
0.02
0.01
0.16
0.01
0.03
0.04
0.00
0.00
0.10
North Dakota
0.00
0.11
0.06
- 0.01
0.00
0.18
0.01
0.05
0.03
- 0.02
- 0.02
0.08
South Dakota
- 0.03
0.08
0.04
0.02
0.00
0.21
0.01
0.06
0.04
0.00
- 0.01
0.09
Southeast
Alabama
- 0.01
0.14
0.02
0.02
0.00
0.13
0.00
0.04
0.03
0.01
0.01
0.12
Arkansas
- 0.01
0.10
0.08
0.02
0.00
0.15
0.01
0.05
0.03
0.00
0.03
0.13
Florida
0.00
0.17
0.04
0.07
0.01
0.16
0.05
0.08
0.04
- 0.01
- 0.01
0.10
Georgia
- 0.01
0.19
- 0.17
0.04
0.00
0.13
0.01
0.06
0.04
0.02
0.05
0.12
Kentucky
0.00
0.11
0.04
0.03
0.00
0.15
0.01
0.04
0.03
0.02
0.00
0.10
Louisiana
0.03
0.12
0.04
0.00
- 0.02
0.16
- 0.04
0.10
0.01
0.00
0.03
0.10
Mississippi
0.00
0.11
0.04
0.02
0.00
0.12
0.01
0.04
0.03
0.02
0.03
0.11
North Carolina
- 0.01
0.15
0.07
0.04
0.00
0.14
0.02
0.05
0.04
0.03
0.04
0.14
South Carolina
0.00
0.13
0.03
0.03
0.00
0.13
0.01
0.07
0.04
0.01
0.02
0.13
Tennessee
- 0.01
0.14
0.03
0.05
0.00
0.18
0.02
0.06
0.04
0.00
0.00
0.10
Virginia
- 0.01
0.34
0.09
0.04
0.01
0.09
0.01
0.04
0.05
0.00
0.04
0.12
West Virginia
0.00
0.12
0.02
0.03
- 0.01
0.10
0.02
0.03
0.03
0.04
0.01
0.09
Southwest
Arizona
- 0.01
0.19
- 0.12
0.02
0.01
0.16
0.03
0.06
0.04
0.04
0.00
0.12
New Mexico
0.00
0.24
0.02
0.06
0.00
0.14
0.01
0.07
0.04
0.03
- 0.03
0.11
Oklahoma
0.00
0.14
0.03
0.01
0.01
0.10
0.01
0.03
0.09
0.01
- 0.04
0.17
Texas
0.00
0.24
0.03
0.04
0.00
0.14
0.00
0.07
0.02
0.01
0.01
0.13
Rocky Mountain
Colorado
- 0.02
0.30
0.05
0.03
0.00
0.12
0.03
0.06
0.04
0.01
0.03
0.10
Idaho
0.00
0.19
0.07
0.04
0.00
0.14
0.01
0.04
0.02
0.01
0.00
0.11
Montana
- 0.05
0.13
0.01
0.02
0.00
0.17
0.03
0.08
0.03
0.06
- 0.01
0.15
Utah
0.01
0.25
0.08
0.04
0.02
0.14
0.02
0.07
0.07
0.04
0.01
0.11
Wyoming
- 0.01
0.11
0.01
0.00
0.00
0.11
0.01
0.09
0.05
0.00
0.00
0.11
Far West
Alaska
0.00
0.13
0.02
0.03
0.00
0.18
0.01
0.09
0.01
- 0.02
- 0.25
0.04
California
- 0.02
0.22
0.04
0.03
0.00
0.12
0.03
0.06
0.03
0.02
0.01
0.14
Hawaii
0.01
0.10
0.04
0.08
0.01
0.16
0.02
0.23
0.05
- 0.03
0.01
- 0.03
Nevada
0.00
0.13
0.10
0.02
0.00
0.14
0.02
0.22
0.03
0.02
0.01
0.18
Oregon
0.01
0.14
0.07
0.02
0.00
0.16
0.00
0.06
0.02
- 0.01
0.00
0.14
Washington
- 0.01
0.17
0.05
0.03
- 0.01
0.14
0.02
0.05
0.04
0.00
0.04
0.12
BEA Regions
New England
- 0.02
0.20
0.07
0.03
0.00
0.17
0.02
0.05
0.03
0.01
0.01
0.09
Mideast
0.00
0.24
0.06
0.01
0.00
0.15
0.03
0.04
0.03
0.01
0.00
0.07
Great Lakes
- 0.03
0.16
0.07
0.03
0.00
0.16
0.01
0.04
0.03
0.00
0.00
0.10
Plains
0.00
0.14
0.08
0.03
0.00
0.16
0.02
0.04
0.04
0.00
0.03
0.11
Southeast
0.00
0.17
0.02
0.04
0.00
0.14
0.02
0.06
0.04
0.01
0.02
0.11
Southwest
0.00
0.22
0.01
0.04
0.00
0.14
0.01
0.07
0.03
0.01
0.00
0.13
Rocky Mountain
- 0.01
0.25
0.05
0.03
0.00
0.13
0.02
0.06
0.05
0.02
0.02
0.11
Far West
- 0.01
0.20
0.04
0.03
0.00
0.13
0.03
0.07
0.03
0.01
0.01
0.13
Table 4. Revisions to Personal Income, by State and Region, 2004-2006