Overview of the U.S. Economy: Perspective from the BEA Accounts
BEA produces some of the most closely watched economic statistics that influence decisions of government officials, business people, and individuals. These statistics provide a comprehensive, up-to-date picture of the U.S. economy. The data on this page are drawn from featured BEA economic accounts.
National Economic Accounts:
Gross Domestic Product (GDP)
Current Numbers:
- 1st quarter 2009: -6.1 percent
- 4th quarter 2008: -6.3 percent
Next release:
May 29, 2009
Quarterly data: Real gross domestic product -- the output of goods and services produced by labor and property
located in the United States -- decreased at an annual rate of 6.1 percent in the first quarter of 2009, (that
is, from the fourth quarter to the first quarter), according to advance estimates released by the Bureau of
Economic Analysis. In the fourth quarter, real GDP decreased 6.3 percent.
- Highlights (PDF • 35KB)
- Detailed Press Release
- GDP and the Economy Preliminary Estimates for the Fourth Quarter of 2008 (PDF • 179KB)
- Annual Revision of the National Income and Product Accounts: Annual Estimates for 2005–2007 and Quarterly Estimates for 2005:I - 2008:I (PDF • 664KB)
- Previous Releases


Personal Income
Current Numbers:
- March 2009: -0.3 percent (personal income)
- February 2009: -0.2 percent (personal income)
Next release:
June 1, 2009
Monthly data:
In March 2009, real disposable personal income increased less than 0.1 percent.

Industry Economic Accounts:
Annual Industry Accounts: GDP by Industry
Annual Data: Downturns in manufacturing, retail trade, and finance and insurance industries were the leading contributors to the slowdown in U.S. economic growth in 2008, according to preliminary statistics on the breakout of real gross domestic product (GDP) by industry from the Bureau of Economic Analysis. The economic slowdown was widespread: nearly two-thirds of private industries contributed to the deceleration in real GDP growth.
- Highlights (PDF • 36KB)
- Detailed Press Release
- Previous Releases


International Economic Accounts:
U.S. Balance of Payments (International Transactions)
Current Account Balance:
- 3rd quarter 2008: -$174.1 billion
- 2nd quarter 2008: -$180.9 billion
Next release:
March 18, 2009
Quarterly data:
The U.S. current-account deficit decreased to $174.1 billion (preliminary)
in the third quarter of 2008 from $180.9 billion (revised) in the second
quarter.
- Quarterly Highlights (PDF • 32KB)
- Annual Highlights (PDF • 36KB)
- Detailed Press Release
- Articles on U.S. International Transactions
- Previous Releases
International Investment Position
Annual data:
The U.S. net international investment position at yearend 2007 was -$2,441.8 billion (preliminary), as the value of foreign investments in the United States exceeded the value of U.S. investments abroad.
International Trade in Goods and Services
Trade Balance:
- February 2009: -$58.2 billion
- January 2009: -$61.7 billion
Next release:
May 12, 2009
Monthly data:
Total February exports of $126.8 billion and imports of $152.7 billion resulted in a goods and services deficit of $26.0 billion. (Joint release with the U.S. Census Bureau)
Regional Economic Accounts:
Gross Domestic Product (GDP) by State
Next release: June 2, 2009
Annual data: New estimates released today by the U.S. Bureau of Economic Analysis show that economic growth slowed in most states and regions of the U.S. in 2007. Real GDP growth slowed in 36 states, with declines in construction and finance and insurance restraining growth in many states. Nationally, real economic growth slowed from 3.1 percent in 2006 to 2.0 percent in 2007, one percentage point below the average growth of 3.0 percent for 2002-2006.
- Highlights (PDF • 129KB)
- Detailed Press Release
- Previous Releases
Gross Domestic Product (GDP) by Metropolitan Area
Next release: September 24, 2009
Annual data: Newly available statistics released today by the U.S. Bureau of Economic Analysis show that real GDP by metropolitan area grew in 308 of 363 metropolitan (statistical) areas in 2006.
State Personal Income (SPI)
Next release: June 18, 2009
Quarterly data: Personal income declined nationally and in 41 states in the fourth quarter of 2008.
Annual data: Per capita personal income grew 2.9 percent nationally in 2008 down from 4.9 percent in 2007.
- Highlights (PDF • 122KB)
- Detailed Press Release
- Previous Releases

Metropolitan Area Personal Income
Annual data: Personal income growth slowed in 2007 in most of the nation’s metropolitan statistical areas.
- Highlights (PDF • 134KB)
- Detailed Press Release
- Previous Releases
Local Area Personal Income
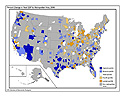
Annual data: The percent change from 2006 to 2007 in county personal income ranged from -11 percent in McPherson County, Nebraska to 88 percent in Campbell County, South Dakota.
- Highlights (PDF • 212KB)
- Detailed Press Release
- Previous Releases
County Estimates of Compensation by Industry, 2005-2007
Annual data: Total compensation of U.S. workers grew 5.2% in 2007 and most counties shared in that growth.