Oklahoma Lightning Mapping Array
Real-time LMA Images from WDSS-II
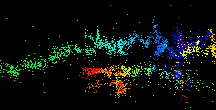
The Oklahoma Lightning Mapping Array (OKLMA) provides three-dimensional mapping of lightning channel segments over west central Oklahoma and two-dimensional mapping of all lightning over most of Oklahoma. Up to thousands of points can be mapped for an individual lightning flash, to reveal its location and the development of its structure. NSSL scientists hope to learn more about how storms produce intra-cloud and cloud-to-ground flashes and how each type is related to tornadoes and other severe weather. Better lightning mapping techniques show that some supercell thunderstorms have "lightning holes" where updrafts are located and precipitation is scarce. If these holes form, as suspected, just before a storm becomes severe, this information could alert forecasters to developing severe conditions. The OKLMA was an integral part of the 2003 and 2004 Thunderstorm Electrification and Lightning Experiment (TELEX).


Lightning Mapping Stations
Crosses indicate the locations of the eleven stations of the Oklahoma Lightning Mapping Array (OKLMA). The inner red circle indicates the region within which the system provides accurate three-dimensional locations of lightning channel segments. Up to thousands of points can be mapped for an individual lightning flash, to reveal its location and the development of its structure. Height errors increase rapidly with range beyond the red circle and obscure details in the vertical lightning structure there. The outer gold circle indicates the nominal region within which the OKLMA provides two-dimensional locations. At longer ranges, some lightning is still detected, but radial errors in the mapped locations become large. The blue circle centered on the KOUN polarimetric radar indicates the region within a 60 km range, where the resolution of polarimetric radar data is optimal. Black lines indicate major highways. (larger image)

Oklahoma Lightning Mapping Array site north of Chickasha, OK
The VHF antenna on the right receives signals in the channel 3 television band. This signal is processed by electronics in the small plastic building on the left of the picture to determine the time at which the signal is received to within less than a millionth of a second. This time and information about the signal is then sent back to a central processor in Norman via the communication antenna beside the plastic building. The central processor records the information from all stations and, in real time, uses the times from several antennas to determine the three-dimensional location at which a lightning channel segment radiated the signal. These data are being used with radar and other storm measurements in scientific studies to help understand how thunderstorms produce lightning and to develop ways of using lightning mapping data to warn and forecast of weather hazards. (larger image)
