
Visualizations - Climate Predictions
Patterns of Greenhouse Warming
|
|
Title | NOAA/GFDL CM2.1 Climate Model |
| Description | Projected change in annual mean surface air temperature from the late 20th century (1971-2000 average) to the middle 21st century (2051-2060 average). The change is in response to increasing greenhouse gases and aerosols based on a "middle of the road" estimate of future emissions. This scenario is denoted as IPCC SRES A1B. Warming is larger over continents than oceans, and is largest at high latitudes of the Northern Hemisphere. These results are from the GFDL CM2.1 model, but are consistent with a broad consensus of modeling results. Additional information on this topic, including a two page PDF summary, can be found on our Climate Research Highlights: Patterns of Greenhouse Warming web page. | |
| Model name | CM2.1 Climate Model | |
| Scientist(s) | Thomas Delworth Ronald Stouffer Michael Winton |
|
| Date created | ||
| Visualization Personnel | Keith Dixon | |
| Files | Png - 1920x1163 Black Background (412 KB) Png - 3200x1937 Black Background (799 KB) Png - 720x480 White Background Png - 3200x1901 White Background |

|
|
Title | NOAA/GFDL CM2.1 Climate Model |
| Description | GFDL CM2.1 model-simulated change in seasonal mean surface air temperature from the late 20th century (1971-2000 average) to the middle 21st century (2051-2060). The left panel shows changes for June July August (JJA) seasonal averages, and the right panel shows changes for December January February (DJF). The simulated surface air temperature changes are in response to increasing greenhouse gases and aerosols based on a "middle of the road" estimate of future emissions This scenario is denoted as IPCC SRES A1B. Warming is projected to be larger over continents than oceans, and is largest at high latitudes of the Northern Hemisphere during Northern Hemisphere winter (DJF). Additional information on this topic, including a two page PDF summary, can be found on our Climate Research Highlights: Patterns of Greenhouse Warming web page. | |
| Model name | CM2.1 Climate Model | |
| Scientist(s) | Thomas Delworth Ronald Stouffer Michael Winton |
|
| Date created | ||
| Visualization Personnel | Keith Dixon | |
| Files | Png - 1920x1220 Black Background (412 KB) Png - 3180x2060 Black Background (799 KB) Png - 720x480 White Background Png - 3200x2000 White Background |

|
|
Title | NOAA/GFDL CM2.1 Climate Model |
| Description | This animation depicts the time evolution of annual mean surface air temperature
changes as projected by the NOAA GFDL CM2.1 climate model. The animations show
the time period 1970 to 2100. For each time level shown, the temperature
differences (or anomalies) were calculated by subtracting the model-simulated
average for the years 1971 to 2000 from the time varying 21st century
model-projected temperatures. The changes depicted in the animation are in
response to increasing greenhouse gases and aerosols based on a "middle of the
road" estimate of future emissions. This scenario is denoted as IPCC SRES A1B.
These animations were produced using the output of the CM2.1 "H2" historical experiment for the 20th century time period and the CM2.1 SRES A1B run for the 2001-2100 period. Additional information on this topic, including a two page PDF summary, can be found on our Climate Research Highlights: Patterns of Greenhouse Warming web page. |
|
| Model name | CM2.1 Climate Model | |
| Scientist(s) | Thomas Delworth Ronald Stouffer Michael Winton |
|
| Date created | ||
| Visualization Personnel | Keith Dixon | |
| Files | 720x480 Mov (13MB) 720x480 Avi (12MB) 1280x720 Mov (27MB) 1280x 720 Avi (17MB) |

Ozone Decline and Recovery
|
|
Title | |
| Description | The animation shows the evolution of northern and southern hemisphere ozone as simulated in the GFDL coupled chemistry-climate model. The animation covers the period 1960 to 2100 and shows the development and disappearance of the Antarctic ozone hole. | |
| Model name | ||
| Scientist(s) | John Austin | |
| Date created | 2007-08-31 | |
| Visualization Personnel | Remik Ziemlinski | |
| Files |
1280x960 Mpg (140 MB) 1280x960 Mov (167 MB) 640x480 Mpg (65 MB) 640x480 Mov (66 MB) Flash Png (755 KB) |

Surface Air Temperature Anomalies
|
|
Title | Surface Air Temperature Anomalies |
| Description | Coupled Climate Model (CM 2.1) projection of surface air temperature anomalies from years 1971-2100. | |
| Model name | Coupled Climate Model (CM 2.1) | |
| Scientist(s) | Keith Dixon |
|
| Date created | October 2005 |
|
| Visualization Personnel | Remik Ziemlinski | |
| Files |
Mpeg (2.4 MB) Flash Png (244 KB) |

Water Flow
|
|
Title | Water Flow |
| Description | This animation depicts the flow of water through the river system of the United States. Color and width of line indicates volume of flow passing a given point per unit time. The data were obtained from a two-year simulation of land water and energy balances, coupled to a network model of the river system. Because the model was started from a dry initial state, little flow is produced in the first year. Note the production of flow by spring snowmelt in the Rockies and the subsequent downstream flows. | |
| Model name | Land Model (LM2) | |
| Scientist(s) | Chris Milly (USGS) | |
| Date created | April 2005 |
|
| Visualization Personnel | Remik Ziemlinski | |
| Files | Mpeg (20 MB) Flash Png (371 KB) |

Arctic Sea Ice Changes
|
|
Title |
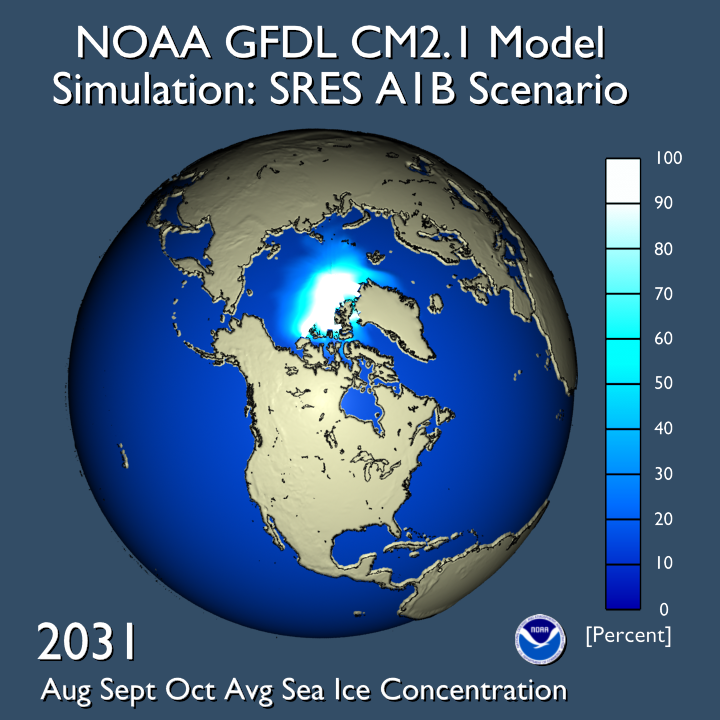
Arctic Sea Ice Changes |
| Description | The future of Arctic sea-ice is a concern for various reasons and simulations with GFDL's Coupled Model version 2.1 suggest a decline in sea-ice concentration, especially during the 21st century. Additional information on this topic, including a two page PDF summary, can be found on our Climate Research Highlights: The Shrinking Arctic Ice Cap web page. | |
| Model name | GFDL CM2.1 |
|
| Scientist(s) | Michael Winton Keith Dixon |
|
| Date created | 2007-01-19 |
|
| Visualization personnel | Remik Ziemlinksi |
|
| Files | Png: 1920x1080 | 1280x720 | 720x720 Mpeg4: 1920x1080 | 1280x720 | 720x720 Mov: 1920x1080 | 1280x720 | 720x720 Flash |

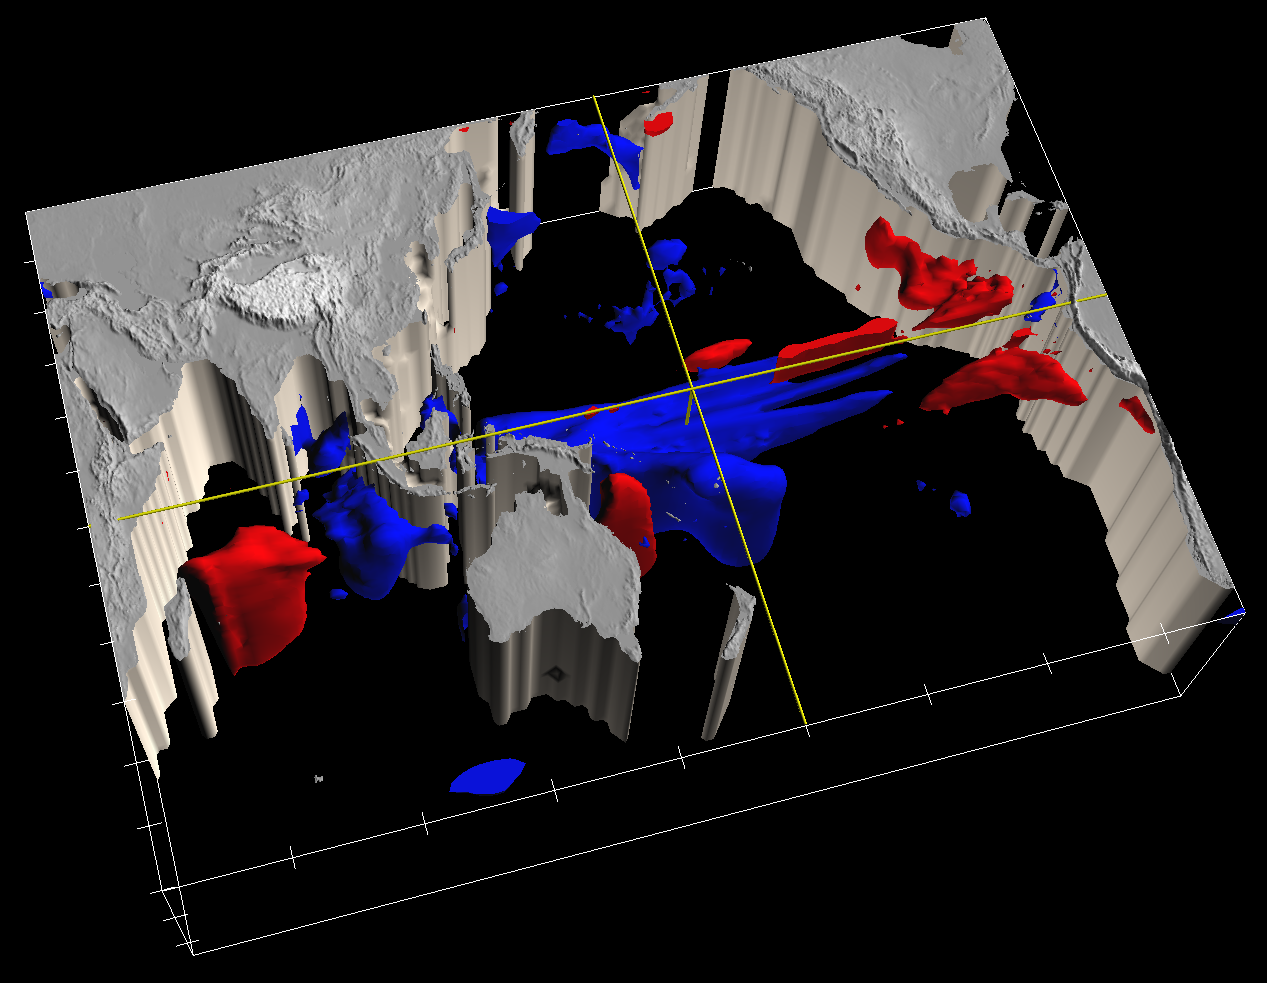
El Niño Forecasting
Ocean temperature anomalies at the peak of an El Niño event, simulated in a
state-of-the-art climate model at GFDL/NOAA. The temperature changes
(see figure below)
affect ocean ecosystems and global weather patterns, with far-reaching
consequences for fisheries, agriculture, and natural disasters. Worldwide
losses resulting from the 1997-98 El Niño are estimated at $32-$96 billion.
|
Temperature changes (red indicates 1°C or more above normal, blue 1°C or more below normal). |
Title |
Ocean Temperature |
| Description | ||
| Model name | ||
| Scientist(s) | Anthony Rosati Andrew Wittenberg |
|
| Date created | n/a |
|
| Visualization personnel | n/a | |
| Files | Mov (5.5 MB) Flash Png (549 KB) |

|
Modeled ocean temperature and surface current distribution over the tropical Pacific Ocean region obtained from a GFDL coupled ocean-atmosphere model used to predict El Nino/Southern Oscillation (ENSO). |
Title |
Warm Phase |
| Description | ||
| Model name | ||
| Scientist(s) | Anthony Rosati Andrew Wittenberg |
|
| Date created | n/a |
|
| Visualization personnel | n/a | |
| Files | Mov (5.5 MB) Gif (105 KB) |

|
Modeled ocean temperature and surface current distribution over the tropical Pacific Ocean region obtained from a GFDL coupled ocean-atmosphere model used to predict El Nino/Southern Oscillation (ENSO). |
Title |
Cold Phase |
| Description | ||
| Model name | ||
| Scientist(s) | Anthony Rosati Andrew Wittenberg |
|
| Date created | n/a |
|
| Visualization personnel | n/a | |
| Files | Mov (5.5 MB) Gif (108 KB) |