 |
The 6 PM surface map showed low pressure centered over central Missouri, with a warm front curving northeast across northwestern Illinois, to near Chicago. Fairly humid conditions for early November were noted over central and southeast Illinois, with dewpoint values around 60 degrees. |
 |
By midnight, the low pressure had moved northeast to Chicago. A cold front was sweeping its way across Illinois, and was roughly along the Illinois River. |
 |
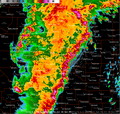
The radar image from Lincoln at 9:30 PM showed a squall line advancing across Illinois. Severe weather reports of trees and power lines down, as well as hail up to nickel size, from the previous hour had been received from Cass, Morgan, Menard, and Mason Counties. Around the time of this radar image, similar reports were received from Pekin southeast to Lincoln, then southwest through Springfield. |
 |
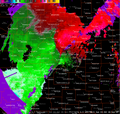
This velocity image at 9:30 PM indicates the strongest winds along a Pekin to Lincoln line. The highest speeds, over 60 mph, were indicated just east of Lincoln, and northwest of Emden. |
 |
By 10 PM, the line of storms had advanced east to the Bloomington/Normal area, and just east of Springfield. As the storms moved through McLean County, the winds tore off part of the roof at Olympia High School in Stanford, downed power poles near Colfax, and damaged or destroyed outbuildings near Lexington, Anchor, and Colfax. |
 |
Around 10:30 PM, the squall line was approaching the Paxton, Decatur, and Pana areas. Around this time, power lines came down in Stonington, southwest of Decatur. |
 |
The storms by 11 PM were moving well into eastern Illinois. Damage reports were more sporadic in the previous hour, although tree damage was reported in Bethany, southeast of Decatur. |
 |
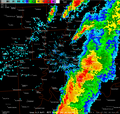
The squall line was along I-57 by 11:30 PM. Winds of 60-65 mph occurred around Tuscola and Mattoon, along with penny size hail on the north edge of Mattoon. Note also the isolated severe cells further west near Jacksonville. These storms produced quarter size hail. |
 |
Just before midnight, the storms were near the Indiana border. As the storms moved through Chrisman (Edgar County) around 12:15 AM, they produced a measured wind gust of 88 mph at the fire station; these winds produced extensive tree and structure damage in the area. |
 |
In this radar image, taken at 1:45 AM by the Doppler radar near Owensville, IN, a severe thunderstorm is shown moving just to the north of Lawrenceville. About 5 minutes later, this storm produced an 89 mph wind gust at the Lawrenceville airport, northeast of town. |
 |
The storm relative motion image from the same time shows winds over 50 knots (58 mph) northeast of Lawrenceville, along with some weak rotation. Also note the bottom center; this is the storm that resulted in the Evansville tornado. A strong rotation is indicated inside the white circle. |
 |
The radar image from 1:51 AM showed the severe thunderstorm in the northeast corner of Lawrence County, as the separate tornadic storm approaches Evansville. |
 |
The corresponding storm relative motion image continues to show an intense circulation southwest of Evansville (shown by the white circle). According to the Paducah NWS, the tornado touched down around 1:50 AM 2 miles north-northwest of Smith Mills, KY. |
 |
At 1:58 AM, the severe storm in Lawrence County had moved into Indiana, while the tornadic storm was moving along the southeast edge of Evansville. |
 |
The storm relative motion image from 1:58 AM showed the intense circulation near the Kentucky/Indiana line just southeast of Evansville. The tornado continued for approximately another 20 miles before lifting near Gentryville, IN. |


