Climate Graphs
Climate data on this page is PRELIMINARY (unofficial). CERTIFIED (official) climate data is available from the National Climatic Data Center or the Midwestern Regional Climate Center.
Questions? E-mail our Webmaster, or call (217) 732-3089 (8:30 am - 4:00 pm weekdays)
Graphs of observed temperatures and precipitation are available from several airport stations from around central and southeast Illinois. These are available for individual months, and the year to date. Go to the bottom of the page for help on how to interpret these graphs.
|
Bloomington Airport |
Champaign Airport |
Decatur Airport |
Lawrenceville Airport |
|
Lincoln NWS |
Mattoon Airport |
Peoria Airport |
Springfield Airport |


| Bloomington Airport | |||||||||||||
| Champaign Airport | |||||||||||||
|
Decatur Airport |
|||||||||||||
|
Lawrenceville Airport |
|||||||||||||
|
Lincoln NWS |
|||||||||||||
|
Mattoon Airport |
|||||||||||||
|
Peoria Airport |
|||||||||||||
|
Springfield Airport |
| Bloomington Airport | |||||||||||||
| Champaign Airport | |||||||||||||
|
Decatur Airport |
|||||||||||||
|
Lawrenceville Airport |
|||||||||||||
|
Lincoln NWS |
|||||||||||||
|
Mattoon Airport |
|||||||||||||
|
Peoria Airport |
|||||||||||||
|
Springfield Airport |
| Bloomington Airport | |||||||||||||
| Champaign Airport | |||||||||||||
|
Decatur Airport |
|||||||||||||
|
Lawrenceville Airport |
|||||||||||||
|
Lincoln NWS |
|||||||||||||
|
Mattoon Airport |
|||||||||||||
|
Peoria Airport |
|||||||||||||
|
Springfield Airport |
For specific daily observations, visit http://www.weather.gov/climate/index.php?wfo=ilx and select the "Preliminary Climatological Data (CF6)" option.
Here are descriptions on how to interpret these graphs:
|
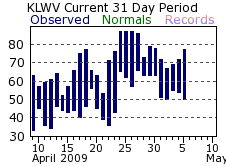
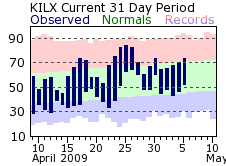
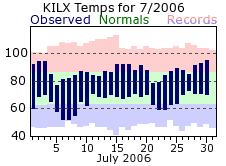
This is an example of the monthly climate plot. The observed high and low temperatures are indicated by the tops and bottoms of the vertical blue bars, respectively. The normal temperature ranges are indicated by the green band. Record highs are shown on the top of the light pink band, and record lows are indicated along the bottom of the light blue band. Please note that only the data for Lincoln, Peoria, and Springfield will have the normal and record data included on the plots. |
|
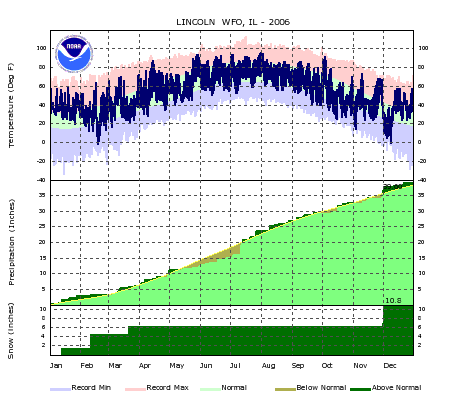
This is an example of the year to date climate plot. As with the monthly plot, observed temperatures are shown by the dark blue areas, normals with the light green areas, record highs in the light red areas, and record lows in the light blue areas. The bottom portion of the graph indicates the precipitation for the year to date. The yellow line (and green area below it) represents the normal year to date total at the given time frame. Periods that have year to date totals above the climatological normals are shown by dark green areas above the yellow line. Periods that are below normal are shown with the brown areas below the yellow line. As with the monthly graphs, the normals and records are only available on the graphs for Lincoln, Peoria, and Springfield. |