COUNTY EMPLOYMENT AND WAGES IN THE DISTRICT OF COLUMBIA:
SECOND QUARTER 2008 (PDF)
D.C. Ranks 3rd in Wages and 10th in Wage Growth in the Nation
The average weekly wage in Washington, D.C. was $1,433 in the second quarter of 2008, 5.9 percent higher than one year earlier, according to the Bureau of Labor Statistics of the U.S. Department of Labor. Nationally, weekly wages averaged $841 and were up 2.6 percent over the year. Sheila Watkins, the Bureau’s regional commissioner, noted that Washington, D.C. ranked 3rd highest in average wage and 10th in rate of wage growth among the 334 largest counties (those with employment of 75,000 or more) in the United States.
Employment in Washington, D.C. stood at 691,426 in June 2008—a 1.2‑percent increase from June 2007. Nationally, employment fell 0.3 percent during this period.
Large County Average Weekly Wages
Average weekly wages were higher than the national average in 109 of the largest 334 U.S. counties. New York, N.Y., held the top position among the highest-paid large counties with an average weekly wage of $1,569. Santa Clara, Calif., was second with an average weekly wage of $1,529, followed by Washington, D.C. ($1,433), Arlington, Va. ($1,376), and San Francisco, Calif. ($1,334).
Three of the 10 counties with the highest wages in the United States were located in the Washington, D.C., metropolitan area (Washington, D.C., Arlington, Va., and Fairfax, Va.), and three others in the New York metropolitan area (New York, N.Y.; Fairfield, Conn.; and Somerset, N.J.). Another three top-paying counties were located in or around the San Francisco metropolitan area (Santa Clara, Calif.; San Francisco, Calif.; and San Mateo, Calif.). Rounding out the top 10 was Suffolk, Mass., which was located in the Boston metropolitan area. (See table 1.)
There were 224 counties with an average weekly wage below the national average in the second quarter of 2008. The lowest average weekly wage was reported in Cameron County, Texas ($535), followed by the counties of Hidalgo, Texas ($538), Horry, S.C. ($539), Webb, Texas ($562), and Yakima, Wash. ($580).
Large County Wage Changes
Over the year, the national average weekly wage rose by 2.6 percent. Among the largest counties, Rock Island, Ill., led the nation in growth in average weekly wages, with an increase of 10.5 percent from the second quarter of 2007. Weld, Colo., was second with growth of 10.4 percent, followed by the counties of Utah, Utah (9.4 percent), Whatcom, Wash. (8.3 percent), and East Baton Rouge, La. (7.8 percent).
Twenty-six large counties experienced over-the-year declines in average weekly wages. Clayton, Ga., had the largest decrease (‑43.7 percent), followed by the counties of Boone, Ky. (‑10.0 percent), Ventura, Calif., and Trumbull, Ohio (‑4.8 percent each), and Queens, N.Y. (‑4.3 percent).
State Average Weekly Wages
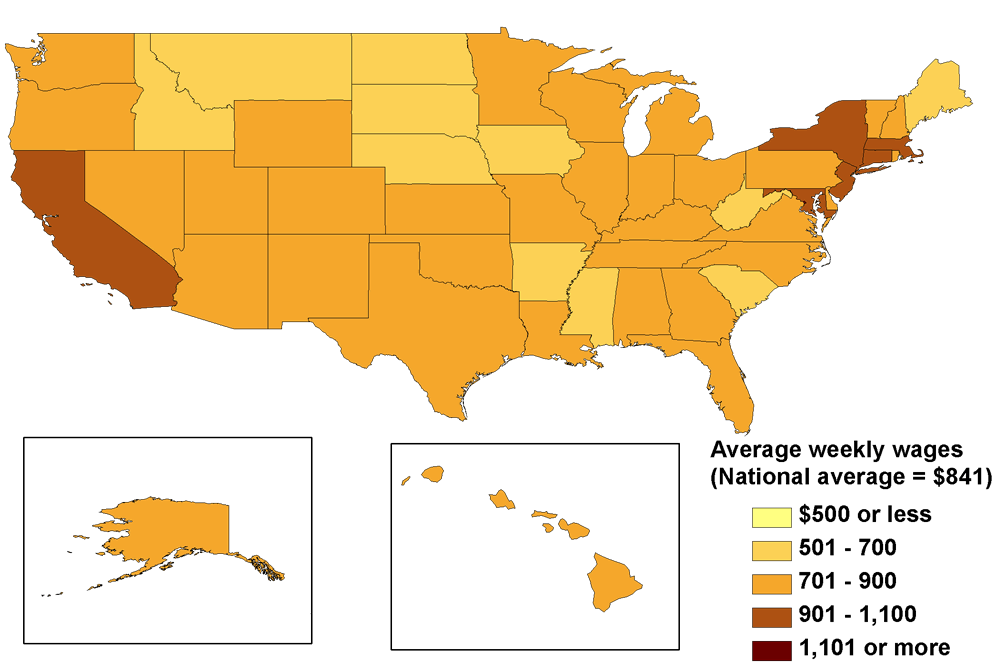
Nationally, 15 states had average weekly wages surpassing the U.S. average; 8 of these, including the District of Columbia, fell in a contiguous band along the east coast stretching from Massachusetts to Virginia. The five highest average weekly wages in the nation were in the District of Columbia ($1,433), Massachusetts ($1,044), New York ($1,040), Connecticut ($1,036), and New Jersey ($1,004). Average weekly wages in this group were 19 percent or more above that for the nation. During this same period, two states had wages averaging less than 75 percent of national earnings: South Dakota ($606) and Montana ($629). (See table 2 and chart 1.)
The District of Columbia recorded the fastest wage growth (5.9 percent) among the states in the second quarter of 2008. Five other states experienced wage growth above 5.0 percent from the second quarter of 2007—North Dakota (5.8 percent), Louisiana (5.5 percent), Wyoming (5.4 percent), Oklahoma (5.3 percent), and West Virginia (5.1 percent). At the other end of the scale, two states experienced over-the-year declines in wages—Delaware (‑0.8 percent) and Georgia (‑0.6 percent).
Average weekly wage data by county are compiled under the Quarterly Census of Employment and Wages (QCEW) program, also known as the ES-202 program. The data are derived from reports submitted by employers subject to state and federal unemployment insurance (UI) laws. The 9.1 million employer reports cover 135.4 million full- and part-time workers. The average weekly wage values are calculated by dividing quarterly total wages by the average of the three monthly employment levels of those covered by UI programs; this result is then divided by 13, the number of weeks in a quarter. It is to be noted, therefore, that over-the-year wage changes for geographic areas may reflect shifts in the composition of employment by industry, occupation, and such other factors as hours of work. Thus, wages may vary among counties, metropolitan areas, or states for reasons other than changes in the average wage. Data for all states, Metropolitan Statistical Areas (MSAs), counties, and the nation are available on the BLS Web site at www.bls.gov/cew/; however, data in QCEW press releases have been revised (see Technical Note below) and may not match the data contained on the Bureau’s Web site.
Additional statistics and other information
An annual bulletin, Employment and Wages, features comprehensive information by detailed industry on establishments, employment, and wages for the nation and all states. The 2007 edition of this bulletin contains selected data produced by Business Employment Dynamics (BED) on job gains and losses, as well as selected data from the first quarter 2008 version of the national news release. Tables and additional content from the 2007 Employment and Wages Annual Bulletin are now available online. These tables present final 2007 annual averages. The tables will also be included on the CD which accompanies the hardcopy version of the Annual Bulletin. Employment and Wages Annual Averages, 2007 will be available for sale as a chartbook by the end of the first quarter in 2009 from the United States Government Printing Office, Superintendent of Documents, P.O. Box 371954, Pittsburgh, PA 15250, telephone 866-512-1800, outside Washington, D.C. Within Washington, D.C., the telephone number is 202-512-1800. The fax number is 202-512-2104.
Also, the quarterly press release, County Employment and Wages, presents employment and wage data for the largest counties in the U.S. and is available at www.bls.gov/cew/.
Information in this release will be made available to sensory impaired individuals upon request. Voice phone: 202-691-5200; TDD message referral phone number: 1-800-877-8339.
For personal assistance or further information on the Quarterly Census of Employment and Wages data, as well as other Bureau data, contact the Mid-Atlantic Information Office at 215-597-3282 from 8:30 a.m. to 12:00 p.m. and 1:00 p.m. to 3:30 p.m. ET.
QCEW-based news releases issued by other regional offices have been placed at one convenient Web site location.
Technical Note
QCEW data are not designed as a time series. QCEW data are simply the sums of individual establishment records reflecting the number of establishments that exist in a county or industry at a point in time. Establishments can move in or out of a county or industry for a number of reasons--some reflecting economic events, others reflecting administrative changes. The preliminary QCEW data presented in this release may differ from data released by the individual states as well as from the data presented on the BLS Web site. These potential differences result from the states’ continuing receipt, review and editing of UI data over time. On the other hand, differences between data in this release and the data found on the BLS Web site are the result of adjustments made to improve over-the-year comparisons. Specifically, these adjustments account for administrative (noneconomic) changes such as a correction to a previously reported location or industry classification. Adjusting for these administrative changes allows users to more accurately assess changes of an economic nature (such as a firm moving from one county to another or changing its primary economic activity) over a 12-month period. Currently, adjusted data are available only from BLS press releases. |