| Web site: www.bls.gov/ro3/ | PLS - 4515 For Release: Thursday, March 26, 2009 |
||||||||||||||||||||||||||||||||||||||||||||||||||||||||||||||||||||||||||||||||||||||||||||||||||||||||||||||||||||||||||||||||||||||||||||||||||||||||||||||||||||||||||||||||||||||||||||||||||||||
| Information: | Gerald Perrins (215) 597-3282 |
||||||||||||||||||||||||||||||||||||||||||||||||||||||||||||||||||||||||||||||||||||||||||||||||||||||||||||||||||||||||||||||||||||||||||||||||||||||||||||||||||||||||||||||||||||||||||||||||||||||
| Media Contact: | Sheila Watkins (215) 861-5600 |
||||||||||||||||||||||||||||||||||||||||||||||||||||||||||||||||||||||||||||||||||||||||||||||||||||||||||||||||||||||||||||||||||||||||||||||||||||||||||||||||||||||||||||||||||||||||||||||||||||||
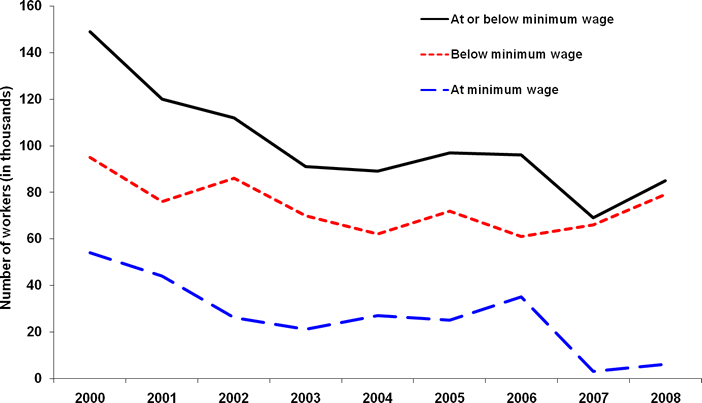
Minimum Wage Workers in Pennsylvania: 2008 (PDF)In 2008, 85,000 hourly-paid workers in the Commonwealth of Pennsylvania had earnings at or below the Federal minimum wage1, according to the Bureau of Labor Statistics of the U.S. Department of Labor. More than 3.4 million workers in Pennsylvania were paid at hourly rates, representing 63 percent of all wage and salary workers2. Sheila Watkins, the Bureau’s regional commissioner, noted that workers paid the Federal minimum wage or less3 made up 2.5 percent of all hourly-paid workers in the Commonwealth, up from 2.0 percent in 2007. (See chart A and table 1.) Chart A. Employed wage and salary workers paid hourly rates with earnings at or below the prevailing Federal minimum wage in the Commonwealth of Pennsylvania, annual averages, 2000-08 (numbers in thousands)
According to Current Population Survey (CPS) estimates for 2008, 75.3 million workers in the United States were paid at hourly rates, representing 58.2 percent of all wage and salary workers. Among those paid by the hour, 286,000 earned exactly the prevailing Federal minimum wage in 2008. About 1.9 million had wages below the minimum. Together, these 2.2 million workers with wages at or below the minimum made up 3.0 percent of all hourly-paid workers in the nation. Relative to 2007, 16,000, or 23.2 percent, more hourly-paid workers in Pennsylvania earned at or below the federal minimum wage in 2008, with over four-fifths of the increase occurring among workers paid below the federal minimum wage. (See table A.) The minimum wage in Pennsylvania was $7.15 per hour in 2008. Meanwhile, the prevailing federal minimum wage was $5.85 per hour until July 24, 2008, when it rose to $6.55 per hour. Women accounted for 64 percent (54,000) of the hourly-paid workers who earned the prevailing Federal minimum wage or less in Pennsylvania in 2008, while men accounted for the remainder (30,000). Since 2000, the number of hourly-paid workers earning the prevailing Federal minimum wage or less in the Commonwealth fell by 64,000, with women accounting for 46,000 of the decline.
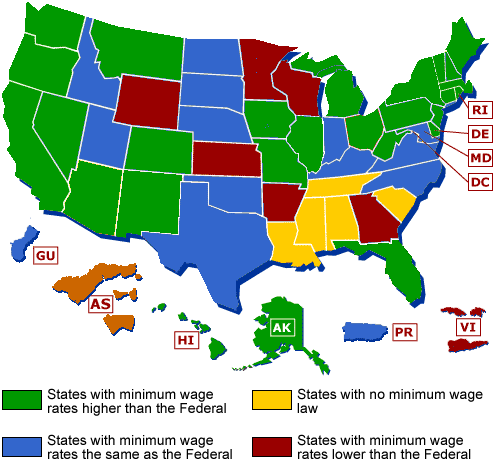
Overall, employed wage and salary workers paid hourly rates in the Commonwealth had median hourly earnings4 of $12.62 in 2008; nationally, the median was $12.23. The median hourly rates for men and for women in Pennsylvania in 2008 were $13.98 and $11.75, respectively. For the U.S. as a whole, the comparable figures were $13.46 per hour for men and $11.49 per hour for women. Among the 50 states and the District of Columbia in 2008, Mississippi, at 6.0 percent, had the highest proportion of hourly-paid workers earning at or below the prevailing Federal minimum wage, followed by South Carolina, at 5.9 percent, and Tennessee, at 5.8 percent. Oklahoma and West Virginia had the next highest shares, at 5.5 and 5.3 percent, respectively. Oregon had the lowest share, with 0.8 percent of hourly-paid workers earning the Federal minimum or below, followed by Alaska and California, with 1.0 percent each. It should be noted that as of January 1, 2009, 27 states and the District of Columbia had laws establishing minimum wage standards that exceeded the Federal level of $6.55 per hour. Two of these states enacted minimum wages above the federal level after the current federal minimum of $6.55 went into effect on July 24, 2008.5 These new levels went into effect on September 1, 2008, for New Hampshire and January, 1, 2009, for Montana. Both of these states had minimum wages above the federal minimum prior to the federal increase from $5.85 to $6.55 in July. (See table 1 and chart B.) Chart B. Minimum wage laws in the States, January 1, 2009
Source: U.S. Employment Standards Administration, Wage and Hour Division Technical NoteThe Bureau of Labor Statistics' data on minimum wage earners are derived from the Current Population Survey (CPS), a nationwide sample survey of households that includes questions enabling the identification of hourly-paid workers and their hourly wage rate. Data in this summary are annual averages. Minimum wage worker data, particularly levels, for each year are not strictly comparable with data for earlier years because of the introduction of revised population controls used in the CPS. These updated controls have little or no effect on unemployment rates and other ratios, such as union membership rates. For technical documentation and related information, including reliability of the CPS estimates, see www.bls.gov/cps/documentation.htm. It should be noted that the presence of a sizable number of workers with reported wages below the minimum does not necessarily indicate violations of the Fair Labor Standards Act, as there are exemptions to the minimum wage provisions of the law. The estimates of the numbers of minimum and subminimum wage workers presented in the accompanying tables pertain to workers paid at hourly rates; salaried and other non-hourly workers are excluded. As such, the actual number of workers with earnings at or below the prevailing minimum is undoubtedly understated. Research has shown that a relatively smaller number and share of salaried workers and others not paid by the hour have earnings that, when translated into hourly rates, are at or below the minimum wage. However, BLS does not routinely estimate hourly earnings for non-hourly workers because of data concerns that arise in producing these estimates. For further information, see Steven Haugen and Earl Mellor, "Estimating the number of minimum wage workers," Monthly Labor Review, January 1990 at www.bls.gov/opub/mlr/1990/01/rpt1full.pdf. The prevailing Federal minimum wage was $2.90 in 1979, $3.10 in 1980, and $3.35 in 1981-89. The minimum wage rose to $3.80 in April 1990, $4.25 in April 1991, $4.75 in October 1996, and $5.15 in September 1997. On July 24, 2007, the Federal minimum wage increased to $5.85 per hour from $5.15 per hour, and on July 24, 2008, from $5.85 per hour to $6.55 per hour. Data in this report reflect the average number of workers earning the prevailing Federal minimum wage or less for the year (those who earned $5.85 or less from January 2008 through July 2008 and those who earned $6.55 or less from August 2008 through the end of the year). For personal assistance or further information on minimum wage workers, as well as other Bureau data, contact the Mid-Atlantic Information Office at 215-597-3282 from 8:30 a.m. to 12:00 p.m. and 1:00 p.m. to 3:30 p.m. ET. Information on the Current Population Survey and other surveys and programs is available on our Web site at www.bls.gov/ro3/. Information in this release will be made available to sensory impaired individuals upon request. Voice phone: 202-691-5200, TDD message referral phone number: 1-800-877-8339. 1 On July 24, 2008, the Federal minimum wage increased to $6.55 per hour from $5.85 per hour. Data in this report reflect the average number of workers earning the prevailing Federal minimum wage or less for the year (those who earned $5.85 or less from January 2008 through July 2008 and those who earned $6.55 or less from August 2008 through the end of the year). 2 Data are for wage and salary workers, excluding the incorporated self-employed, and refer to earnings on a person's sole or principal job. 3 It should be noted that the presence of a sizable number of workers with reported wages below the minimum does not necessarily indicate violations of the Fair Labor Standards Act, as there are exemptions to the minimum wage provisions of the law. 4 Wage rates in this release use median values. The median is the middle of a distribution: half the wages are above the median and half are below the median. The median is less sensitive to extreme wages than the mean and this makes it a better measure than the mean for highly skewed distributions. 5 Minimum wage standards applicable to nonsupervisory Nonfarm Private Sector employment under State and Federal laws according to the U.S. Department of Labor’s Employment Standards Administration Wage and Hour Division as of January 1, 2009.
|
|||||||||||||||||||||||||||||||||||||||||||||||||||||||||||||||||||||||||||||||||||||||||||||||||||||||||||||||||||||||||||||||||||||||||||||||||||||||||||||||||||||||||||||||||||||||||||||||||||||||
| State | Number of workers (in thousands) | Percent distribution | Percent of workers paid hourly rates | ||||||||
|---|---|---|---|---|---|---|---|---|---|---|---|
| Total paid hourly rates | At or below minimum wage | Total paid hourly rates | At or below minimum wage | At or below minimum wage | |||||||
| Total | At minimum wage | Below minimum wage | Total | At minimum wage | Below minimum wage | Total | At minimum wage | Below minimum wage | |||
Total, 16 years and over |
75,305 | 2,226 | 286 | 1,940 | 100.0 | 100.0 | 100.0 | 100.0 | 3.0 | 0.4 | 2.6 |
Alabama |
1,119 | 47 | 17 | 30 | 1.5 | 2.1 | 5.9 | 1.5 | 4.2 | 1.5 | 2.7 |
Alaska |
204 | 2 | - | 2 | 0.3 | 0.1 | - | 0.1 | 1.0 | - | 1.0 |
Arizona |
1,533 | 46 | 5 | 41 | 2.0 | 2.1 | 1.7 | 2.1 | 3.0 | 0.3 | 2.7 |
Arkansas |
703 | 26 | 5 | 21 | 0.9 | 1.2 | 1.7 | 1.1 | 3.7 | 0.7 | 3.0 |
California |
8,778 | 86 | 6 | 80 | 11.7 | 3.9 | 2.1 | 4.1 | 1.0 | 0.1 | 0.9 |
Colorado |
1,211 | 48 | 1 | 47 | 1.6 | 2.2 | 0.3 | 2.4 | 4.0 | 0.1 | 3.9 |
Connecticut |
892 | 16 | 1 | 15 | 1.2 | 0.7 | 0.3 | 0.8 | 1.8 | 0.1 | 1.7 |
Delaware |
220 | 6 | - | 6 | 0.3 | 0.3 | - | 0.3 | 2.7 | - | 2.7 |
District of Columbia |
110 | 3 | - | 3 | 0.1 | 0.1 | - | 0.2 | 2.7 | - | 2.7 |
Florida |
4,058 | 127 | 5 | 122 | 5.4 | 5.7 | 1.7 | 6.3 | 3.1 | 0.1 | 3.0 |
Georgia |
2,084 | 76 | 13 | 63 | 2.8 | 3.4 | 4.5 | 3.2 | 3.6 | 0.6 | 3.0 |
Hawaii |
338 | 5 | - | 5 | 0.4 | 0.2 | - | 0.3 | 1.5 | - | 1.5 |
Idaho |
412 | 15 | 4 | 11 | 0.5 | 0.7 | 1.4 | 0.6 | 3.6 | 1.0 | 2.7 |
Illinois |
3,211 | 80 | - | 80 | 4.3 | 3.6 | - | 4.1 | 2.5 | - | 2.5 |
Indiana |
1,812 | 64 | 10 | 54 | 2.4 | 2.9 | 3.5 | 2.8 | 3.5 | 0.6 | 3.0 |
Iowa |
927 | 21 | 1 | 20 | 1.2 | 0.9 | 0.3 | 1.0 | 2.3 | 0.1 | 2.2 |
Kansas |
791 | 31 | 5 | 26 | 1.1 | 1.4 | 1.7 | 1.3 | 3.9 | 0.6 | 3.3 |
Kentucky |
1,101 | 45 | 9 | 36 | 1.5 | 2.0 | 3.1 | 1.9 | 4.1 | 0.8 | 3.3 |
Louisiana |
953 | 48 | 9 | 39 | 1.3 | 2.2 | 3.1 | 2.0 | 5.0 | 0.9 | 4.1 |
Maine |
397 | 7 | - | 7 | 0.5 | 0.3 | - | 0.4 | 1.8 | - | 1.8 |
Maryland |
1,339 | 37 | 5 | 32 | 1.8 | 1.7 | 1.7 | 1.6 | 2.8 | 0.4 | 2.4 |
Massachusetts |
1,543 | 35 | 2 | 33 | 2.0 | 1.6 | 0.7 | 1.7 | 2.3 | 0.1 | 2.1 |
Michigan |
2,641 | 73 | 2 | 71 | 3.5 | 3.3 | 0.7 | 3.7 | 2.8 | 0.1 | 2.7 |
Minnesota |
1,511 | 40 | 6 | 34 | 2.0 | 1.8 | 2.1 | 1.8 | 2.6 | 0.4 | 2.3 |
Mississippi |
667 | 40 | 9 | 31 | 0.9 | 1.8 | 3.1 | 1.6 | 6.0 | 1.3 | 4.6 |
Missouri |
1,592 | 50 | 4 | 46 | 2.1 | 2.2 | 1.4 | 2.4 | 3.1 | 0.3 | 2.9 |
Montana |
287 | 4 | 2 | 2 | 0.4 | 0.2 | 0.7 | 0.1 | 1.4 | 0.7 | 0.7 |
Nebraska |
551 | 20 | 3 | 17 | 0.7 | 0.9 | 1.0 | 0.9 | 3.6 | 0.5 | 3.1 |
Nevada |
736 | 16 | 2 | 14 | 1.0 | 0.7 | 0.7 | 0.7 | 2.2 | 0.3 | 1.9 |
New Hampshire |
380 | 11 | - | 11 | 0.5 | 0.5 | - | 0.6 | 2.9 | - | 2.9 |
New Jersey |
1,781 | 53 | 5 | 48 | 2.4 | 2.4 | 1.7 | 2.5 | 3.0 | 0.3 | 2.7 |
New Mexico |
495 | 13 | - | 13 | 0.7 | 0.6 | - | 0.7 | 2.6 | - | 2.6 |
New York |
4,105 | 100 | 6 | 94 | 5.5 | 4.5 | 2.1 | 4.8 | 2.4 | 0.1 | 2.3 |
North Carolina |
2,235 | 78 | 11 | 67 | 3.0 | 3.5 | 3.8 | 3.5 | 3.5 | 0.5 | 3.0 |
North Dakota |
199 | 8 | 1 | 7 | 0.3 | 0.4 | 0.3 | 0.4 | 4.0 | 0.5 | 3.5 |
Ohio |
3,329 | 77 | 5 | 72 | 4.4 | 3.5 | 1.7 | 3.7 | 2.3 | 0.2 | 2.2 |
Oklahoma |
878 | 48 | 19 | 29 | 1.2 | 2.2 | 6.6 | 1.5 | 5.5 | 2.2 | 3.3 |
Oregon |
999 | 8 | 2 | 6 | 1.3 | 0.4 | 0.7 | 0.3 | 0.8 | 0.2 | 0.6 |
Pennsylvania |
3,457 | 85 | 6 | 79 | 4.6 | 3.8 | 2.1 | 4.1 | 2.5 | 0.2 | 2.3 |
Rhode Island |
296 | 6 | - | 6 | 0.4 | 0.3 | - | 0.3 | 2.0 | - | 2.0 |
South Carolina |
1,111 | 66 | 6 | 60 | 1.5 | 3.0 | 2.1 | 3.1 | 5.9 | 0.5 | 5.4 |
South Dakota |
256 | 6 | 1 | 5 | 0.3 | 0.3 | 0.3 | 0.3 | 2.3 | 0.4 | 2.0 |
Tennessee |
1,533 | 89 | 12 | 77 | 2.0 | 4.0 | 4.2 | 4.0 | 5.8 | 0.8 | 5.0 |
Texas |
5,527 | 262 | 54 | 208 | 7.3 | 11.8 | 18.9 | 10.7 | 4.7 | 1.0 | 3.8 |
Utah |
736 | 18 | 5 | 13 | 1.0 | 0.8 | 1.7 | 0.7 | 2.4 | 0.7 | 1.8 |
Vermont |
183 | 4 | - | 4 | 0.2 | 0.2 | - | 0.2 | 2.2 | - | 2.2 |
Virginia |
1,809 | 70 | 5 | 65 | 2.4 | 3.1 | 1.7 | 3.4 | 3.9 | 0.3 | 3.6 |
Washington |
1,875 | 26 | 3 | 23 | 2.5 | 1.2 | 1.0 | 1.2 | 1.4 | 0.2 | 1.2 |
West Virginia |
494 | 26 | 10 | 16 | 0.7 | 1.2 | 3.5 | 0.8 | 5.3 | 2.0 | 3.2 |
Wisconsin |
1,748 | 53 | 9 | 44 | 2.3 | 2.4 | 3.1 | 2.3 | 3.0 | 0.5 | 2.5 |
Wyoming |
160 | 7 | 1 | 6 | 0.2 | 0.3 | 0.3 | 0.3 | 4.4 | 0.6 | 3.8 |
|
NOTE: Data exclude all self-employed persons whether or not their businesses are incorporated. Users are reminded that these data are based on a sample and therefore are subject to sampling error; the degree of error may be quite large for less populous States. It is not possible to determine clearly whether workers surveyed in the CPS are actually covered by the Fair Labor Standards Act (FLSA) or by individual State minimum wage laws. Thus, some workers reported as earning the prevailing Federal minimum wage may not in fact be covered by Federal or State minimum wage laws. Also, there are a number of States that have minimum wages that exceed the Federal minimum wage. At the same time, the presence of a sizable number of workers with wages below the prevailing Federal minimum wage does not necessarily indicate violations of the FLSA or applicable State laws, because there are numerous exclusions and exemptions to these minimum wage statutes. Dash indicates no data or data that do not meet publication criteria. |
|||||||||||
Last Modified Date: March 26, 2009

