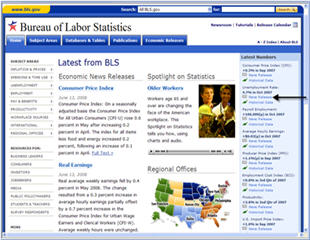
Historical TablesIt's easy to retrieve any data series published in the monthly "Employment Situation" report. For example, in the "Latest Numbers" box, beneath "Unemployment Rate," click the link titled "News Release".
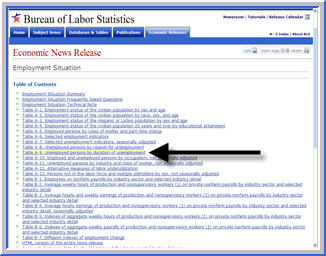
The link displays the sections and tables from the monthly release. If you wanted to find, say, the number of persons who were unemployed long term, you might choose to look at Table A-9, on the duration of unemployment.
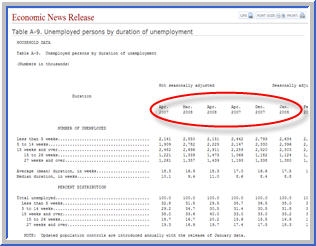
As published in the news release, the print version of table A-9 only contains a few months of data.
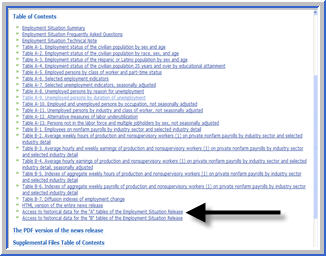
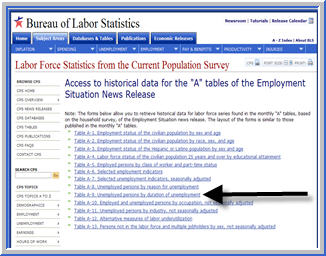
What if you wanted data for 2005? Click the “Back” button on your browser Links for "Access to historical data" are located at the bottom of the list. Click on the link for "…A tables…."
The link brings up a list of tables which have historical links embedded. Click on the link for Table A-9.
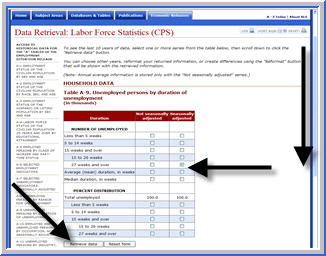
This table looks like the first table we saw for Table A-9, but contains checkboxes rather than data. Check the box for “27 weeks and over” in the "Seasonally adjusted" column. Scroll down and click on the “Retrieve data” button. Clicking the “Retrieve data” button brings up 10 years of the most recent data for the selected series.
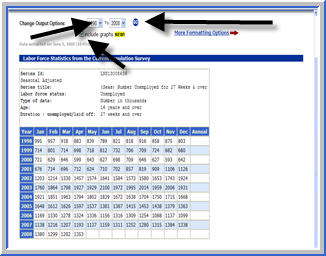
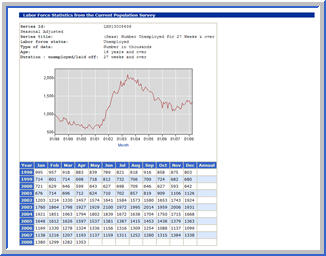
You can see more years by changing the years with the drop down buttons. To see a chart of the selected data, select the “include graphs” checkbox. Click the “Go” button to redisplay the data with the graph included.
This concludes the tutorial. Thank you for visiting the Bureau of Labor Statistics' Website.
|
Tools |
Calculators |
Help |
Info |