About USGS water data
Since 1879, the U.S. Geological Survey mission has included investigating and recording the Nation's land, water, and mineral resources. The USGS Wisconsin Water Science Center is responsible for collecting, analyzing, and distributing information about Wisconsin's water resources.
How can I get water data?
 Data collected by the Wisconsin Water Science Center is stored in the USGS National Water Information System (NWIS) and approved for public release. Data collected by the Wisconsin Water Science Center is stored in the USGS National Water Information System (NWIS) and approved for public release.
Data is available online through NWISWeb.
Learn about NWISWeb
 Fact Sheet 128-02: NWISWeb Fact Sheet 128-02: NWISWeb |
Does Wisconsin publish annual water reports?
The USGS Wisconsin Water Science Center publishes annual water resources data for the state, and contributes to a 5-year water use report.
 Streamflow, precipitation, ground-water levels, and water quality for Wisconsin: Streamflow, precipitation, ground-water levels, and water quality for Wisconsin:
Lake-stage and water-quality in Wisconsin lakes:
Water-use in Wisconsin (every 5 years):
|
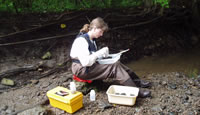
How do we collect water data?
Explore water data
Need a wide mix of locations and data plus Google map output?
The USGS Water Data Explorer is a broad search portal into all 1.5 million USGS water sites in the database of the National Water Information System (NWIS).
Ground-water data
For ground water, a well is drilled into the aquifer. Seasonal variations in rainfall and the occasional drought affect the "height" of the underground water level. If a well is pumped at a faster rate than the aquifer around it can recharge by precipitation or other underground flow, then water levels around the well can be lowered. The network of 150 observation test wells in Wisconsin relay data about water-table levels to the USGS National Water Information System (NWIS). It appears in NWISWeb and GroundWaterWatch national interfaces.
Water-quality data
The USGS collects and analyzes chemical, physical, and biological properties of water, sediment and tissue samples from across the Nation. The tools and techniques used to collect water-quality information are quite varied. Detailed information describing how the USGS collects water-quality data can be found at: http://water.usgs.gov/owq/pubs.html
Water-quality data are often collected from a site at regular intervals or intermittently. However, collection of continuous real-time water-quality data is becoming more common. Continuous real-time information on water quality is a vital asset that helps safeguard lives and property and ensures adequate water resources for a healthy economy.
 Real-time water quality measurements are available at more than 1,300 sites across the United States in streams with watersheds as small as a few square miles to more than a million square miles in the Mississippi River. Measurements include streamflow, water temperature, specific conductance, pH, dissolved oxygen, and turbidity. Real-time water quality measurements are available at more than 1,300 sites across the United States in streams with watersheds as small as a few square miles to more than a million square miles in the Mississippi River. Measurements include streamflow, water temperature, specific conductance, pH, dissolved oxygen, and turbidity.
"Real-time water information is breaking new ground in science and technology and is proving to be very useful, helping local water managers make important daily decisions, such as regarding drinking water, water treatment, recreation, and public safety on beaches throughout the U.S." said Matthew Larsen, USGS Acting Associate Director for Water. The public also uses the on-line data to decide whether conditions, such as water temperature or turbidity, are favorable for recreational activities such as fishing, boating or swimming.
As the science advances, real-time measurements for relatively simple parameters such as temperature, conductance, and turbidity can be used to help predict more health-related conditions, such as if E. coli levels will exceed safety standards at beaches. ~Excerpted from media advisory 22 May 2008 Andrew Ziegler, Jennifer LaVista
Streamflow data
To measure streamflow, a stream gage is used. The U.S. Geological Survey operates and maintains approximately 827 surface-water gaging stations in Wisconsin. A gaging station is a collection of instruments placed at a water body to monitor water flow, height, discharge, chemistry, and temperature. The instruments record data and transmit it to the USGS National Water Information System (NWIS). Stream height  recording devices might be a staff gage (like a yardstick), a wire weight gage, or a vertical pipe gage. recording devices might be a staff gage (like a yardstick), a wire weight gage, or a vertical pipe gage.
Once a complete day of readings are received from a site, daily summary data are generated and stored in the National Water Information System (NWIS) database. Current conditions are displayed real-time in WaterWatch. Provisional daily data are updated on the web once a day when the computation is completed. Annually, the USGS finalizes and publishes the daily data in a series of Annual Water-data Reports.
 Techniques of making discharge measurements at gaging stations, U.S. Geological Survey Techniques of Water-Resources Investigations, Book 3, Chapter A8 (html) Techniques of making discharge measurements at gaging stations, U.S. Geological Survey Techniques of Water-Resources Investigations, Book 3, Chapter A8 (html)
Why does the USGS collect streamflow data?
Streamflow data are needed at many sites on a daily basis for forecasting flow extremes, water-management decisions, assessing current water availability, managing water quality, and meeting legal requirements. These activities require streamflow information at a given location for a specified time or period. These needs generally are best satisfied by operating a station to produce a continuous (or daily) record of flow.
Data from most stations are telemetered by an earth-satellite-based communications system that enables the data to be available in real-time for the operation of water-resources projects by many agencies and for flood forecasting by the National Weather Service (NWS).
An Overview of the USGS stream-gaging program, U.S. Geological Survey Fact Sheet FS 066-95 (.pdf)
Stream gaging and flood forecasting: A partnership of the U.S. Geological Survey and the National Weather Service, U.S. Geological Survey Fact Sheet FS 209-95 (html)
Trend analysis is another application that requires long records. Concern is widespread that increased greenhouse-gas concentrations in the atmosphere are affecting the climate and the hydrology of the Earth. Analysts have used actual streamflow records to determine whether streamflows are beginning to change as a result of human activities or global warming.
Who uses the USGS streamflow data?
The NWS uses data from USGS stations in concert with its own precipitation data to forecast river stages and flow conditions on large rivers and their associated tributaries. State natural resources agencies and emergency management offices use USGS gaging data.
Users and Uses of USGS Streamflow Data, by the National Hydrologic Warning Council, March 7, 2006, (.pdf , 1.7M)
|