Population Division
U.S. Census Bureau
Washington, D.C. 20233
September 2003
Population Division Working Paper Series No. 72
Disclaimer
This paper reports the results of research and analysis undertaken by U.S. Census Bureau staff. It has undergone a more limited review than official U.S. Census Bureau publications. This report is released to inform interested parties of research and to encourage discussion.
Acknowledgements
Jorge del Pinal, Population Division, provided overall guidance for this paper. Robert Nuniziata, Population Division provided programming support to produce the data files showing simulated totals for Hispanic groups. Phil Gbur, Decennial Statistical Studies Division, performed the sampling statistical review. Editorial assistance was provided by Marjorie Hanson, Population Division. Alex Varson, Population Division, produced the web version of this report. The report was reviewed by Nancy Gordon, Campbell Gibson, Kevin Deardorff, Teresa Angueira and other Census Bureau staff. Any errors that remain are solely the responsibility of the authors.
Executive Summary
Introduction
Background
Potential Reasons for Differences in Response Between 1990 and 20002
Historical Context
Simulation of Responses Using Place of Birth and Ancestry Data from
the Census 2000 Long Form
Results and Key Findings
Figure 1
Figure 2
Figure 3
References
Accuracy of the Estimates
Appendix A - Table 7
Appendix B - Comparison of Results from This Simulation with
Results from Suro’s and Logan’s Analyses
Population Division Working Paper Series
This paper explores the concern that the wording and format of the Census 2000 question on Hispanic origin may have influenced respondents to provide general responses (such as "Spanish," "Hispanic," and "Latino") instead of specific national-origin responses (such as "Mexican," "Salvadoran," and "Dominican"). We begin with evidence of the differences in reporting between the 1990 census and Census 2000 and present the results of several studies that address this issue. We then discuss some of the possible reasons. Finally, we examine the responses to the place of birth and ancestry questions from people who provided a general response to the question on Hispanic origin. In this simulation analysis, the Hispanic national-origin groups implied by the place of birth and ancestry questions are examined because they may represent the specific responses individuals who gave general ones might have given had they chosen to do so. This section of the report presents the results of this simulation at the national level. A separate data product (available at ftp2.census.gov/census_2000/Sim_Hispanic_Totals) will show both the official Census 2000 responses and the simulation totals down to the census tract level, as requested by many data users.
The simulation described in this paper indicates that a substantial proportion of people who provided a general Hispanic response such as "Spanish," "Hispanic," or "Latino" also provided information in the place of birth or ancestry questions about their national origin that was more specific than the information they provided in the question on Hispanic origin. A number of factors have been proposed to explain the increased reporting of general Hispanic terms. Future research and testing will address these factors more fully.
The following are some key findings:
NOTE: The simulated totals presented in this report are illustrative and do not replace the official Census 2000 totals for these groups. The totals from Census 2000 are based on sample estimates from the Spanish/Hispanic/Latino question on the long form and are the official figures. The simulated totals provided in this paper do not solely reflect self-identification. Instead, they include: (1) the responses of those who self-identified into a specific group and (2) the responses of those who reported a general term and were tabulated into a specific group using responses to the place of birth or ancestry questions. In other words, respondents who provided a more general Hispanic response might, or might not, have provided a more specific response if the question wording or format had been different.
Introduction
This paper explores the concern that the wording and format of the Census 2000 question on Hispanic origin may have influenced respondents to provide general responses (such as "Spanish," "Hispanic," and "Latino") instead of specific national-origin responses (such as "Mexican," "Salvadoran," and "Dominican"). We begin with evidence of the differences in reporting between the 1990 census and Census 2000 and present the results of several studies that address this issue. We then discuss some of the possible reasons. Finally, we examine the responses to the place of birth and ancestry questions from people who provided a general response to the question on Hispanic origin. In this simulation analysis, the Hispanic national-origin groups implied by the place of birth and ancestry questions are examined because they may represent the specific responses individuals who gave general ones might have given had they chosen to do so. This section of the report presents the results of this simulation at the national level. A separate data product (available at ftp2.census.gov/census_2000/Sim_Hispanic_Totals) will show both the official Census 2000 responses and the simulation totals down to the census tract level, as requested by many data users.
The simulation results (using data from the Census 2000 long form) presented in this working paper indicate that a substantial proportion of people who provided a general Hispanic response such as "Spanish," "Hispanic," or "Latino" to the question on Hispanic origin also provided more specific information in the place of birth or ancestry questions about their national origin. A number of factors have been proposed to explain the increased reporting of general Hispanic terms. Future research and testing will address these factors more fully.
The simulated totals presented in this report are illustrative and do not replace the official Census 2000 totals for these groups. The totals from Census 2000 are based on sample estimates from the Spanish/Hispanic/Latino question on the long form and are the official figures. The simulated totals provided in this paper do not fully reflect self-identification. Instead, they include: (1) the responses of those who self-identified into a specific group and (2) the responses of those who reported a general term and were tabulated into a specific group using responses to the place of birth or ancestry questions. In other words, respondents who provided a more general Hispanic response might, or might not, have provided a more specific response if the question wording or format had been different. It is impossible to predict with certainty how they would have responded to the Hispanic origin question had it been phrased differently. Given the increasingly frequent use of the more general terms "Hispanic" and "Latino" in the media, it would not be surprising if increasing numbers of people, especially those whose ancestors had come from Spanish-speaking countries two or more generations ago, identified with these terms rather than specific national origins. See the "Limitations" section below for further discussion of these issues.
The Census Bureau has attempted since the 1970 census to develop a self-identification question that would provide the most accurate and complete count of the entire Hispanic population in the United States. This effort has been complicated by the fact that no one term is universally recognized as encompassing all of this population. Terms such as "Hispanic," "Latino," and "Spanish" have been offered as alternatives. To address the challenge of obtaining a more accurate overall total, the Census Bureau has: (1) used response categories for some national-origin groups such as "Mexican," "Puerto Rican," and "Cuban," as well as the category "Other Hispanic" to provide a cue to respondents, and (2) used more than one overall term in the question’s wording.
The combination of these two approaches has improved the enumeration of the Hispanic population and meets the basic legislative requirement of providing an accurate count of the total Hispanic population, while also identifying the specific Hispanic groups that compose the Hispanic population. It is important to note that the basic law mandating the collection of data on the Hispanic population in censuses and surveys (Public Law 94-311) does not mandate that data be collected separately for specific Hispanic groups. Nevertheless, the Census Bureau has begun a research program to refine the question on Hispanic origin for the American Community Survey and for the 2010 Census and to address the issues raised in this paper.
Background
Table 1 shows the reported totals of Hispanic groups from the Census 2000 long form and the 1990 census sample (long) form.1
All Hispanic groups increased between 1990 and 2000 except Nicaraguans, Uruguayans, and Spaniards. Spaniards, in particular, declined significantly. The largest proportionate increases occurred in the reporting of "Hispanic," "Latino," "Other Central American," and "Other South American." The latter two categories include specific write-in responses of "Central American" and "South American."
A different pattern emerges, however, when we look at the percent distribution of the Hispanic population by group between 1990 and 2000. The percentages of general Hispanic groups were generally higher in 2000 than in 1990, but the percentages of specific origin groups were generally either at the same percentage or lower in 2000 than in 1990. For example, the proportion of the Hispanic population providing a specific origin was 83.9 percent in Census 2000 and 93.6 percent in the 1990 census. The Mexican origin population declined from 61.2 percent in 1990 to 59.3 percent in 2000; Puerto Rican origin declined from 12.1 percent to 9.7 percent; Cuban origin declined from 4.8 percent to 3.5 percent. The most dramatic decline was for reports of Spaniard, which fell from 2.4 percent to 0.3 percent.
Contrasting increases in the percentages of the general groups mirrored the declines in specific groups. For example, the percent "Latino" increased from less than 0.1 percent to 1.2 percent, "Hispanic" increased from 1.8 percent to 6.6 percent, "Spanish" increased slightly from 2.0 percent to 2.2 percent, and "Other Hispanic" increased from 2.6 percent to 5.8 percent. "Other Hispanic" includes: (1) people who provided responses such as "Latin American" and "Spanish American"; (2) people of mixed Hispanic ethnicities (only collected in Census 2000); and (3) people who checked the "Other" box but did not a provide a write-in entry. Thus, it is clear that the differences in the percentage distribution by Hispanic group reflect a shift in the reported composition of the Hispanic population.
Potential Reasons for Differences Between 1990 and 2000
Empirical evidence of question-design effects is documented in the results of the Census 2000 Alternative Questionnaire Experiment, which consisted of two mail-out, mail-back sample surveys conducted during Census 2000 (Martin 2002). One panel received the 1990-style Hispanic origin question and a control panel received the Census 2000-style Hispanic origin question. Taken as a group, the origins in the "Other" category that were named as examples in the 1990 question (Argentinian, Colombian, Dominican, Nicaraguan, Salvadoran, and Spaniard) received a lower percentage of responses in the 2000-style panel than in the 1990-style panel and the difference was statistically significant. Groups that were not shown as examples in the 1990 census question had a lower percentage in the Census 2000-style panel than in the 1990-style panel: 4.2 percent and 8.7 percent, respectively, and the difference was statistically significant.
| Hispanic Population by Origin Response | 1990 Census 2/ | Census 2000 2/ | ||
|---|---|---|---|---|
| Number | Percent | Number | Percent | |
| Total | 21,900,089 | 100.0 | 35,238,481 | 100.0 |
| General Hispanic | 1,403,150 | 6.4 | 5,540,627 | 15.7 |
| Hispanic | 390,945 | 1.8 | 2,316,515 | 6.6 |
| Latino | 1,577 | 0.0 | 411,559 | 1.2 |
| Spanish | 444,896 | 2.0 | 765,879 | 2.2 |
| Other Hispanic response 1/ | 565,732 | 2.6 | 2,046,674 | 5.8 |
| Mexican | 13,393,208 | 61.2 | 20,900,102 | 59.3 |
| Puerto Rican | 2,651,815 | 12.1 | 3,403,510 | 9.7 |
| Cuban | 1,053,197 | 4.8 | 1,249,820 | 3.5 |
| Dominican | 520,151 | 2.4 | 799,768 | 2.3 |
| Central American | 1,323,830 | 6.0 | 1,811,676 | 5.1 |
| Costa Rican | 57,223 | 0.3 | 72,175 | 0.2 |
| Guatemalan | 268,779 | 1.2 | 407,127 | 1.2 |
| Honduran | 131,066 | 0.6 | 237,431 | 0.7 |
| Nicaraguan | 202,658 | 0.9 | 194,493 | 0.6 |
| Panamanian | 92,013 | 0.4 | 98,475 | 0.3 |
| Salvadoran | 565,081 | 2.6 | 708,741 | 2.0 |
| Other Central American | 7,010 | 0.0 | 93,234 | 0.3 |
| South American | 1,035,602 | 4.7 | 1,419,979 | 4.0 |
| Argentinian | 100,921 | 0.5 | 107,275 | 0.3 |
| Bolivian | 38,073 | 0.2 | 45,188 | 0.1 |
| Chilean | 68,799 | 0.3 | 73,951 | 0.2 |
| Colombian | 378,726 | 1.7 | 496,748 | 1.4 |
| Ecuadorian | 191,198 | 0.9 | 273,013 | 0.8 |
| Paraguayan | 6,662 | 0.0 | 8,929 | 0.0 |
| Peruvian | 175,035 | 0.8 | 247,601 | 0.7 |
| Uruguayan | 21,996 | 0.1 | 20,242 | 0.1 |
| Venezuelan | 47,997 | 0.2 | 96,091 | 0.3 |
| Other South American | 6,195 | 0.0 | 50,941 | 0.1 |
| Spaniard | 519,136 | 2.4 | 112,999 | 0.3 |
In contrast, the percentage of the population reporting the general terms "Spanish," "Hispanic," and "Latino" was 1.9 percent in the 1990-style panel and 11.9 percent in the Census 2000-style panel. The percentage marking the "Other" category with no write-in or an uncodable write-in also was higher: 5.0 percent in the 1990-style panel and 7.2 percent in the Census 2000-style panel. The differences between both of these sets of percentages were statistically significant.
Logan (2002) commended the Census Bureau for doing an "excellent job" counting Hispanics overall, but faulted the Census Bureau for questionnaire design changes that appeared to lead to a disproportionate increase in the number of people reporting general rather than specific Hispanic origins. He argued that the lack of examples of specific groups in the "Other Spanish/Hispanic/Latino" write-in category on the Census 2000 questionnaire led to reporting general terms instead of specific Hispanic national-origin groups and resulted in lower than expected growth for certain Hispanic groups such as Dominicans and Salvadorans. Logan provided an alternative set of estimated totals for Hispanic national-origin groups by applying percentages of these groups from the pooled March 1998 and March 2000 Current Population Surveys to the Hispanic total from Census 2000.2
Suro (2002) applied percent distributions by detailed type of Hispanic origin from the Census 2000 Supplemental Survey (C2SS) to the Census 2000 Hispanic total population to derive alternative estimates of these groups. He noted that, unlike the CPS, the C2SS was based on a much larger sample and was conducted independently of the decennial census. Although both the Suro and Logan studies provide interesting information about the shift in distributions among different data collection systems, neither study provides direct evidence (using interview-reinterview or cognitive interview techniques) to support or reject the hypothesis that changes in question wording or structure directly affected a shift in reporting of Hispanic ethnicity.
A comparison of the results from the simulation presented in this working paper with the results of Logan’s and Suro’s research is provided in Appendix B.
Lavrakas et al. (2002) argued that dropping the term "origin" from the question was a major reason for the shift from national-origin terms to more general Hispanic terms. He hypothesized that the Census 2000 version connoted an "identity" question that was more subjective in its identification than the previous "origin" questions asked in the 1970, 1980, and 1990 censuses. Lavrakas stated that the earlier origin questions would have been interpreted as asking for a more "objective, factual characteristic" (Lavrakas, 2002:2). He used the results of a random-digit-dialing sample survey to conclude that not using the term "origin" resulted in a significant underestimate of the total number of Hispanics in the United States. His methodology, however, did not make his results comparable with anything produced by the Census Bureau. Instead of using the 1990-type question with the term "origin" or using the Census 2000 version with "origin" appended, Lavrakas used a series of questions, one of which was "Are any of your ancestors of Spanish, Hispanic, or Latino origin?" Using this expansive criterion, one would expect a larger number of people to answer "yes," including some who do not consider themselves to be Hispanic. The Census Bureau, after trying multiple identifiers of Hispanic ethnicity in the 1970 census, determined that the best method of identifying the Hispanic population was self-identification. This method allows respondents to identify their own origin groups and avoids the situation of having to employ a set of "objective" criteria or rules that themselves would be subject to disagreement and criticism because a universally agreed upon definition of who is Hispanic is lacking.
Siegel and Passel (1979) addressed the issue of defining Hispanic ethnicity in assessing the coverage of the Hispanic population in the 1970 census, when the Census Bureau first attempted to provide a comprehensive total for the Hispanic population. Data on Hispanic ethnicity in the 1970 census were collected and published using a variety of identifiers: Spanish mother tongue, Spanish language, Spanish surname, Spanish heritage, and Spanish origin or descent. Depending on the identifier, the count of the Hispanic population ranged from 9.1 million (using an "origin or descent" self-identification question similar to the one implemented in Census 2000) to 10.1 million (using the "Spanish language or surname" identifier based on supposedly more objective criteria3). The identifier selected for use by the Census Bureau, therefore, had a significant impact on the estimate of the Hispanic population. However, none of the Hispanic population totals could be replicated using standard demographic methods to estimate coverage. Siegel and Passel concluded that the Hispanic population is a socially defined group of people whose self-identification with the Hispanic population, and particularly with a given Hispanic group, may vary over time, even without variation in the question.
Thus, while issues raised by Martin, Suro and Logan concerning the impact of question wording or format appear to be valid, variability in the reporting of ethnicity based on self-identification also occurs because of social change, environmental factors, the "Census effect,"4 and other factors unrelated to wording and format. Lavrakis mainly demonstrated that the size of an ethnic group can be increased if membership is defined as beginning with historical ancestry.
Historical Context
Prior to 1970, Hispanic origin was determined only indirectly. For example, the 1950 and 1960 censuses collected and published data for "persons of Spanish surname" in Arizona, California, Colorado, New Mexico, and Texas, whereas the 1940 census identified people who reported Spanish as their "mother tongue." Mexican was included as a category within the race question only in the 1930 census.
Although the 1970, 1980, 1990, and 2000 censuses all allowed self identification of Hispanic ethnicity, the actual question wording differed from one census to the next (see Figure 1). The 1970 question was embedded within a question on place of birth on the 5-percent sample form5 and was worded: "Is this person’s origin or descent - (fill one circle)." The 1970 census was the first to include a separate question specifically on Hispanic origin that was included on the 5-percent sample questionnaire. A similar question was first asked of everyone in 1980. Like the 1980 census, the 1970 census question allowed identification as "Mexican," "Puerto Rican," "Cuban," and "Other Spanish" categories, but the 1970 census included an additional category for "Central or South American" that did not appear in the 1980 question.6
The 1980 question, asked on a 100-percent basis, was more direct in asking people to identify as Hispanic or not Hispanic and was worded, "Is this person of Spanish/Hispanic origin or descent?" The 1980 census provided response choices of "Mexican," "Puerto Rican," "Cuban," or "Other Spanish/Hispanic" origin but did not allow further identification of Hispanic ethnicity.
The 1990 census question ("Is ... of Spanish/Hispanic origin") was the same as the 1980 question except for the deletion of the words "or descent." The 1990 census was the only one to include examples of "other" Hispanic groups. In addition, this census was the first in which the groups that composed the "other Spanish/Hispanic" origin groups were coded and tabulated, although only for the portion of the population returning long forms.
The Census 2000 question was similar to the 1990 question except that the term "Latino" was added and the word "origin" was dropped ("Is this person Spanish/Hispanic/Latino?"). In Census 2000, people of Spanish/Hispanic/Latino origin could identify themselves as Mexican, Puerto Rican, Cuban, or other Spanish/Hispanic/Latino by marking a check box. People who marked "other Spanish/Hispanic/Latino" had additional space to write Hispanic origins, such as Salvadoran or Dominican, a practice started in the 1990 census. Unlike the 1990 census question, the Census 2000 question did not include examples of groups in the "other Spanish/Hispanic/Latino" category, but write-in responses were coded from all forms.
It is clear from this brief review that both question wording and format have changed with each census from 1970 to 2000. What is not clear is the impact these changes might have on the comparability of results among the censuses.
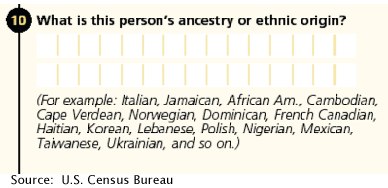
Simulation of Responses Using Place of Birth and Ancestry Data from the Census 2000 Long Form
The simulation results presented in this working paper consisted of using the information from the place of birth and ancestry questions on the Census 2000 long (sample) form to examine possible specific Hispanic origins for people who reported a general response to the Hispanic origin question.
The process for attempting to obtain a more specific national origin consisted of four steps:
Limitations
Several limitations to this simulation apply. First, it assumes that the specific Hispanic origin groups can only grow larger while the Hispanic total is left unchanged. However, 2.6 million people indicated a general Hispanic response in the question on origin but did not provide an Hispanic national origin in the place of birth or ancestry questions. In these cases, we did not assume for the purpose of the simulation analysis that they were not Hispanic. Second, the simulation made no adjustment when individuals reported an Hispanic national-origin group in the question on origin but provided no other evidence of Hispanic ethnicity in the place of birth or ancestry questions. Third, the simulation made no adjustment when individuals indicated they were not Hispanic in the question on origin but did provide evidence of Hispanic ethnicity in the place of birth or ancestry questions. Fourth, people reporting mixed Hispanic ethnicities (for example, Mexican-Puerto Rican, Cuban-Salvadoran, and so on) had the same unique code (291) and were tabulated in the "Other Spanish/Hispanic/Latino" category. The original response was not available in the file used to conduct this simulation, therefore, we could not choose one of the two Hispanic origins reported and tabulate their response in the appropriate Hispanic group.
The second and third limitations, which involve apparent inconsistencies, reflect the complexity underlying the reporting of ethnicity and highlight the problem of trying to simulate or "second guess" the self-identification of respondents using other indicators of ethnicity. Trying to develop a composite measure of Hispanic ethnicity using a combination of responses from the Hispanic origin, place of birth, and ancestry questions undermines the principle of self-identification and can lead to endless discussion about who is "Hispanic" and what is the size of the Hispanic population. In fact, the experience of using multiple indicators of Hispanic ethnicity in the 1970 census led the Census Bureau to decide that self-identification using a single question on Hispanic origin was the best method for counting this population group.
To illustrate the second limitation discussed above, a similar tabulation, using the same simulation logic, was run for individuals who marked the Mexican, Puerto Rican, and Cuban checkbox categories to demonstrate the complexities of using place of birth and ancestry to "supplement" responses based on self-identification and to determine the extent to which the reported country of birth or ancestry was consistent with the specific checkbox. Table 2 below shows the results of this analysis.
Table 2. Percent of People Marking the Mexican, Puerto Rican or Cuban Checkboxes by Their Responses to the Place of Birth and Ancestry Questions
| Place of Birth 1/ | First Ancestry 1/ | Second Ancestry 1/ | |
|---|---|---|---|
| Mexican | 41.2% | 84.0% | 85.0% |
| Puerto Rican | 38.4% | 76.2% | 78.7% |
| Cuban | 68.7% | 87.9% | 89.2% |
This table shows that 41 percent of people who marked the "Mexican, Mexican American, Chicano" checkbox for the question on origin were born in Mexico. This percentage increased dramatically to 84 percent when the first ancestry response was included. Including the second reported ancestry increased the percentage to 85 percent. About 15 percent of people who marked the "Mexican" checkbox in the question on origin did not indicate that they were born in Mexico or were of Mexican ancestry.
This last result does not imply that these people were not of Mexican origin. It merely indicates that self-identification encompasses many factors that would be practically impossible to obtain using just the place of birth and ancestry questions. (Similar results were obtained for people who marked the Puerto Rican and Cuban checkboxes.) In short, the analysis suggests that the simulated results for the general Hispanic terms are merely informative and should not be used to model future demographic trends except to support the hypothesis that the reporting of generic responses will continue to increase.
Definition of General Hispanic Responses
For the purposes of this paper, a general response to the Hispanic origin question is one that does not stipulate an Hispanic national-origin group (e.g., Mexican, Salvadoran, Cuban, and so on). Responses considered "general" included people who marked the "Other Spanish/Hispanic/Latino" checkbox in the question on origin and did not write in a response and people whose write-in response was coded as: "Spanish (282)," "Hispanic (281)," "Latino (250)," "Other Central American,"8 "Other South American,"9 or "Other Hispanic."10
Place of Birth
In this simulation, we first examined the place of birth response to determine if people who provided a general response were born in any of the Hispanic countries listed in Table 3.
Table 3. Hispanic Places of Birth and Place of Birth Codes
| Country | Code |
|---|---|
| Argentina | (360) |
| Bolivia | (361) |
| Central America | (317) |
| Chile | (363) |
| Colombia | (364) |
| Costa Rica | (311) |
| Cuba | (327) |
| Dominican Republic | (329) |
| Ecuador | (365) |
| El Salvador | (312) |
| Guatemala | (313) |
| Honduras | (314) |
| Mexico | (303) |
| Nicaragua | (315) |
| Panama | (316) |
| Paraguay | (369) |
| Peru | (370) |
| Puerto Rico | (072) |
| South America | (374) |
| Spain | (134) |
| Uruguay | (372) |
| Venezuela | (373) |
Ancestry
If place of birth information failed to provide a specific Hispanic country of origin, we examined responses to the ancestry question to determine if people named a specific Hispanic origin in either the first or second ancestry report. The following ancestries were recognized as specific Hispanic origins for the purposes of this simulation:
Table 4. Hispanic Ancestries and Ancestry Codes
| Ancestry | Code |
|---|---|
| Argentinean | (231) |
| Bolivian | (232) |
| Central American* | (227-230) |
| Chilean | (233) |
| Colombian | (234) |
| Costa Rican | (221) |
| Cuban | (271-274) |
| Dominican | (275) |
| Ecuadorian | (235) |
| Guatemalan | (222) |
| Honduran | (223) |
| Mexican | (210-220) |
| Nicaraguan | (224) |
| Panamanian | (225) |
| Paraguayan | (236) |
| Puerto Rican | (261-270) |
| Salvadoran | (226) |
| South American* | (249) |
| Spaniard | (200-209) |
| Uruguayan | (238) |
| Venezuelan | (239) |
* Responses of "Central American" and "South American" ancestry were assumed to be "specific" for the purpose of this simulation.
Results and Key Findings
An estimated 5.7 million people chose a general Hispanic term to define their ethnicity in Census 2000 - see Table 5. Of these, about 3.1 million people (54 percent) also provided more information about specific Hispanic origins in their responses to the place of birth or ancestry questions, leaving about 2.6 million people who reported no additional specific information. Specific Hispanic groups were inferred from the declared place of birth for about 1.6 million people and from the declared ancestry of the remaining 1.4 million. This simulation, by definition, increases the size of specific Hispanic origin groups and reduces the general Hispanic population, leaving the total Hispanic population unchanged.
Table 5. General Hispanic Population by Simulation Status
| Number | Percent | |
|---|---|---|
| Total General Hispanic Responses | 5,685,000 | 100.0 |
| Specific Hispanic Origin Reported in Place of Birth | 1,635,000 | 28.8 |
| Specific Hispanic Origin not Reported in Place of Birth but Reported in Ancestry | 1,435,000 | 25.2 |
| No Specific Hispanic Origin Reported in Place of Birth or Ancestry | 2,615,000 | 46.0 |
Combining the Census 2000 totals of specific Hispanic origin groups with those for people who provided a general response to the origin question and a specific Hispanic origin in the place of birth or ancestry questions resulted in some interesting findings.
The simulated Mexican origin total was 1.4 million larger than the Census 2000 total of 20.9 million (Table 6). This difference represents nearly half (47 percent) of all people reporting general Hispanic ethnicity when the simulation found a specific Hispanic origin in place of birth or ancestry and suggests that an "example effect" does not explain the lower percentage of people reporting Mexican origin in the 2000-style question (without examples) than in the 1990-style question (with examples). Both questions included Mexican as a checkbox category.
Proportionally, Spaniards experienced the highest percentage increase (69 percent) of the specific Hispanic origin groups, going from a total of 112,999 in Census 2000 to a combined total of 190,656 in the simulation (see Table 6). All the specific Hispanic origin groups experienced an increase of at least 24 percent, except for Mexicans, Puerto Ricans and Cubans, who had the lowest percentage increases (7 percent, 4 percent and 5 percent, respectively).
Among the general Hispanic responses, "Hispanic" and "Other Hispanic" experienced the largest numeric decreases (-1,248,733 and -1,157,266 respectively). These two groups combined accounted for about three-fourths (76 percent) of the decrease in the general Hispanic population. In fact, all the general Hispanic groups experienced significant reductions, with "Other South American" experiencing the smallest numerical decrease (-34,230). The percent decrease for each of the general Hispanic groups based on this simulation is shown in Table 6. The "Latino" and "Other Central American" groups had the largest percentage decreases (-77 percent and -74 percent, respectively), while the "Spanish" group had the smallest percentage decrease (-32 percent). Table 7 (shown in Appendix A) provides more detailed information from this simulation.
Table 6. Census 2000 Hispanic Origin Groups and Results of Simulation Showing Place of Birth and Ancestry Responses for People Reporting a General Hispanic Origin
| Hispanic Population by Origin Response | Census 2000 Hispanic Origin (1) | Combined Total: Census 2000 Hispanic Origin + Specific Hispanic Origins Based on Responses to Place of Birth or Ancestry Question (2) |
Number Difference: Combined Total for Hispanic Origin - Census 2000 Hispanic Origin (3) = (2) - (1) |
Percent Difference: Combined Total for Hispanic Origin - Census 2000 Hispanic Origin (4) = (3)/(1) * 100 |
|---|---|---|---|---|
| Total | 35,238,481 | 35,238,481 | 0 | (X) |
| General Hispanic | 5,540,627 | 2,574,296 | -2,966,331 | -53.5 |
| Hispanic | 2,316,515 | 1,067,782 | -1,248,733 | -53.9 |
| Latino | 411,559 | 93,783 | -317,776 | -77.2 |
| Spanish | 765,879 | 523,323 | -242,556 | -31.7 |
| Other general response 1/ | 2,046,674 | 889,408 | -1,157,266 | -56.5 |
| Mexican | 20,900,102 | 22,338,311 | 1,438,209 | 6.9 |
| Puerto Rican | 3,403,510 | 3,539,988 | 136,478 | 4.0 |
| Cuban | 1,249,820 | 1,312,127 | 62,307 | 5.0 |
| Dominican | 799,768 | 999,561 | 199,793 | 25.0 |
| Central American | 1,811,676 | 2,435,731 | 624,055 | 34.4 |
| Costa Rican | 72,175 | 93,583 | 21,408 | 29.7 |
| Guatemalan | 407,127 | 574,785 | 167,658 | 41.2 |
| Honduran | 237,431 | 333,636 | 96,205 | 40.5 |
| Nicaraguan | 194,493 | 272,655 | 78,162 | 40.2 |
| Panamanian | 98,475 | 126,500 | 28,025 | 28.5 |
| Salvadoran | 708,741 | 1,010,740 | 301,999 | 42.6 |
| Other Central American | 93,234 | 23,832 | -69,402 | -74.4 |
| South American | 1,419,979 | 1,847,811 | 427,832 | 30.1 |
| Argentinian | 107,275 | 132,864 | 25,589 | 23.9 |
| Bolivian | 45,188 | 65,220 | 20,032 | 44.3 |
| Chilean | 73,951 | 98,057 | 24,106 | 32.6 |
| Colombian | 496,748 | 653,029 | 156,281 | 31.5 |
| Ecuadorian | 273,013 | 380,428 | 107,415 | 39.3 |
| Paraguayan | 8,929 | 12,806 | 3,877 | 43.4 |
| Peruvian | 247,601 | 339,027 | 91,426 | 36.9 |
| Uruguayan | 20,242 | 27,401 | 7,159 | 35.4 |
| Venezuelan | 96,091 | 122,268 | 26,177 | 27.2 |
| Other South American | 50,941 | 16,711 | -34,230 | -67.2 |
| Spaniard | 112,999 | 190,656 | 77,657 | 68.7 |
1/ Includes: 1) people who provided responses such as "Latin American" and "Spanish American," 2) people of mixed Hispanic ethnicities, and 3) people who checked the "Other" box but did not provide a write-in entry.
Source: Census 2000 and results of simulation.
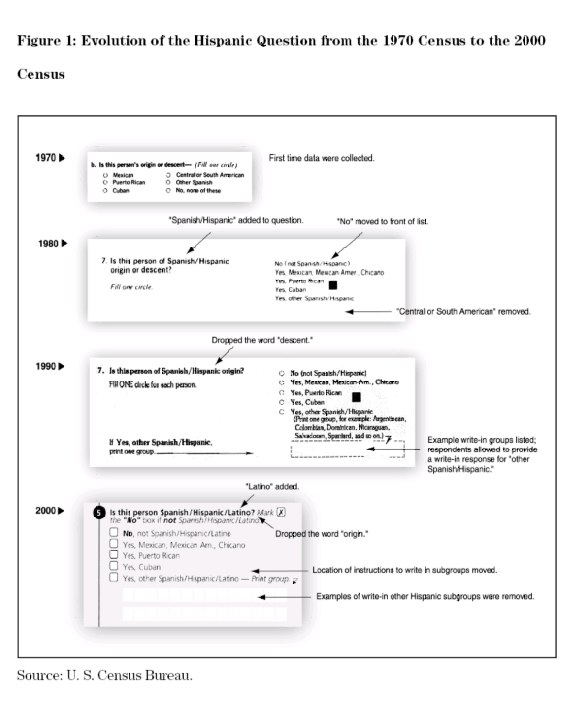
Figure 2. Census 2000 Question on Place of Birth
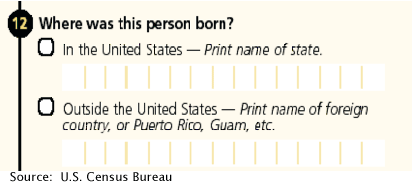
Figure 3. Census 2000 Question on Ancestry
1 The numbers of people of Hispanic origin by type of Hispanic origin differ between the 100-percent count and the sample estimate. For example, the number of "Other Spanish/Hispanic/Latino" people, excluding Dominicans, Spaniards, and people of Central or South American (Hispanic) origin, was 6.1 million for the 100-percent count and 5.7 million in the sample estimate. Reasons for these differences include sampling error and the possible influence of place of birth and ancestry questions that appear only on the long form.
2 When comparing Hispanic origin data from the Current Population Survey (CPS) with comparable data from the decennial census, it is important to note that: 1) the CPS question differs significantly from the decennial census question, 2) data from the CPS are obtained solely through experienced field representatives while the majority of responses from the decennial census are obtained from self-reporting based on the mail-out, mail-back questionnaire, and 3) the population universe for the CPS is the civilian non-institutional population.
3 The "Spanish language or surname" population in 1970 comprised: 1) people of Spanish mother tongue, 2) all people in families in which the householder or spouse reported Spanish mother tongue, and 3) people of Spanish surname in the five Southwestern States (Arizona, California, Colorado, New Mexico and Texas).
4 The environment of a census, with its intense and pervasive advertising, may have its own unique effect on reporting of race and ethnicity.
5 The 1970 census used matrix sampling with three different sample forms: 1) a five-percent sample form, 2) a fifteen percent sample form, and 3) a combined 5 and 15 percent sample form resulting in a 20 percent sample.
6 The response category "Central or South American" was dropped from the 1970 version of the question because of strong evidence of misreporting into this category by non-Hispanic people in the Central and Southern states in the United States.
7 This simulation also was run using responses from the ancestry question first and then using responses from the place of birth question and the results were about the same.
8 This category is composed of the following two codes: Central American (227) and Central American Indian (228).
9 This category is composed of the following three codes: South American Indian (240), Criollo (241), and South American (242).
10 This category is composed of the following codes: "Other Spanish/Hispanic/Latino" check box only (280), Californio (283), Tejano (284), Nuevo Mexicano (285), Spanish American (286), Spanish American Indian (287), Meso American Indian (288), Mestizo (289), Caribbean (290), Multiple Hispanic origin (291), Other Spanish/Hispanic, n.e.c. (299).
11 Argentinean is not significantly different from 24 percent.
The data contained in this report are based on the sample of households who responded to the Census 2000 long form. Nationally, approximately one out of every six housing units was included in this sample. As a result, the sample estimates may differ somewhat from the100-percent figures that would have been obtained if all housing units, people within those housing units, and people living in group quarters had been enumerated using the same questionnaires, instructions, enumerators, and so forth. The sample estimates also differ from the values that would have been obtained from different samples of housing units, people within those housing units, and people living in group quarters. The deviation of a sample estimate from the average of all possible samples is called the sampling error.
In addition to the variability that arises from the sampling procedures, both sample data and 100-percent data are subject to nonsampling error. Nonsampling error may be introduced during any of the various complex operations used to collect and process data. Such errors may include: not enumerating every household or every person in the population, failing to obtain all required information from the respondents, obtaining incorrect or inconsistent information, and recording information incorrectly. In addition, errors can occur during the field review of the enumerators’ work, during clerical handling of the census questionnaires, or during the electronic processing of the questionnaires.
Nonsampling error may affect the data in two ways: (1) errors that are introduced randomly will increase the variability of the data and, therefore, should be reflected in the standard errors; and (2) errors that tend to be consistent in one direction will bias both sample and 100-percent data in that direction. For example, if respondents consistently tend to underreport their incomes, then the resulting estimates of households or families by income category will tend to be understated for the higher income categories and overstated for the lower income categories. Such biases are not reflected in the standard errors.
While it is impossible to eliminate completely error from an operation as large and complex as the decennial census, the Census Bureau attempts to control the sources of such error during the data collection and processing operations. The primary sources of error and the programs instituted to control error in Census 2000 are described in detail in Summary File 3 Technical Documentation under Chapter 8, "Accuracy of the Data," located at www.census.gov/prod/cen2000/doc/sf3.pdf.
All statements in this Census 2000 Brief have undergone statistical testing and all comparisons are significant at the 90-percent confidence level, unless otherwise noted. Further information on the accuracy of the data is located at www.census.gov/prod/cen2000/doc/sf3.pdf. For further information on the computation and use of standard errors, contact the Decennial Statistical Studies Division at 301-763-4242.
Table 7. Census 2000 Hispanic Origin Groups and Results of Simulation Showing Place of Birth and Ancestry Responses for People Reporting a General Hispanic Origin
| Hispanic Population by Origin Response | Census 2000 Hispanic Origin (1) | Combined Total: Census 2000 Hispanic Origin + Specific Hispanic Origins Based on Responses to the Place of Birth Question Only (2) |
Percent difference: Combined Total (Place of Birth Only) - Census 2000 Hispanic Origin (3) = (2) - (1)/(1) * 100 |
Combined Total: Census 2000 Hispanic Origin + Specific Hispanic Origins Based on Responses to Place of Birth and Ancestry Questions (4) |
Percent difference: Combined Total (Place of Birth and and Ancestry) - Combined Total (Place of Birth Only) (5) = (4)-(2)/(2) * 100 |
Simulated Totals Relative to Census 2000 Totals | |
|---|---|---|---|---|---|---|---|
| Number difference: Combined Total (Place of Birth and Ancestry) - Census 2000 Hispanic Origin (6) = (4) - (1) |
Percent difference: Combined Total (Place of Birth and Ancestry) - Census 2000 Hispanic Origin (7) = (6)/(1) * 100 |
||||||
| Total | 35,238,481 | 35,238,481 | NA | 35,238,481 | NA | 0 | (X) |
| General Hispanic | 5,540,627 | 4,002,025 | -27.8 | 2,574,296 | -35.7 | -2,966,331 | -53.5 |
| Hispanic | 2,316,515 | 1,757,068 | -24.2 | 1,067,782 | -39.2 | -1,248,733 | -53.9 |
| Latino | 411,559 | 163,183 | -60.4 | 93,783 | -42.5 | -317,776 | -77.2 |
| Spanish | 765,879 | 599,086 | -21.8 | 523,323 | -12.6 | -242,556 | -31.7 |
| Other general response 1/ | 2,046,674 | 1,482,688 | -27.6 | 889,408 | -40.0 | -1,157,266 | -56.5 |
| Mexican | 20,900,102 | 21,417,695 | 2.5 | 22,338,311 | 4.3 | 1,438,209 | 6.9 |
| Puerto Rican | 3,403,510 | 3,442,815 | 1.2 | 3,539,988 | 2.8 | 136,478 | 4.0 |
| Cuban | 1,249,820 | 1,267,012 | 1.4 | 1,312,127 | 3.6 | 62,307 | 5.0 |
| Dominican | 799,768 | 924,934 | 15.7 | 999,561 | 8.1 | 199,793 | 25.0 |
| Central American | 1,811,676 | 2,295,350 | 26.7 | 2,435,731 | 6.1 | 624,055 | 34.4 |
| Costa Rican | 72,175 | 88,337 | 22.4 | 93,583 | 5.9 | 21,408 | 29.7 |
| Guatemalan | 407,127 | 540,149 | 32.7 | 574,785 | 6.4 | 167,658 | 41.2 |
| Honduran | 237,431 | 316,701 | 33.4 | 333,636 | 5.3 | 96,205 | 40.5 |
| Nicaraguan | 194,493 | 255,388 | 31.3 | 272,655 | 6.8 | 78,162 | 40.2 |
| Panamanian | 98,475 | 119,891 | 21.7 | 126,500 | 5.5 | 28,025 | 28.5 |
| Salvadoran | 708,741 | 947,260 | 33.7 | 1,010,740 | 6.7 | 301,999 | 42.6 |
| Other Central American | 93,234 | 27,624 | -70.4 | 23,832 | -13.7 | -69,402 | -74.4 |
| South American | 1,419,979 | 1,739,791 | 22.5 | 1,847,811 | 6.2 | 427,832 | 30.1 |
| Argentinian | 107,275 | 127,067 | 18.4 | 132,864 | 4.6 | 25,589 | 23.9 |
| Bolivian | 45,188 | 61,328 | 35.7 | 65,220 | 6.3 | 20,032 | 44.3 |
| Chilean | 73,951 | 92,465 | 25.0 | 98,057 | 6.0 | 24,106 | 32.6 |
| Colombian | 496,748 | 610,987 | 23.0 | 653,029 | 6.9 | 156,281 | 31.5 |
| Ecuadorian | 273,013 | 353,604 | 29.5 | 380,428 | 7.6 | 107,415 | 39.3 |
| Paraguayan | 8,929 | 12,202 | 36.7 | 12,806 | 5.0 * | 3,877 | 43.4 |
| Peruvian | 247,601 | 318,358 | 28.6 | 339,027 | 6.5 | 91,426 | 36.9 |
| Uruguayan | 20,242 | 26,090 | 28.9 | 27,401 | 5.0 * | 7,159 | 35.4 |
| Venezuelan | 96,091 | 117,573 | 22.4 | 122,268 | 4.0 | 26,177 | 27.2 |
| Other South American | 50,941 | 20,117 | -60.5 | 16,711 | -16.9 | -34,230 | -67.2 |
| Spaniard | 112,999 | 148,859 | 31.7 | 190,656 | 28.1 | 77,657 | 68.7 |
Table 7 in an excel spreadsheet.
Comparison of Results from This Simulation with Results from Suro’s and Logan’s Analyses
Totals for Hispanic national-origin groups resulting from this study as shown in Table 8 below differ somewhat from those derived from the studies conducted by Suro and Logan, tending to be higher than the Suro estimates, but lower than the Logan estimates. Part of the reason for these differences results from the different methodologies used in each set of estimates. Note, however, that appropriate standard errors were not available to test whether differences between the Census Bureau’s simulated totals in this working paper and the estimated totals produced by Suro and Logan were statistically significant.
Logan essentially used the percentage "Other Hispanic" from the pooled March 1998 and March 2000 Current Population Survey (CPS) samples as his "target" or "real" percentage for the appropriate proportion of Other Hispanic. For all states and metropolitan areas with 400 or more Hispanic sample cases, he derived this target percentage and applied it to all tracts where the percentage of Other Hispanic in that tract was greater than the target. In tracts that exceeded the target percentage, the "excess" percentage was redistributed according to the distribution of the specific national origins reported in that tract. Given that Logan generated a target percentage of 3.3 percent from the CPS (in contrast to 16.1 percent in Census 2000, based on the long form estimate), it is not surprising that his estimates of Hispanic national-origin groups exceeded the totals from the simulation shown in this working paper.
Suro, on the other hand, applied the percentage of national-origin Hispanics from the C2SS to the Census 2000 totals to derive his estimate. He did not have access to information from public-use micro-data files that would have allowed more detailed assignment based on place of birth or ancestry responses. To the extent that the percent "Other Hispanic" in the C2SS was "overstated" (according to Logan’s definition) and without the benefit of additional information from place of birth and ancestry questions, it is not surprising that Suro’s estimates of Hispanic national-origin groups tended to be lower than both Logan’s estimates and the simulated totals from this study.
Table 8. Comparison of Results from Suro, Logan, and Census Bureau Studies on General Hispanic Reporting
| Type of Hispanic Origin | Census Bureau Simulation Result | Suro Paper 1/ | Difference: Suro - Census Simulation Results | Logan Paper 1/ | Difference: Logan - Census Simulation Results | |||
|---|---|---|---|---|---|---|---|---|
| Number 1/ | Standard error (90-percent confidence level) | Number | Percent | Number | Percent | |||
| Total | 35,238,481 | 34,824 | 35,305,817 | NA | NA | 35,305,818 | NA | NA |
| Mexican | 22,338,311 | 28,444 | 22,107,866 | -230,445 | -1.0 | 23,060,224 | 721,913 | 3.2 |
| Puerto Rican | 3,539,988 | 11,727 | 3,558,755 | 18,767 | 0.5 | 3,640,460 | 100,472 | 2.8 |
| Cuban | 1,312,127 | 7,168 | 1,262,894 | -49,233 | -3.8 | 1,315,346 | 3,219 | 0.2 |
| Dominican | 999,561 | 6,260 | 938,316 | -61,245 | -6.1 | 1,121,257 | 121,696 | 12.2 |
| Central American | 2,435,731 | 9,746 | 2,336,185 | -99,546 | -4.1 | 2,863,063 | 427,332 | 17.5 |
| Costa Rican | 93,583 | 1,918 | 86,158 | -7,425 | -7.9 | 115,672 | 22,089 | 23.6 |
| Guatemalan | 574,785 | 4,750 | 534,951 | -39,834 | -6.9 | 627,329 | 52,544 | 9.1 |
| Honduran | 333,636 | 3,621 | 315,343 | -18,293 | -5.5 | 362,171 | 28,535 | 8.6 |
| Nicaraguan | 272,655 | 3,273 | 244,886 | -27,769 | -10.2 | 294,334 | 21,679 | 8.0 |
| Panamanian | 126,500 | 2,230 | 121,049 | -5,451 | -4.3 | 164,371 | 37,871 | 29.9 |
| Salvadoran | 1,010,740 | 6,294 | 958,487 | -52,253 | -5.2 | 1,117,959 | 107,219 | 10.6 |
| Other Central American | 23,832 | 968 | 75,311 | 51,479 | 216.0 | 181,228 | 157,396 | 660.4 |
| South American | 1,847,811 | 8,498 | 1,710,385 | -137,426 | -7.4 | 2,169,669 | 321,858 | 17.4 |
| Argentinean | 132,864 | 2,286 | 123,574 | -9,290 | -7.0 | 168,991 | 36,127 | 27.2 |
| Bolivian | 65,220 | 1,602 | 80,623 | 15,403 | 23.6 | 70,545 | 5,325 | 8.2 |
| Chilean | 98,057 | 1,964 | 81,888 | -16,169 | -16.5 | 117,698 | 19,641 | 20.0 |
| Colombian | 653,029 | 5,063 | 588,215 | -64,814 | -9.9 | 742,406 | 89,377 | 13.7 |
| Ecuadorian | 380,428 | 3,866 | 347,301 | -33,127 | -8.7 | 396,400 | 15,972 | 4.2 |
| Parguayan | 12,806 | 710 | 9,451 | -3,355 | -26.2 | 14,492 | 1,686 | 13.2 |
| Peruvian | 339,027 | 3,650 | 279,384 | -59,643 | -17.6 | 381,850 | 42,823 | 12.6 |
| Uruguayan | 27,401 | 1,038 | 22,680 | -4,721 | -17.2 | 30,010 | 2,609 | 9.5 |
| Venezuelan | 122,268 | 2,193 | 114,700 | -7,568 | -6.2 | 149,309 | 27,041 | 22.1 |
| Other South American | 16,711 | 811 | 62,569 | 45,858 | 274.4 | 97,969 | 81,258 | 486.3 |
| Other Hispanic Latino | 2,764,952 | 10,378 | 3,391,416 | 626,464 | 22.7 | 1,135,799 | -1,629,153 | -58.9 |
| Spaniard | 190,656 | 2,738 | 303,439 | 112,783 | 59.2 | NA | NA | NA |
| Spanish | 523,323 | 4,533 | 709,598 | 186,275 | 35.6 | NA | NA | NA |
| All Other Hispanic/Latin 2/ | 2,050,973 | 8,950 | 2,378,379 | 327,406 | 16.0 | NA | NA | NA |
NOTE: Appropriate standard errors were not available to test whether differences between the Census Bureau’s simulated totals and the estimated totals produced by Suro and Logan were statistically significant.
1/ Suro’s and Logan’s research used Hispanic data based on 100-percent totals. Simulated Census 2000 totals were based on sample data.
2/ Includes "Hispanic," "Latino," and "Other Hispanic" response from Table 7.
Table 8 in an excel spreadsheet.