Experimental All Employee Hours and Earnings Series from the Current
Employment Statistics Program
Background
The Current Employment Statistics (CES) program began work in 2005 to add new series on hours and earnings. New series have been developed to measure the average hourly earnings and average weekly hours of all nonfarm private-sector employees. Additionally, CES is adding average overtime hours in manufacturing. Historically, the CES program has published average hours and earnings series for production workers in the goods-producing industries and non-supervisory workers in the service-providing industries. These workers account for about 80 percent of total private nonfarm employment.
The new hours and earnings series are more comprehensive in coverage, thereby providing improved information for analyzing economic trends and for constructing other major economic indicators, including nonfarm productivity and personal income.
Experimental designation and future publication plans
- BLS is designating the first release of these new series as experimental because of the limited experience to date with the editing and review of the sample reports and the resultant estimates. BLS began the first collection of the all employee payroll and hours data from respondents late in 2005. There is not yet sufficient historical data to allow seasonal adjustment of the new series.
The first release of experimental series on April 6, 2007, included National level estimates at a total private sector level and limited industry detail from March 2006 through January 2007. Each month the experimental estimates are released on the same date as the Employment Situation news release (typically the first Friday of the month). In April 2008 BLS began releasing some first preliminary estimates. As BLS and data users gain more experience with these new experimental data series, additional industry detail may be released, and publication of second preliminary estimates may be added.
By the end of 2009, BLS should have sufficient historical data to seasonally adjust the all employee payroll and hours series and is planning to publish them as official CES data in the Employment Situation news release and other BLS publications beginning in February 2010.
State series – BLS began publishing experimental estimates of hours and earnings for all employees in limited detail for all States on March 11, 2008; see www.bls.gov/sae/saeaepp.htm. These series include average hourly earnings and average weekly hours.
Definitions and Methodology - In order to publish all employee average weekly hours, average hourly earnings, and average weekly earnings, BLS is collecting all employees total payroll and all employees total hours from survey respondents. The definitions of these data items parallel the definitions used for the production worker payroll and hours data; the only difference is that they cover all employees rather than just production or non-supervisory workers. See www.bls.gov/ces/idcf/forme_mp.pdf for a sample collection form. Additionally, the same estimation formulas currently used for the published series on production and non-supervisory workers are used for the all employee hours and earnings series. More detailed information on current estimation formulas can be found at www.bls.gov/web/cestn1.htm
.
Gross Monthly Earnings - BLS began the collection and experimental publication of new gross monthly earnings series (GME) concurrent with the all employee hours and earnings series. The series had a broader scope than the CES average hourly and weekly earnings series. GME series were defined to include bonuses and other irregular payments to workers.
Discontinuation of experimental gross monthly earnings - Following the release of October 2008 GME series on January 9, 2009 BLS will discontinue the collection and publication of the GME data. The decision to discontinue these series stems from data quality limitations. Throughout the test period for collection and production of the GME series, BLS has experienced low response rates for the GME data item, response error issues, and difficulty developing an estimator that can adequately reflect the underlying volatility that exists in an earnings series that includes bonuses and other irregular payments.
The CES GME series was designed to be very similar in definition to the total wages concept used in the BLS Quarterly Census of Employment and Wages program, though not precisely the same. Total wage definitions vary slightly across States due to differing Unemployment Insurance coverage while the CES GME was defined consistently across all States. The concepts are similar enough however that the CES GME could be compared against the QCEW total wages figures to help gauge the accuracy of the GME estimates. The QCEW total wages figures essentially represent a universe count, and thus serve as an informal benchmark against which to compare the GME estimates.
Comparisons showed that the GME series are consistently biased downward by a substantial amount during the first and fourth quarter of the year, a time when end-of-year bonuses and other payments cause the QCEW total wages to spike upward. BLS research indicated that this problem is largely traceable to low item response rates for GME and incomplete reporting of total wages in the CES survey responses. Further follow back efforts with CES survey respondents indicated that many simply do not have timely access to the information needed to report comprehensive GME figures.
Further compounding the problem is that many of the large year-end payments that underlie the QCEW total wages spikes in fourth and first quarters are concentrated in a relatively small number of firms; when even a few of these firms do not respond, or can not report accurately to the CES survey, the resultant GME estimates are not reliable. In addition to respondent follow back, BLS researched several different estimation techniques; however, none of them were able to overcome the inherent limitations caused by missing and incomplete survey responses.
BLS has therefore concluded that producing estimates for GME from the CES survey is not viable; the data simply are not reliable enough for BLS to continue production of these series.
Experimental Data Series are presented below in tables and charts. BLS welcomes user comments and inquiries on these data series via email.
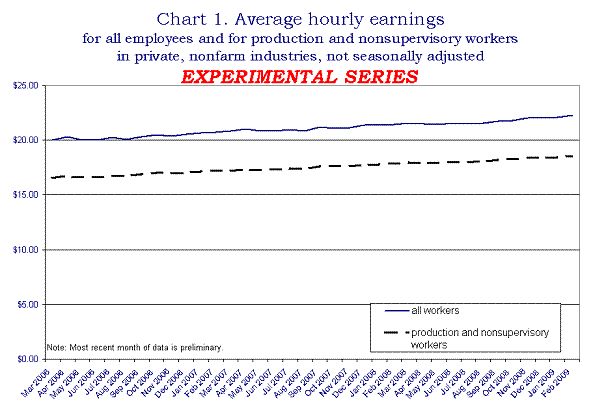
Table 1. Average hourly earnings of all employees on private nonfarm payrolls by industry sector and selected industry detail, not seasonally adjusted, 2006
| EXPERIMENTAL SERIES |
Industry |
Mar. 2006 |
Apr. 2006 |
May 2006 |
Jun. 2006 |
Jul. 2006 |
Aug. 2006 |
Sep. 2006 |
Oct. 2006 |
Nov. 2006 |
Dec. 2006 |
Total private |
20.02 |
20.32 |
20.02 |
20 |
20.24 |
20.09 |
20.31 |
20.46 |
20.39 |
20.55 |
Goods-producing |
21.16 |
21.41 |
21.18 |
21.25 |
21.44 |
21.36 |
21.53 |
21.7 |
21.69 |
21.97 |
Mining and logging |
22.91 |
23.64 |
23.21 |
23.47 |
23.77 |
23.39 |
23.63 |
24.32 |
24.85 |
24.81 |
Construction |
21.84 |
22.02 |
21.93 |
22.05 |
22.19 |
22.2 |
22.43 |
22.55 |
22.51 |
22.75 |
Manufacturing |
20.74 |
20.98 |
20.69 |
20.7 |
20.91 |
20.8 |
20.95 |
21.1 |
21.1 |
21.42 |
Durable goods |
21.68 |
21.88 |
21.6 |
21.64 |
21.85 |
21.77 |
21.96 |
22.07 |
22.12 |
22.36 |
Nondurable goods |
19.07 |
19.37 |
19.04 |
19.03 |
19.26 |
19.06 |
19.14 |
19.37 |
19.3 |
19.72 |
Private service-providing |
19.69 |
20.01 |
19.68 |
19.64 |
19.89 |
19.71 |
19.95 |
20.1 |
20.02 |
20.15 |
Trade, transportation, and utilities |
18.24 |
18.52 |
18.22 |
18.25 |
18.46 |
18.19 |
18.37 |
18.39 |
18.19 |
18.22 |
Wholesale trade |
22.83 |
23.33 |
22.9 |
22.91 |
23.52 |
23.14 |
23.5 |
23.55 |
23.52 |
23.88 |
Retail trade |
15.26 |
15.44 |
15.19 |
15.22 |
15.27 |
15.07 |
15.19 |
15.16 |
14.94 |
14.89 |
Transportation and warehousing |
19.1 |
19.42 |
19.18 |
19.31 |
19.49 |
19.24 |
19.22 |
19.25 |
19.14 |
19.25 |
Utilities |
29.26 |
29.74 |
29.17 |
28.9 |
29.26 |
28.88 |
29.15 |
29.61 |
29.47 |
29.36 |
Information |
26.69 |
27.22 |
26.98 |
26.9 |
27.18 |
27.05 |
27.45 |
27.54 |
27.31 |
27.48 |
Financial activities |
23.92 |
24.85 |
24.28 |
24.21 |
24.9 |
24.69 |
24.71 |
25.14 |
25.12 |
25.11 |
Professional and business services |
23.4 |
23.87 |
23.24 |
23.14 |
23.68 |
23.31 |
23.64 |
23.97 |
23.81 |
24.22 |
Education and health services |
19.9 |
19.99 |
19.91 |
20 |
20.16 |
20.14 |
20.19 |
20.18 |
20.23 |
20.33 |
Leisure and hospitality |
11.54 |
11.59 |
11.65 |
11.55 |
11.54 |
11.58 |
11.78 |
11.93 |
12.01 |
12.17 |
Other services |
17.2 |
17.33 |
17.25 |
17.14 |
17.13 |
17.13 |
17.32 |
17.36 |
17.35 |
17.49 |
| p=preliminary |
Table 1. Average hourly earnings of all employees on private nonfarm payrolls by industry sector and selected industry detail, not seasonally adjusted, 2007
| EXPERIMENTAL SERIES |
Industry |
Jan. 2007 |
Feb. 2007 |
Mar. 2007 |
Apr. 2007 |
May 2007 |
Jun. 2007 |
Jul. 2007 |
Aug. 2007 |
Sep. 2007 |
Oct. 2007 |
Nov. 2007 |
Dec. 2007 |
Total private |
20.64 |
20.73 |
20.82 |
21.05 |
20.83 |
20.82 |
20.99 |
20.85 |
21.18 |
21.07 |
21.13 |
21.37 |
Goods-producing |
21.86 |
21.9 |
21.9 |
22.1 |
22.01 |
22.03 |
22.17 |
22.11 |
22.28 |
22.19 |
22.33 |
22.61 |
Mining and logging |
24.93 |
25.18 |
25 |
25.18 |
24.71 |
24.88 |
24.88 |
24.6 |
24.65 |
24.78 |
24.82 |
25.34 |
Construction |
22.65 |
22.71 |
22.72 |
22.8 |
22.88 |
22.85 |
23 |
23.04 |
23.26 |
23.21 |
23.33 |
23.67 |
Manufacturing |
21.32 |
21.34 |
21.33 |
21.56 |
21.4 |
21.42 |
21.55 |
21.45 |
21.61 |
21.48 |
21.66 |
21.92 |
Durable goods |
22.28 |
22.34 |
22.34 |
22.54 |
22.41 |
22.43 |
22.53 |
22.49 |
22.67 |
22.52 |
22.67 |
22.97 |
Nondurable goods |
19.59 |
19.56 |
19.52 |
19.8 |
19.58 |
19.63 |
19.82 |
19.62 |
19.77 |
19.65 |
19.88 |
20.08 |
Private service-providing |
20.3 |
20.4 |
20.51 |
20.76 |
20.49 |
20.47 |
20.66 |
20.49 |
20.87 |
20.75 |
20.79 |
21.02 |
Trade, transportation, and utilities |
18.44 |
18.54 |
18.46 |
18.75 |
18.46 |
18.53 |
18.64 |
18.47 |
18.8 |
18.66 |
18.57 |
18.62 |
Wholesale trade |
23.74 |
23.75 |
23.63 |
24.13 |
23.73 |
23.84 |
24.08 |
23.87 |
24.25 |
24.03 |
24.13 |
24.32 |
Retail trade |
15.11 |
15.16 |
15.12 |
15.3 |
15.1 |
15.13 |
15.15 |
15.02 |
15.29 |
15.16 |
15.01 |
14.97 |
Transportation and warehousing |
19.47 |
19.58 |
19.5 |
19.68 |
19.42 |
19.64 |
19.83 |
19.66 |
19.9 |
19.83 |
19.86 |
20.07 |
Utilities |
29.36 |
29.45 |
29.87 |
30.48 |
30.17 |
29.88 |
30.36 |
30.08 |
30.62 |
30.76 |
30.71 |
31.41 |
Information |
27.91 |
27.93 |
27.88 |
28.34 |
28.07 |
27.8 |
28.08 |
27.94 |
28.34 |
28.29 |
28.12 |
28.32 |
Financial activities |
25.03 |
25.3 |
25.28 |
25.77 |
25.5 |
25.47 |
25.78 |
25.59 |
26.01 |
25.7 |
25.83 |
26.14 |
Professional and business services |
24.42 |
24.56 |
24.45 |
24.84 |
24.46 |
24.45 |
24.85 |
24.44 |
24.91 |
24.65 |
24.8 |
25.33 |
Education and health services |
20.35 |
20.36 |
21.28 |
21.32 |
21.23 |
21.3 |
21.43 |
21.4 |
21.61 |
21.6 |
21.69 |
21.81 |
Leisure and hospitality |
12.21 |
12.3 |
12.24 |
12.3 |
12.35 |
12.27 |
12.29 |
12.28 |
12.46 |
12.53 |
12.62 |
12.9 |
Other services |
17.51 |
17.5 |
17.48 |
17.66 |
17.5 |
17.51 |
17.59 |
17.59 |
17.78 |
17.7 |
17.72 |
17.9 |
| p=preliminary |
Table 1. Average hourly earnings of all employees on private nonfarm payrolls by industry sector and selected industry detail, not seasonally adjusted, 2008
| EXPERIMENTAL SERIES |
Industry |
Jan. 2008 |
Feb. 2008 |
Mar. 2008 |
Apr. 2008 |
May 2008 |
Jun. 2008 |
Jul. 2008 |
Aug. 2008 |
Sep. 2008 |
Oct. 2008 |
Nov. 2008 |
Dec. 2008 |
Total private |
21.35 |
21.43 |
21.58 |
21.49 |
21.46 |
21.53 |
21.49 |
21.54 |
21.74 |
21.78 |
22.03 |
22.02 |
Goods-producing |
22.5 |
22.53 |
22.7 |
22.64 |
22.7 |
22.76 |
22.85 |
22.92 |
23.04 |
23.16 |
23.4 |
23.58 |
Mining and logging |
25.73 |
25.16 |
26.57 |
25.28 |
25.12 |
25.59 |
26.4 |
26.65 |
26.37 |
26.35 |
27.38 |
27.5 |
Construction |
23.48 |
23.57 |
23.6 |
23.6 |
23.72 |
23.69 |
23.87 |
24.11 |
24.26 |
24.32 |
24.45 |
24.78 |
Manufacturing |
21.83 |
21.88 |
22.02 |
21.99 |
22.02 |
22.1 |
22.07 |
22.05 |
22.19 |
22.33 |
22.6 |
22.73 |
Durable goods |
22.83 |
22.94 |
23.09 |
23.09 |
23.11 |
23.21 |
23.19 |
23.18 |
23.35 |
23.54 |
23.84 |
23.98 |
Nondurable goods |
20.07 |
20 |
20.14 |
20.05 |
20.09 |
20.15 |
20.14 |
20.08 |
20.2 |
20.24 |
20.47 |
20.59 |
Private service-providing |
21.04 |
21.13 |
21.28 |
21.18 |
21.12 |
21.19 |
21.12 |
21.16 |
21.38 |
21.4 |
21.67 |
21.62 |
Trade, transportation, and utilities |
18.76 |
18.87 |
18.9 |
18.92 |
18.88 |
18.99 |
18.92 |
18.92 |
19.05 |
18.95 |
19.07 |
18.91 |
Wholesale trade |
24.21 |
24.23 |
24.37 |
24.22 |
24.11 |
24.29 |
24.32 |
24.43 |
24.4 |
24.36 |
24.79 |
24.8 |
Retail trade |
15.1 |
15.2 |
15.2 |
15.28 |
15.27 |
15.27 |
15.2 |
15.21 |
15.37 |
15.21 |
15.23 |
15.05 |
Transportation and warehousing |
20.08 |
20.1 |
20.15 |
20.2 |
20.21 |
20.43 |
20.5 |
20.31 |
20.37 |
20.33 |
20.35 |
20.25 |
Utilities |
31.48 |
32.19 |
31.86 |
31.57 |
31.81 |
32.62 |
31.95 |
32.28 |
32.58 |
32.52 |
32.91 |
32.96 |
Information |
28.33 |
28.31 |
28.85 |
28.57 |
28.48 |
28.65 |
28.67 |
28.7 |
28.85 |
28.81 |
28.88 |
28.7 |
Financial activities |
25.85 |
26.04 |
26.24 |
26.11 |
26.12 |
26.21 |
26.04 |
26.08 |
26.19 |
26.19 |
26.41 |
26.19 |
Professional and business services |
25.33 |
25.48 |
25.72 |
25.46 |
25.47 |
25.73 |
25.6 |
25.67 |
25.91 |
26.07 |
26.75 |
26.76 |
Education and health services |
21.8 |
21.81 |
22.02 |
22.01 |
21.97 |
21.99 |
22.14 |
22.15 |
22.35 |
22.33 |
22.46 |
22.59 |
Leisure and hospitality |
12.77 |
12.85 |
12.8 |
12.78 |
12.77 |
12.65 |
12.56 |
12.61 |
12.79 |
12.8 |
12.88 |
13 |
Other services |
17.83 |
17.89 |
18.18 |
18.14 |
18.11 |
18.18 |
18.12 |
18.14 |
18.28 |
18.28 |
18.44 |
18.48 |
| p=preliminary |
Table 1. Average hourly earnings of all employees on private nonfarm payrolls by industry sector and selected industry detail, not seasonally adjusted, 2009
| EXPERIMENTAL SERIES |
Industry |
Jan. 2009 |
Feb. 2009p |
Total private |
22.11 |
22.29 |
Goods-producing |
23.6 |
23.7 |
Mining and logging |
27.48 |
27.67 |
Construction |
24.66 |
24.65 |
Manufacturing |
22.84 |
22.99 |
Durable goods |
24.1 |
24.35 |
Nondurable goods |
20.71 |
20.73 |
Private service-providing |
21.74 |
21.95 |
Trade, transportation, and utilities |
19.21 |
19.39 |
Wholesale trade |
25 |
25.32 |
Retail trade |
15.32 |
15.42 |
Transportation and warehousing |
20.35 |
20.44 |
Utilities |
32.83 |
33.08 |
Information |
28.73 |
29.24 |
Financial activities |
26.08 |
26.42 |
Professional and business services |
26.92 |
27.4 |
Education and health services |
22.52 |
22.54 |
Leisure and hospitality |
12.97 |
12.98 |
Other services |
18.59 |
18.64 |
| p=preliminary |
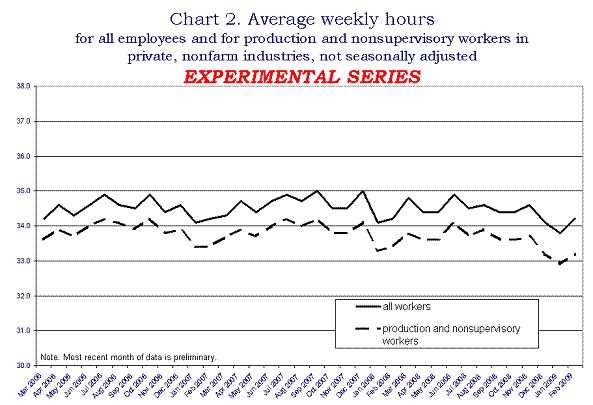
Table 2. Average weekly hours of all employees on private nonfarm payrolls by major industry sector and selected industry detail, not seasonally adjusted, 2006
| EXPERIMENTAL SERIES |
Industry |
Mar. 2006 |
Apr. 2006 |
May 2006 |
Jun. 2006 |
Jul. 2006 |
Aug. 2006 |
Sep. 2006 |
Oct. 2006 |
Nov. 2006 |
Dec. 2006 |
Total private |
34.2 |
34.6 |
34.3 |
34.6 |
34.9 |
34.6 |
34.5 |
34.9 |
34.4 |
34.6 |
Goods-producing |
39 |
38.8 |
39.3 |
39.7 |
39.5 |
39.7 |
39.6 |
39.7 |
39.3 |
39.6 |
Mining and logging |
42.1 |
42.9 |
42.5 |
43.2 |
43.2 |
43.3 |
43.2 |
42.6 |
42.2 |
42.6 |
Construction |
37.2 |
37.3 |
37.8 |
38.4 |
38.3 |
38.7 |
38.1 |
38.6 |
37.8 |
38.2 |
Manufacturing |
39.7 |
39.4 |
39.9 |
40.2 |
39.9 |
40.1 |
40.2 |
40.2 |
40 |
40.3 |
Overtime hours |
3.3 |
2.9 |
3.4 |
3.5 |
3.3 |
3.5 |
3.4 |
3.3 |
3.3 |
3.5 |
Durable goods |
40.2 |
39.7 |
40.4 |
40.6 |
40.3 |
40.6 |
40.5 |
40.6 |
40.3 |
40.7 |
Overtime hours |
3.4 |
2.8 |
3.4 |
3.5 |
3.3 |
3.5 |
3.4 |
3.3 |
3.3 |
3.5 |
Nondurable goods |
39 |
38.8 |
39.1 |
39.4 |
39.3 |
39.3 |
39.6 |
39.5 |
39.4 |
39.5 |
Overtime hours |
3.2 |
3 |
3.4 |
3.5 |
3.4 |
3.4 |
3.5 |
3.4 |
3.5 |
3.4 |
Private service-providing |
33 |
33.6 |
33.1 |
33.4 |
33.8 |
33.4 |
33.3 |
33.7 |
33.3 |
33.4 |
Trade, transportation, and utilities |
33.6 |
34.4 |
34 |
34.3 |
34.8 |
34.4 |
34.4 |
34.7 |
34.3 |
34.7 |
Wholesale trade |
37.3 |
38 |
37.4 |
37.7 |
38.1 |
37.5 |
37.5 |
38.2 |
37.7 |
37.8 |
Retail trade |
30.8 |
31.6 |
31.3 |
31.6 |
32.2 |
31.9 |
31.7 |
31.9 |
31.6 |
32.2 |
Transportation and warehousing |
37.7 |
38.1 |
37.9 |
38.3 |
38.6 |
38.4 |
38.5 |
38.8 |
38.5 |
38.5 |
Utilities |
40.7 |
41.5 |
41.2 |
41.4 |
41.8 |
41.4 |
41.4 |
41.7 |
41.5 |
41.6 |
Information |
36 |
36.8 |
36 |
36.3 |
37.2 |
36.5 |
36.2 |
36.7 |
35.9 |
36 |
Financial activities |
36.5 |
37.5 |
36.3 |
36.5 |
37.3 |
36.3 |
36.3 |
37.3 |
36.2 |
36.4 |
Professional and business services |
34.9 |
35.4 |
35 |
35.5 |
35.5 |
35.1 |
35.2 |
35.8 |
35.3 |
35.3 |
Education and health services |
33.2 |
33.5 |
33.2 |
33.3 |
33.6 |
33.3 |
33.4 |
33.6 |
33.4 |
33.4 |
Leisure and hospitality |
25.9 |
26.4 |
26.1 |
26.5 |
27.2 |
26.8 |
26 |
26.5 |
25.9 |
26 |
Other services |
33 |
33.3 |
32.9 |
33.1 |
33.3 |
33.2 |
32.9 |
33.1 |
32.8 |
32.9 |
| p=preliminary |
Table 2. Average weekly hours of all employees on private nonfarm payrolls by major industry sector and selected industry detail, not seasonally adjusted, 2007
| EXPERIMENTAL SERIES |
Industry |
Jan. 2007 |
Feb. 2007 |
Mar. 2007 |
Apr. 2007 |
May 2007 |
Jun. 2007 |
Jul. 2007 |
Aug. 2007 |
Sep. 2007 |
Oct. 2007 |
Nov. 2007 |
Dec. 2007 |
Total private |
34.1 |
34.2 |
34.3 |
34.7 |
34.4 |
34.7 |
34.9 |
34.7 |
35 |
34.5 |
34.5 |
35 |
Goods-producing |
38.8 |
38.6 |
39.2 |
39.3 |
39.5 |
39.8 |
39.6 |
39.8 |
40 |
39.7 |
39.6 |
39.8 |
Mining and logging |
41.8 |
42.3 |
42.7 |
45 |
44.1 |
44.4 |
44.3 |
44.4 |
45.4 |
44.5 |
44.2 |
44.1 |
Construction |
37 |
36.5 |
37.6 |
37.5 |
38.3 |
38.6 |
38.5 |
38.6 |
38.6 |
38.7 |
38.3 |
37.9 |
Manufacturing |
39.6 |
39.4 |
39.9 |
40 |
40 |
40.2 |
40 |
40.2 |
40.5 |
40 |
40.2 |
40.6 |
Overtime hours |
3 |
3 |
3.2 |
3.1 |
3.2 |
3.5 |
3.2 |
3.4 |
3.5 |
3.4 |
3.4 |
3.5 |
Durable goods |
39.9 |
39.7 |
40.2 |
40.3 |
40.3 |
40.6 |
40.2 |
40.5 |
40.7 |
40.3 |
40.4 |
40.8 |
Overtime hours |
3 |
3 |
3.2 |
3.1 |
3.2 |
3.5 |
3.2 |
3.5 |
3.4 |
3.4 |
3.4 |
3.5 |
Nondurable goods |
39 |
39 |
39.3 |
39.4 |
39.3 |
39.5 |
39.5 |
39.6 |
40 |
39.5 |
39.8 |
40.2 |
Overtime hours |
2.9 |
3 |
3.2 |
3.1 |
3.2 |
3.4 |
3.3 |
3.4 |
3.6 |
3.4 |
3.5 |
3.5 |
Private service-providing |
33 |
33.1 |
33.2 |
33.6 |
33.2 |
33.5 |
33.8 |
33.5 |
33.8 |
33.3 |
33.3 |
33.8 |
Trade, transportation, and utilities |
33.9 |
34 |
34.2 |
34.5 |
34.4 |
34.8 |
35 |
34.8 |
35.1 |
34.4 |
34.4 |
35.1 |
Wholesale trade |
37.3 |
37.6 |
37.7 |
38.4 |
38 |
38.1 |
38.5 |
38 |
38.6 |
38 |
38.1 |
38.9 |
Retail trade |
31.2 |
31 |
31.3 |
31.6 |
31.6 |
32 |
32.3 |
32.1 |
32.2 |
31.6 |
31.6 |
32.2 |
Transportation and warehousing |
37.8 |
38 |
38.1 |
38.2 |
38.3 |
38.7 |
38.8 |
38.7 |
39 |
38.3 |
38.6 |
39.2 |
Utilities |
41.1 |
41.7 |
41.4 |
42 |
42 |
42 |
41.8 |
41.8 |
42.4 |
41.4 |
41.6 |
42.1 |
Information |
35.8 |
35.9 |
35.8 |
36.5 |
35.4 |
35.8 |
37 |
36.1 |
36.7 |
35.8 |
36 |
36.6 |
Financial activities |
36.4 |
36.4 |
36.3 |
37.1 |
36 |
36.4 |
37.2 |
36.3 |
37 |
36.2 |
36.1 |
37.3 |
Professional and business services |
34.7 |
35.2 |
35.2 |
35.9 |
35.3 |
35.5 |
35.7 |
35.4 |
35.9 |
35.3 |
35.3 |
35.8 |
Education and health services |
33.3 |
33.3 |
33.3 |
33.7 |
33.4 |
33.4 |
33.7 |
33.5 |
33.8 |
33.5 |
33.6 |
33.9 |
Leisure and hospitality |
25.5 |
25.7 |
25.9 |
26.3 |
26 |
26.4 |
26.9 |
26.6 |
26.2 |
25.9 |
25.7 |
26 |
Other services |
32.7 |
32.7 |
32.7 |
32.8 |
32.7 |
32.8 |
33 |
32.9 |
33.2 |
32.8 |
32.8 |
33.1 |
| p=preliminary |
Table 2. Average weekly hours of all employees on private nonfarm payrolls by major industry sector and selected industry detail, not seasonally adjusted, 2008
| EXPERIMENTAL SERIES |
Industry |
Jan. 2008 |
Feb. 2008 |
Mar. 2008 |
Apr. 2008 |
May 2008 |
Jun. 2008 |
Jul. 2008 |
Aug. 2008 |
Sep. 2008 |
Oct. 2008 |
Nov. 2008 |
Dec. 2008 |
Total private |
34.1 |
34.2 |
34.8 |
34.4 |
34.4 |
34.9 |
34.5 |
34.6 |
34.4 |
34.4 |
34.6 |
34.1 |
Goods-producing |
39 |
38.9 |
39.5 |
39.3 |
39.3 |
39.8 |
39.3 |
39.7 |
39.4 |
39.4 |
39.1 |
38.7 |
Mining and logging |
43 |
43 |
44.2 |
43.5 |
43.4 |
44 |
43.4 |
44 |
43.6 |
44.2 |
44.7 |
43.1 |
Construction |
37.3 |
37.1 |
37.8 |
37.7 |
37.8 |
38.5 |
38.3 |
38.6 |
38 |
38.1 |
37.4 |
36.9 |
Manufacturing |
39.6 |
39.6 |
40.2 |
39.9 |
39.8 |
40.3 |
39.6 |
40 |
39.9 |
39.8 |
39.7 |
39.4 |
Overtime hours |
3.1 |
3 |
3.1 |
3.1 |
3 |
3.1 |
2.9 |
3.2 |
3.1 |
2.9 |
2.7 |
2.5 |
Durable goods |
40 |
39.9 |
40.5 |
40.2 |
40.1 |
40.6 |
39.8 |
40.4 |
40.1 |
40.1 |
39.9 |
39.7 |
Overtime hours |
3.1 |
3.1 |
3.1 |
3.1 |
3 |
3.1 |
2.9 |
3.1 |
3 |
2.8 |
2.5 |
2.5 |
Nondurable goods |
39.1 |
39.1 |
39.7 |
39.3 |
39.3 |
39.7 |
39.3 |
39.4 |
39.6 |
39.4 |
39.4 |
38.9 |
Overtime hours |
3.1 |
3 |
3.1 |
3.1 |
3.1 |
3.2 |
3 |
3.2 |
3.3 |
3.1 |
3 |
2.7 |
Private service-providing |
33 |
33.2 |
33.7 |
33.3 |
33.2 |
33.8 |
33.4 |
33.5 |
33.2 |
33.3 |
33.6 |
33.1 |
Trade, transportation, and utilities |
34.1 |
34.1 |
34.7 |
34.3 |
34.4 |
35 |
34.6 |
34.7 |
34.5 |
34.3 |
34.4 |
34.2 |
Wholesale trade |
38 |
38.1 |
38.8 |
38.3 |
38.3 |
39 |
38.4 |
38.5 |
38.2 |
38.3 |
38.9 |
38.1 |
Retail trade |
31.1 |
31.1 |
31.6 |
31.3 |
31.4 |
32 |
31.7 |
31.8 |
31.5 |
31.2 |
31.2 |
31.1 |
Transportation and warehousing |
38 |
38.1 |
38.6 |
38.2 |
38.3 |
39.2 |
38.5 |
38.7 |
38.7 |
38.4 |
38.7 |
38.6 |
Utilities |
42.4 |
42.2 |
42.5 |
42.4 |
42 |
42.5 |
41.7 |
41.2 |
41.9 |
41.5 |
41.8 |
41.5 |
Information |
36.3 |
36.3 |
37 |
36.3 |
36 |
36.9 |
36.5 |
36.6 |
36.5 |
36.5 |
37.1 |
36.4 |
Financial activities |
36.3 |
36.4 |
37.1 |
36.3 |
36.3 |
37.2 |
36.2 |
36.4 |
36.1 |
36.2 |
37.2 |
36.2 |
Professional and business services |
34.7 |
34.9 |
35.6 |
35.2 |
35.1 |
35.9 |
35.1 |
35.3 |
35 |
35.3 |
35.7 |
34.8 |
Education and health services |
33.5 |
33.6 |
33.9 |
33.6 |
33.6 |
33.8 |
33.7 |
33.7 |
33.7 |
33.6 |
34 |
33.6 |
Leisure and hospitality |
25.3 |
25.6 |
26 |
25.8 |
25.9 |
26.5 |
26.3 |
26.4 |
25.6 |
25.8 |
25.8 |
25.2 |
Other services |
32.6 |
32.7 |
33 |
32.7 |
32.7 |
33.1 |
32.8 |
33.1 |
32.8 |
32.8 |
33.1 |
32.6 |
| p=preliminary |
Table 2. Average weekly hours of all employees on private nonfarm payrolls by major industry sector and selected industry detail, not seasonally adjusted, 2009
| EXPERIMENTAL SERIES |
Industry |
Jan. 2009 |
Feb. 2009p |
Total private |
33.8 |
34.2 |
Goods-producing |
38.1 |
38.1 |
Mining and logging |
42.8 |
42.1 |
Construction |
36.6 |
36.6 |
Manufacturing |
38.6 |
38.6 |
Overtime hours |
2.2 |
2 |
Durable goods |
38.8 |
38.7 |
Overtime hours |
2 |
1.9 |
Nondurable goods |
38.3 |
38.3 |
Overtime hours |
2.4 |
2.3 |
Private service-providing |
32.9 |
33.4 |
Trade, transportation, and utilities |
33.9 |
34.2 |
Wholesale trade |
38.1 |
38.6 |
Retail trade |
30.8 |
31.1 |
Transportation and warehousing |
37.9 |
37.9 |
Utilities |
41.5 |
42 |
Information |
36.2 |
37 |
Financial activities |
36.5 |
37.3 |
Professional and business services |
34.7 |
35.4 |
Education and health services |
33.5 |
33.8 |
Leisure and hospitality |
24.9 |
25.7 |
Other services |
32.6 |
32.8 |
| p=preliminary |
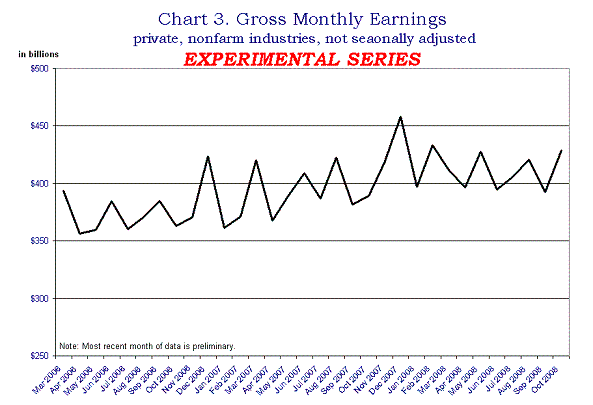
Table 3. Gross monthly earnings of all employees on private nonfarm payrolls by industry sector and selected industry detail, not seasonally adjusted, in billions, 2006
| EXPERIMENTAL SERIES |
Industry |
Mar. 2006 |
Apr. 2006 |
May 2006 |
Jun. 2006 |
Jul. 2006 |
Aug. 2006 |
Sep. 2006 |
Oct. 2006 |
Nov. 2006 |
Dec. 2006 |
Total private |
393.7 |
356.1 |
359.7 |
384.3 |
360.4 |
370.8 |
384.9 |
362.9 |
370.3 |
423.6 |
Goods-producing |
93.1 |
81.4 |
83.8 |
91.5 |
84.3 |
88.3 |
89.5 |
84.2 |
85.6 |
96.1 |
Mining and logging |
3.9 |
3.2 |
3.3 |
3.4 |
3.4 |
3.4 |
3.5 |
3.4 |
3.4 |
3.8 |
Construction |
30.1 |
26.8 |
28.7 |
31.8 |
29.4 |
31.8 |
32.2 |
30.2 |
29.6 |
32.9 |
Manufacturing |
59.1 |
51.4 |
51.9 |
56.2 |
51.4 |
53.1 |
53.9 |
50.6 |
52.7 |
59.3 |
Durable goods |
40.2 |
35.2 |
35.5 |
38.1 |
34.9 |
35.9 |
36 |
34.2 |
35.8 |
39.9 |
Nondurable goods |
18.9 |
16.2 |
16.4 |
18.1 |
16.5 |
17.3 |
17.8 |
16.4 |
16.9 |
19.4 |
Private service-providing |
300.6 |
274.6 |
275.8 |
292.9 |
276.2 |
282.5 |
295.3 |
278.7 |
284.7 |
327.5 |
Trade, transportation, and utilities |
89.7 |
80.6 |
80.2 |
85.7 |
79.7 |
80.4 |
84.4 |
78.3 |
81 |
92.7 |
Wholesale trade |
34.9 |
31.1 |
30.5 |
31.8 |
29.7 |
29.7 |
30.6 |
28.5 |
29.4 |
34.2 |
Retail trade |
33.6 |
31.7 |
31.4 |
33.8 |
31.9 |
32.3 |
34.5 |
31.5 |
32.9 |
37.9 |
Transportation and warehousing |
16 |
14.4 |
14.8 |
16.4 |
14.9 |
15.1 |
15.8 |
15 |
15.3 |
16.8 |
Utilities |
5.1 |
3.4 |
3.5 |
3.7 |
3.3 |
3.3 |
3.5 |
3.3 |
3.4 |
3.8 |
Information |
14.3 |
12.3 |
12.3 |
13.1 |
12.5 |
12.8 |
13.5 |
12.5 |
12.9 |
14.1 |
Financial activities |
42.6 |
39.5 |
38.5 |
39.1 |
38.6 |
39.5 |
41.2 |
38.9 |
38.8 |
43 |
Professional and business services |
70.5 |
63.7 |
65.8 |
70.2 |
65.6 |
68.2 |
71.3 |
68.3 |
69.6 |
84.7 |
Education and health services |
52.5 |
49.4 |
48.9 |
52.5 |
48.9 |
50 |
53.2 |
50.4 |
52.1 |
59.9 |
Leisure and hospitality |
18.3 |
17.2 |
18.1 |
19.3 |
18.8 |
19.4 |
19.2 |
18.3 |
18 |
19.6 |
Other services |
12.8 |
11.9 |
12.1 |
12.9 |
12.1 |
12.3 |
12.6 |
12.1 |
12.4 |
13.5 |
Table 3. Gross monthly earnings of all employees on private nonfarm payrolls by industry sector and selected industry detail, not seasonally adjusted, in billions, 2007
| EXPERIMENTAL SERIES |
Industry |
Jan. 2007 |
Feb. 2007 |
Mar. 2007 |
Apr. 2007 |
May 2007 |
Jun. 2007 |
Jul. 2007 |
Aug. 2007 |
Sep. 2007 |
Oct. 2007 |
Nov. 2007 |
Dec. 2007 |
Total private |
361.2 |
371.2 |
420.4 |
367.8 |
389.8 |
409.1 |
387 |
422.7 |
381.6 |
389.2 |
417.8 |
457.9 |
Goods-producing |
80.9 |
82.3 |
94.8 |
82.6 |
88.1 |
92 |
85.2 |
96.9 |
85.1 |
86.6 |
93.6 |
98.4 |
Mining and logging |
3.2 |
4.1 |
4.5 |
4 |
4.1 |
4.1 |
4 |
4.6 |
4.2 |
4 |
4.2 |
4.4 |
Construction |
26.3 |
25.3 |
30.1 |
27.6 |
30.4 |
32.6 |
30.6 |
34.7 |
30.5 |
30.9 |
32 |
36.6 |
Manufacturing |
51.4 |
52.9 |
60.2 |
51 |
53.6 |
55.2 |
50.6 |
57.6 |
50.4 |
51.7 |
57.5 |
57.4 |
Durable goods |
34.8 |
35.4 |
40.4 |
34.4 |
36.3 |
36.8 |
33.4 |
38.1 |
33.2 |
34.4 |
38.3 |
38.1 |
Nondurable goods |
16.7 |
17.6 |
19.7 |
16.6 |
17.3 |
18.5 |
17.3 |
19.4 |
17.2 |
17.3 |
19.2 |
19.3 |
Private service-providing |
280.2 |
288.9 |
325.6 |
285.3 |
301.8 |
317.1 |
301.8 |
325.8 |
296.6 |
302.7 |
324.2 |
359.5 |
Trade, transportation, and utilities |
78.2 |
76.8 |
91.4 |
78.9 |
81.5 |
86.5 |
81.9 |
89.4 |
81.1 |
81.8 |
89.7 |
93 |
Wholesale trade |
28.4 |
28 |
32.3 |
28.1 |
28.8 |
29.9 |
30 |
32.1 |
28.6 |
28.8 |
31.3 |
33.7 |
Retail trade |
31.8 |
30.2 |
36.3 |
32.3 |
33.4 |
35.8 |
33 |
36.7 |
33.5 |
33.5 |
37.1 |
38.6 |
Transportation and warehousing |
14.5 |
15.2 |
17.5 |
15.3 |
16 |
17.6 |
15.8 |
17.2 |
16 |
16.5 |
17.7 |
17.4 |
Utilities |
3.5 |
3.4 |
5.2 |
3.3 |
3.3 |
3.2 |
3.1 |
3.3 |
3 |
3.1 |
3.7 |
3.3 |
Information |
12.9 |
13.6 |
14.5 |
12.3 |
12.7 |
13.9 |
13.1 |
14.2 |
12.4 |
12.8 |
13.8 |
13.7 |
Financial activities |
40.8 |
49.8 |
52.2 |
41.4 |
44.7 |
46.9 |
46.9 |
48.2 |
43.5 |
43.7 |
44.6 |
50.6 |
Professional and business services |
67.3 |
69 |
78.5 |
70.3 |
77.4 |
80.2 |
74.2 |
81.5 |
74.6 |
76 |
81.9 |
95.9 |
Education and health services |
50.7 |
50.1 |
56.1 |
51.4 |
52.6 |
55.3 |
51.7 |
56 |
52 |
53.8 |
58.7 |
61.9 |
Leisure and hospitality |
18.3 |
17.5 |
19.7 |
18.7 |
20.3 |
21.1 |
21 |
22.5 |
20.1 |
21.2 |
21.6 |
30.2 |
Other services |
12.1 |
12 |
13.1 |
12.2 |
12.6 |
13.2 |
13 |
14.1 |
13 |
13.3 |
13.9 |
14.3 |
Table 3. Gross monthly earnings of all employees on private nonfarm payrolls by industry sector and selected industry detail, not seasonally adjusted, in billions, 2008
| EXPERIMENTAL SERIES |
Industry |
Jan. 2008 |
Feb. 2008 |
Mar. 2008 |
Apr. 2008 |
May 2008 |
Jun. 2008 |
Jul. 2008 |
Aug. 2008 |
Sep. 2008 |
Oct. 2008 |
Total private |
397.2 |
433.4 |
412 |
396.3 |
427.6 |
394.9 |
405.9 |
420.9 |
392.8 |
428.7 |
Goods-producing |
84.7 |
89.7 |
86.2 |
87.7 |
93.8 |
86.6 |
90.7 |
93.3 |
85.7 |
96.2 |
Mining and logging |
3.7 |
6 |
4.9 |
5 |
4.9 |
4.9 |
5.1 |
5.1 |
4.5 |
4.8 |
Construction |
27.9 |
28.3 |
28.3 |
29 |
31.6 |
29.4 |
31.3 |
32.6 |
29.9 |
33.9 |
Manufacturing |
53.1 |
55.3 |
52.9 |
53.7 |
57.3 |
52.4 |
54.3 |
55.6 |
51.3 |
57.4 |
Durable goods |
35.2 |
36.8 |
35 |
36.8 |
38.5 |
35.4 |
36.6 |
37.3 |
33.8 |
37.7 |
Nondurable goods |
17.9 |
18.6 |
17.9 |
16.9 |
18.8 |
17 |
17.7 |
18.3 |
17.4 |
19.8 |
Private service-providing |
312.6 |
343.8 |
325.8 |
308.5 |
333.8 |
308.2 |
315.2 |
327.7 |
307.1 |
332.5 |
Trade, transportation, and utilities |
83.4 |
86.9 |
85.2 |
82 |
88.4 |
81.4 |
83.4 |
86.6 |
80.6 |
88.4 |
Wholesale trade |
29.9 |
30.8 |
30.4 |
28.6 |
30.4 |
28.6 |
29.1 |
29.4 |
27.5 |
30.6 |
Retail trade |
34.4 |
35.2 |
34.6 |
34.2 |
37.1 |
33.7 |
34.6 |
36.5 |
33.6 |
36.2 |
Transportation and warehousing |
15.5 |
16.4 |
15.8 |
15.9 |
17.3 |
15.7 |
16.1 |
16.8 |
15.7 |
17.7 |
Utilities |
3.5 |
4.5 |
4.5 |
3.2 |
3.6 |
3.4 |
3.6 |
3.9 |
3.7 |
3.9 |
Information |
13.7 |
14.8 |
13.6 |
13.5 |
14.2 |
13 |
13.6 |
14.6 |
12.9 |
14 |
Financial activities |
48.4 |
67.6 |
54.3 |
45 |
47.3 |
42.9 |
43.6 |
45.1 |
41.3 |
44.1 |
Professional and business services |
79.7 |
82.9 |
82.4 |
78.3 |
85.5 |
77.6 |
79.5 |
83.3 |
79.5 |
85.9 |
Education and health services |
53.3 |
56.4 |
56.1 |
55.2 |
61 |
54.6 |
57.6 |
59.5 |
56.6 |
63 |
Leisure and hospitality |
21 |
21.4 |
20.8 |
21.3 |
23.1 |
25.3 |
23.5 |
24.3 |
22.6 |
22.6 |
Other services |
13.1 |
13.8 |
13.3 |
13.3 |
14.3 |
13.5 |
14 |
14.3 |
13.6 |
14.5 |
| p=preliminary |
Last Modified Date: April 3, 2009

