Comparison of Phytoplankton Blooms in San Francisco Bay and Chesapeake Bay
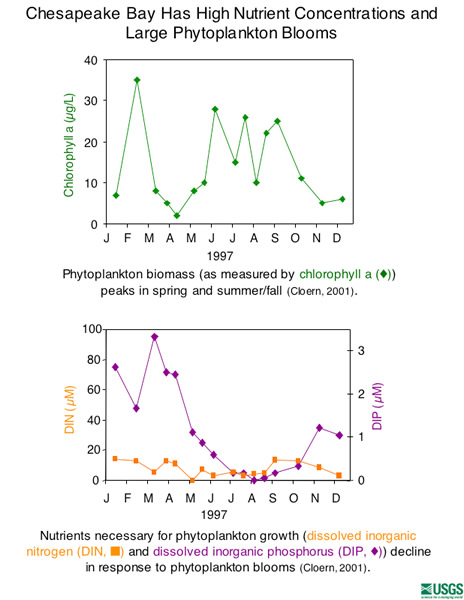


The figures on this page are modified versions of figure 6 from Cloern, 2001. They depict seasonal changes in selected water-quality constituents of the Chesapeake Bay and northern San Francisco Bay for the year 1997. Data are from the Chesapeake Bay Program Monitoring Station 3.3C and U.S. Geological Survey Station 9 in northern San Francisco Bay. Unit abbreviations: µg/L = micrograms per liter, µM = micromoles, mg/L = milligrams per liter
Reference
Cloern, J.E., 2001, Our evolving conceptual model of the coastal eutrophication problem: Marine Ecology Progress Series, v. 210, p. 223-253.
More Information
Back to Headlines Page
|

|

