| US Imports of Steel Mill Products | |||
| FOR Strip-Hot Rolled -- S |
|||
| Quantity in Metric Tons | |||
| Same Table - US Dollars |
Same Table - Average Unit Value |
||
| 'C & A' = Carbon and Alloy products, 'S' = Stainless products | |||
| Graph | Country | Census Data | Preliminary Census Data |
License Data | |||||||||||||
|---|---|---|---|---|---|---|---|---|---|---|---|---|---|---|---|---|---|
| FEB08 | MAR08 | APR08 | MAY08 | JUN08 | JUL08 | AUG08 | SEP08 | OCT08 | NOV08 | DEC08 | JAN09 | FEB09 | MAR09 | MAR09 | APR09 | ||
| M | WORLD | 161.8 | 393.8 | 155.6 | 160.0 | 206.1 | 64.8 | 89.6 | 147.6 | 10.6 | 22.1 | 7.12 | 14.0 | 6.91 | 26.5 | 90.8 | 20.4 |
| M | FINLAND | 59.3 | 248.9 | . | 112.4 | 62.5 | 49.1 | 66.8 | 88.4 | . | . | . | . | . | . | . | . |
| M | JAPAN | 21.5 | 13.4 | 32.4 | 7.65 | 18.6 | 13.1 | 13.1 | 6.44 | 2.24 | 7.04 | 2.24 | 10.3 | 2.24 | . | . | . |
| M | KOREA | 59.7 | 26.1 | 52.3 | . | . | . | . | . | . | . | . | . | . | . | . | . |
| M | SLOVENIA | . | 98.6 | 26.5 | . | . | . | . | . | . | . | . | . | . | 10.2 | 10.2 | . |
| M | SWEDEN | 0.38 | . | 23.9 | . | 95.6 | . | . | . | . | 2.65 | . | . | . | . | . | 16.7 |
| M | CHINA | 7.52 | . | . | . | 19.8 | . | 2.97 | 26.2 | . | . | . | . | . | 10.1 | 10.1 | 0.00 |
| M | ITALY | 11.1 | 1.13 | 20.1 | 2.41 | 6.72 | 2.49 | 0.97 | . | 4.67 | 7.86 | 3.96 | 0.41 | . | 3.00 | 1.98 | 2.60 |
| M | GERMANY | . | . | . | . | . | . | 3.85 | 26.5 | 3.21 | 4.60 | 0.10 | 2.77 | . | . | 67.6 | . |
| M | FRANCE | . | . | . | 37.5 | . | . | 1.89 | . | . | . | . | . | . | . | . | . |
| M | TAIWAN | 0.48 | 5.58 | 0.23 | . | . | . | . | . | . | . | . | 0.55 | . | . | . | . |
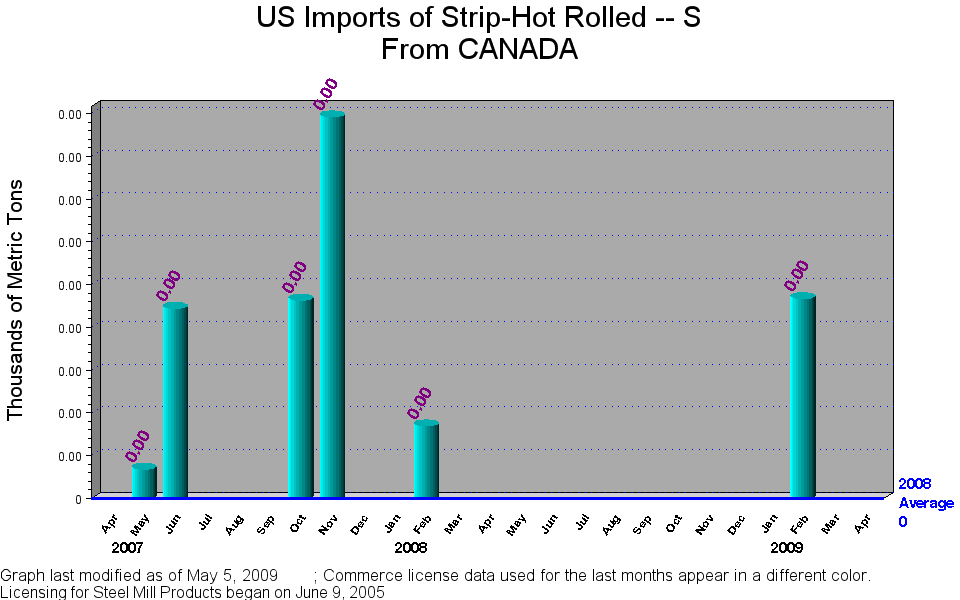
| M | CANADA | 1.69 | . | . | . | . | . | . | . | . | . | . | . | 4.67 | . | . | . |
| M | UNITED KINGDOM | . | . | . | . | 2.66 | . | . | . | 0.50 | . | . | . | . | . | . | . |
| M | PORTUGAL | . | . | . | . | . | . | . | . | . | . | . | . | . | 3.14 | . | . |
| M | SWITZERLAND | . | . | . | . | . | . | . | . | . | . | 0.81 | . | . | . | . | . |
| M | BELGIUM | . | . | . | . | . | . | . | . | . | . | . | . | . | . | 0.49 | . |
| M | MEXICO | . | . | . | . | . | . | . | . | . | . | . | . | . | . | 0.29 | 0.82 |
| M | UNITED STATES | . | . | . | . | . | . | . | . | . | . | . | . | . | . | . | 0.28 |
| SOURCE: US Department of Commerce, Import Administration |
| Table last modified on: May 5, 2009, with |
| Licensing data collected through May 5, 2009 and |
| Preliminary Census data compiled through March 2009 |
| Data listed in order of descending volume imported during last THREE months of Census data, including peliminary data |
| Steel mill categories are defined by 10-digit HTS codes |
| Data extracted from the import licenses are not official Census data |
| To see License Data at HTS 6-digit level click on chart title at the top of the page. |
| Link to Annual Summary of Census Data |
| Link to Summary Level of Monthly Census Data |