| US Imports of Steel Mill Products | |||
| FOR Sheets & Strip Galv Electrolyt -- C & A |
|||
| Quantity in Metric Tons | |||
| Same Table - US Dollars |
Same Table - Average Unit Value |
||
| 'C & A' = Carbon and Alloy products, 'S' = Stainless products | |||
| Graph | Country | Census Data | Preliminary Census Data |
License Data | |||||||||||||
|---|---|---|---|---|---|---|---|---|---|---|---|---|---|---|---|---|---|
| FEB08 | MAR08 | APR08 | MAY08 | JUN08 | JUL08 | AUG08 | SEP08 | OCT08 | NOV08 | DEC08 | JAN09 | FEB09 | MAR09 | MAR09 | APR09 | ||
| M | WORLD | 11,869 | 12,154 | 16,960 | 12,951 | 12,619 | 16,072 | 13,523 | 17,419 | 14,974 | 15,367 | 10,645 | 17,503 | 5,971 | 8,773 | 5,380 | 10,748 |
| M | GERMANY | 6,443 | 4,355 | 8,185 | 5,592 | 5,249 | 6,491 | 3,015 | 4,239 | 4,347 | 3,333 | 2,965 | 2,171 | 1,489 | 1,161 | 1,164 | 2,230 |
| M | JAPAN | 707.1 | 3,445 | 2,048 | 3,399 | 3,130 | 1,995 | 6,285 | 5,723 | 2,931 | 6,143 | 4,912 | 6,258 | 3,253 | 2,008 | 1,776 | 1,813 |
| M | KOREA | 1,696 | 1,644 | 2,404 | 1,313 | 1,109 | 2,181 | 1,638 | 1,536 | 1,918 | 2,526 | 1,381 | 5,429 | 431.5 | 1,200 | 1,298 | 620.1 |
| M | CANADA | 1,902 | 1,685 | 1,307 | 1,095 | 1,244 | 1,388 | 1,391 | 2,019 | 1,799 | 1,489 | 508.6 | 422.3 | 405.9 | 941.8 | 226.3 | 487.8 |
| M | TAIWAN | 234.9 | 255.3 | 1,689 | 254.0 | 740.6 | 2,173 | . | 1,571 | 535.1 | 479.3 | 45.0 | 706.5 | 70.8 | 3,212 | 18.4 | 209.9 |
| M | LUXEMBOURG | 84.8 | 468.6 | 902.0 | 1,201 | 577.1 | 1,686 | 303.4 | 815.2 | 1,110 | 338.2 | 13.4 | 1,163 | 10.9 | 57.2 | 57.0 | 167.1 |
| M | CHINA | 6.39 | 148.9 | 84.3 | 72.9 | 485.0 | 125.0 | 800.9 | 884.1 | 728.9 | 652.1 | 144.9 | 783.6 | 212.3 | 21.8 | 13.7 | 2,151 |
| M | SWEDEN | . | . | 187.2 | . | 52.7 | . | 35.7 | 346.7 | 57.3 | 326.2 | 254.1 | 529.6 | 20.3 | . | . | . |
| M | FRANCE | . | . | . | . | . | . | . | . | 1,418 | . | . | . | 43.2 | . | . | . |
| M | THAILAND | 229.1 | 104.4 | 93.4 | 17.6 | 16.2 | 15.1 | 20.5 | 146.9 | 49.9 | . | 341.5 | . | 33.4 | 169.1 | 103.7 | 124.6 |
| M | INDIA | 565.5 | . | . | . | . | . | . | . | . | . | . | . | . | . | . | . |
| M | MEXICO | . | . | . | . | . | . | 31.1 | 135.5 | 58.6 | 16.8 | 77.5 | 38.0 | . | . | . | . |
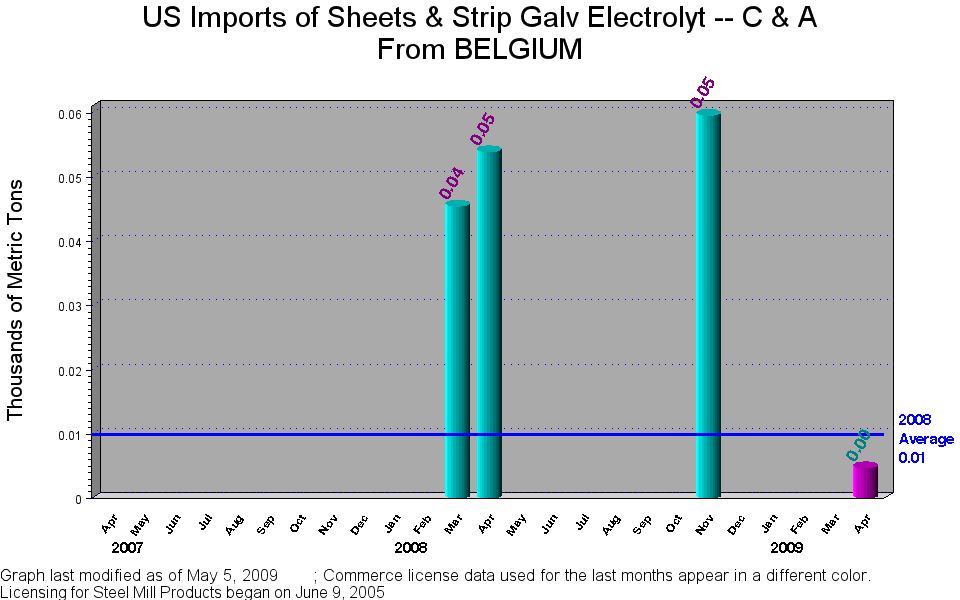
| M | BELGIUM | . | 45.5 | 54.0 | . | . | . | . | . | . | 59.6 | . | . | . | . | . | 4.73 |
| M | BRAZIL | . | . | . | . | . | 10.6 | . | . | 11.8 | . | . | . | . | . | . | 510.1 |
| M | SPAIN | . | . | . | 4.15 | 14.1 | . | . | . | . | 1.13 | . | . | . | . | . | . |
| M | UNITED KINGDOM | . | . | 4.37 | . | . | 5.10 | . | . | 5.49 | . | . | . | . | . | . | 2.52 |
| M | DENMARK | . | . | . | . | . | . | . | . | . | 0.43 | 0.42 | . | . | 0.50 | 0.00 | 0.02 |
| M | ARGENTINA | . | . | . | . | . | . | . | . | . | . | . | . | . | . | . | 1,956 |
| M | ITALY | . | . | . | . | . | . | . | . | . | . | . | . | . | . | . | 0.06 |
| M | UNITED STATES | . | . | . | . | . | . | . | . | . | . | . | . | . | . | 722.4 | 469.5 |
| SOURCE: US Department of Commerce, Import Administration |
| Table last modified on: May 5, 2009, with |
| Licensing data collected through May 5, 2009 and |
| Preliminary Census data compiled through March 2009 |
| Data listed in order of descending volume imported during last THREE months of Census data, including peliminary data |
| Steel mill categories are defined by 10-digit HTS codes |
| Data extracted from the import licenses are not official Census data |
| To see License Data at HTS 6-digit level click on chart title at the top of the page. |
| Link to Annual Summary of Census Data |
| Link to Summary Level of Monthly Census Data |