 |
||||||||||||||
| Home | Daily Log | All About the Research | Images and Video | Maps | Ask a Scientist | Interesting Links | ||||||||||||||

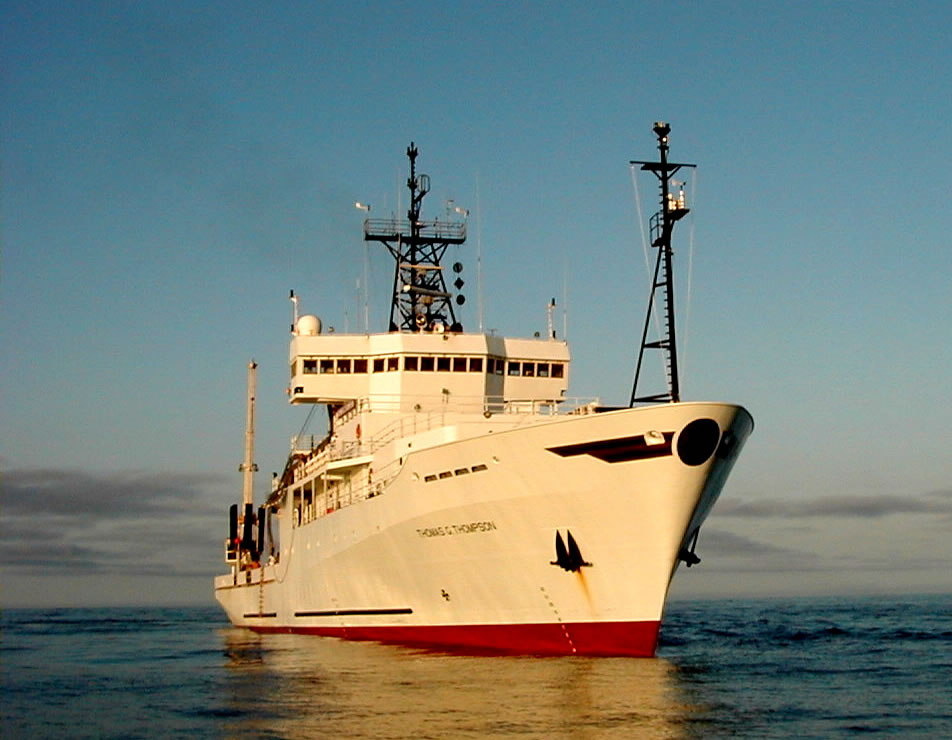
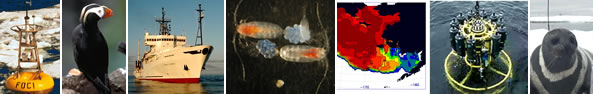
Bering Sea-Ice Expedition Home Page Photos |
||||||||||||||
|
|
||||||||||||||
| Privacy | Disclaimer | Accessibility | Contact Us |
|
|
||||||||||||||
| Home | Daily Log | All About the Research | Images and Video | Maps | Ask a Scientist | Interesting Links | ||||||||||||||
|
Bering Sea-Ice Expedition Home Page Photos |
||||||||||||||
|
|
||||||||||||||
| Privacy | Disclaimer | Accessibility | Contact Us |