
 Feeds & Data
Subduction Zone Geometry Analysis
Preliminary Result of the 2009/04/07 KURIL ISLANDS Earthquake
Gavin Hayes, NEIC
Introduction
A key step in many earthquake source inversions requires knowledge of the geometry of the fault on which the earthquake occurred. Our knowledge of this surface is often uncertain, however, and as a result fault geometry mislocation can map into significant error in the final temporal and spatial slip patterns of these inversions. Relying solely on an initial hypocenter and CMT mechanism can be risky when establishing rupture characteristics needed for rapid tsunami and ground shaking estimates. Here we attempt to improve the quality of fast finite-fault inversion results by combining several independent and complementary datasets to more accurately constrain the geometry of the seismic rupture plane of subducting slabs. Unlike previous analyses aimed at defining the general form of the plate interface, we require mechanisms and locations of the seismicity considered in our inversions to be consistent with their occurrence on the plate interface, by limiting events to those with well-constrained depths and with CMT solutions indicative of shallow-dip thrust faulting. We construct probability density functions about each location based on formal assumptions of their depth uncertainty and use these constraints to solve for the 'most likely' fault plane. In the case of large events (M > ~7.5), these planes can be used directly in new finite fault inversions. For smaller events, this method provides a quick analysis of the tectonic setting of an event and a 'most likely' depth assuming the earthquake occurred on the subduction interface, which can be used as a check against other depth estimates produced at the NEIC.
Data Filtering and Inversion
We filter the historic gCMT catalog to include only shallow thrust mechanisms within 250km of the main shock. We construct the reference profile by calculating the average strike of remaining CMTs deeper than the upper plate, projecting a line 250km downdip from the trench location nearest to the main shock. We remove events greater than 100km distance from the profile in a perpendicular direction. We retain the most accurate hypocenter of each event from a heirarcy of catalogs, first considering the EHB catalog (Engdahl et al., 1998), then the NEIC PDE, and finally the location in the gCMT catalog if neither of these exist. Next we construct probability density functions about the reported depth of the event in the chosen catalog, whose variance reflects the vertical uncertainty of the location. Finally, we calculate the Most Likely Interface Geometry following a maximum likelihood approach, fitting a planar interface through the trench location and the PDFs. The solution corresponds to the maximum probability over a range of dips from 0-60 degrees.
Most Likely Geometry: Strike = 223.93, Dip = 11.0
Most Likely Depth if on Planar Slab Interface = 34.48 km
Most Likely Depth if on Polynomial Slab Interface = 38.63 km
Result
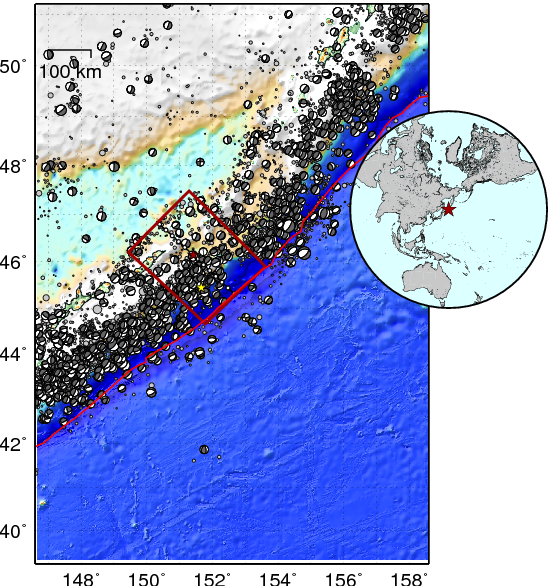
Figure 1: Basemap of subduction zone showing the area of the trench constrained in this example. Earthquake locations from the gCMT catalog and EHB catalog (gray circles, sized according to magnitude) are shown. Maroon rectangle indicates the area shown in cross section (c); all earthquakes within this area may be used to constrain trench geometry.

Figure 2: Cross-section of subduction zone taken perpendicular to the average strike of gCMTs that match selection criteria and whose equivalent EHB or NEIC locations lie within the maroon box from Figure 1. Gold CMTs are mechanisms from the gCMT catalog plotted at their equivalent EHB catalog location, used to constrain trench strike and dip. Orange CMTs are mechanisms without EHB locations, placed instead at the equivalent event location in the NEIC catalog, and also used to constrain geometry. Light and dark gray circles are events from the EHB catalog south and north of the plane of the cross-section, respectively, but not used to constrain geometry because either (i) they did not have a corresponding mechanism in the gCMT catalog, or (ii) their mechanism in the gCMT catalog did not match selection criteria. The trench location is marked with a red square. Probability density functions for EHB and NEIC locations are shown as green lines, scaled by a factor of x20 for display purposes. The black solid line labeled 'most likely plane' describes the best fitting geometry. The initial locations of the 'new event' used to help constrain geometry are shown by black circles and marked with arrows corresponding to the gCMT epicentroid and NEIC epicenter. PDFs for these locations are shown in red; the most likely depth for each location is marked with a white star, at the intersection of the most likely subduction interface plane and the epicentroid/center location, assuming that the event represents rupture on the main subduction thrust. The best-fitting fault plane from the gCMT catalog for the new event is shown with a black dashed line and labeled 'CMT solution'. The red dashed line is the most likely interface following a polymonial SVD fit to the data, rather than planar.
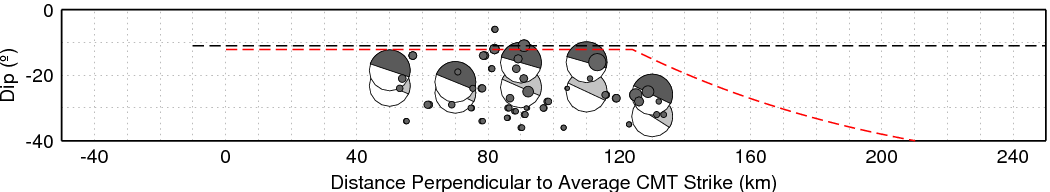
Figure 3: Variation in dip of best-fitting fault planes from the gCMT catalog for all events used to constrain trench geometry across the plane of the cross-section. Individual event dips are shown with small dark gray circles, sized with magnitude. Large mechanisms indicate the average dip in 20km bins across the plane of the cross-section. Light gray mechanisms represent a bulk average; dark gray represents a moment-weighted average.
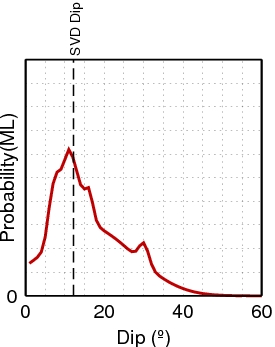
Figure 4: Maximum Likelihood probability function describing interface dip probability over a range of dips from 0-60 degrees. Vertical black dashed line indicates the planar solution with an SVD inversion.

Figure 5: Least Squares R-squared correlation and RMS misfit functions describing interface dip likelihood over a range of dips from 0-60 degrees.
Gavin's Comments:
Not Available YetSummary Poster
| PDF FORMAT |
References
Hayes, G.P., and Wald, D.J., Developing framework to constrain the geometry of the seismic rupture plane in subduction zones a priori - a probabilistic approach, submitted to Geophys. J. Int., 2008
Acknowledgement and Contact Information
This work is supported by National Earthquake Information Center (NEIC) of United States Geological Survey. This web page is built and maintained by Dr. G. Hayes at NEIC.
