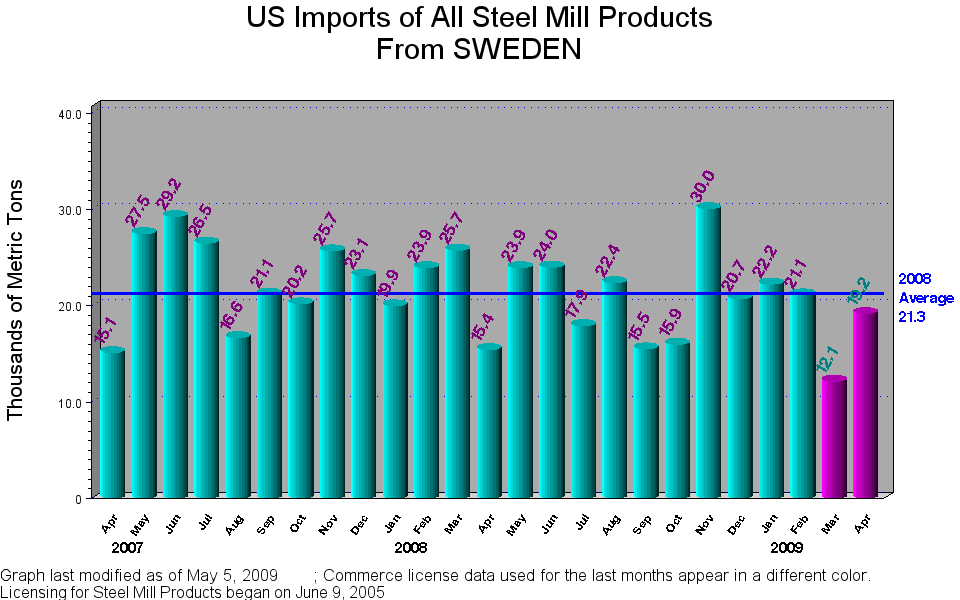
| All Steel Mill Products |
| M |
All Steel Mill Products |
23,970 |
25,770 |
15,463 |
23,975 |
24,003 |
17,938 |
22,401 |
15,531 |
15,992 |
30,097 |
20,756 |
22,270 |
21,136 |
11,913 |
12,158 |
19,209 |
| Carbon and Alloy Products |
| M |
All Carbon and Alloy Products |
18,253 |
19,956 |
9,552 |
17,604 |
18,729 |
11,795 |
17,654 |
10,523 |
9,281 |
25,276 |
17,128 |
18,769 |
17,275 |
8,805 |
8,720 |
15,530 |
| M |
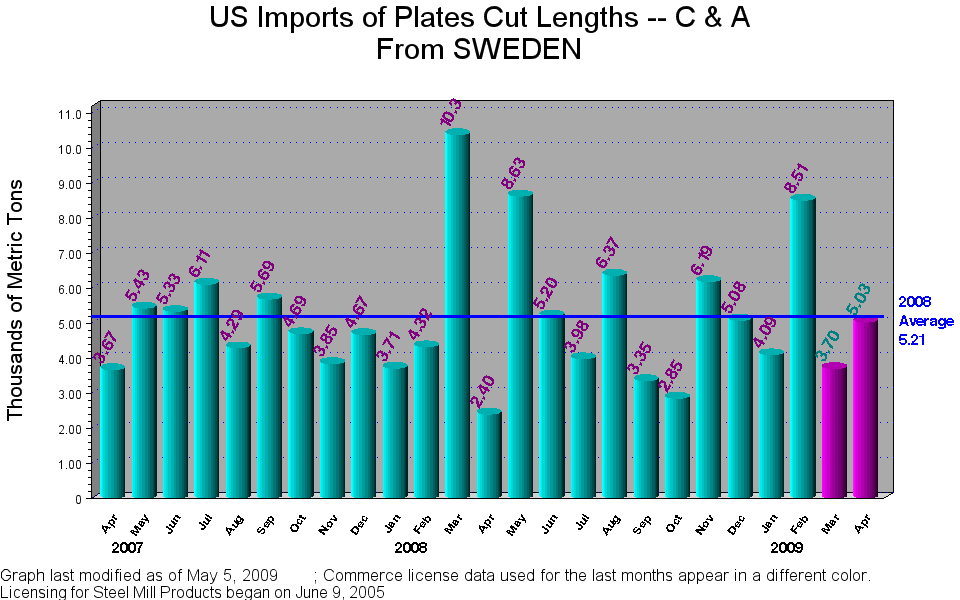
Plates Cut Lengths -- C & A |
4,326 |
10,391 |
2,407 |
8,639 |
5,208 |
3,985 |
6,371 |
3,359 |
2,854 |
6,192 |
5,089 |
4,099 |
8,513 |
3,745 |
3,707 |
5,038 |
| M |
Sheets Hot Rolled -- C & A |
2,439 |
3,017 |
2,489 |
2,884 |
5,359 |
2,248 |
4,078 |
3,333 |
1,116 |
8,668 |
4,509 |
4,589 |
3,092 |
3,498 |
3,508 |
4,558 |
| M |
Sheets Cold Rolled -- C & A |
7,916 |
2,368 |
661.8 |
1,937 |
4,327 |
2,188 |
3,805 |
637.1 |
1,368 |
6,282 |
4,201 |
6,082 |
2,569 |
91.2 |
81.7 |
680.3 |
| M |
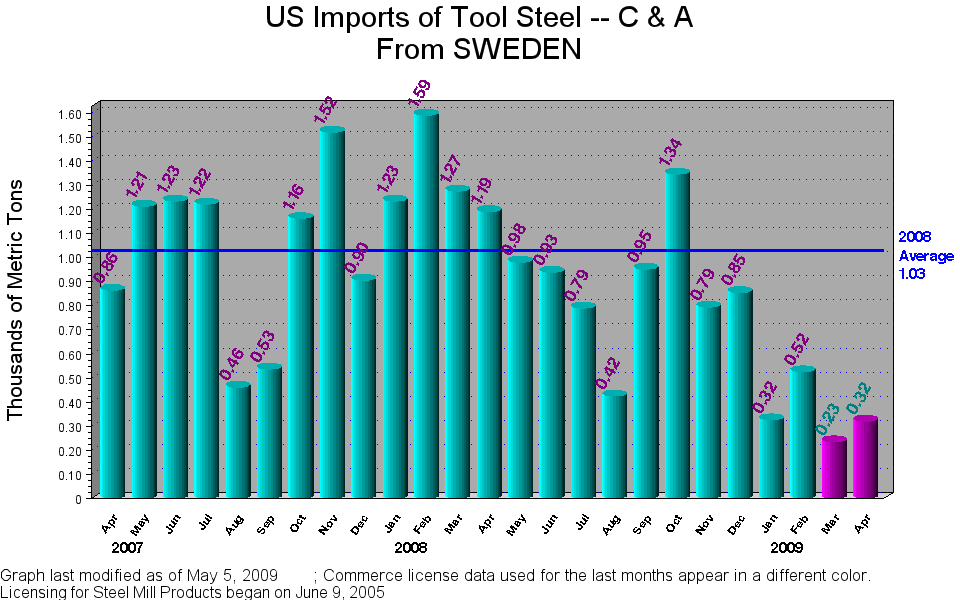
Tool Steel -- C & A |
1,592 |
1,277 |
1,191 |
981.4 |
939.1 |
790.7 |
425.4 |
953.3 |
1,348 |
795.1 |
855.4 |
325.8 |
525.2 |
235.3 |
234.5 |
320.4 |
| M |
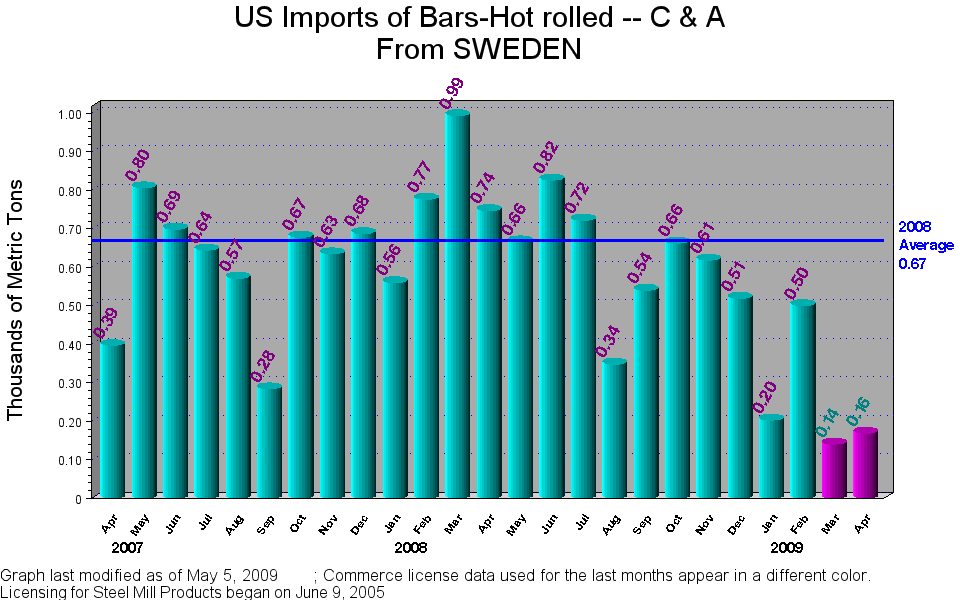
Bars-Hot rolled -- C & A |
776.6 |
993.9 |
747.5 |
666.1 |
827.0 |
722.3 |
348.5 |
540.1 |
663.1 |
618.9 |
519.4 |
203.2 |
500.5 |
173.4 |
141.0 |
169.1 |
| M |
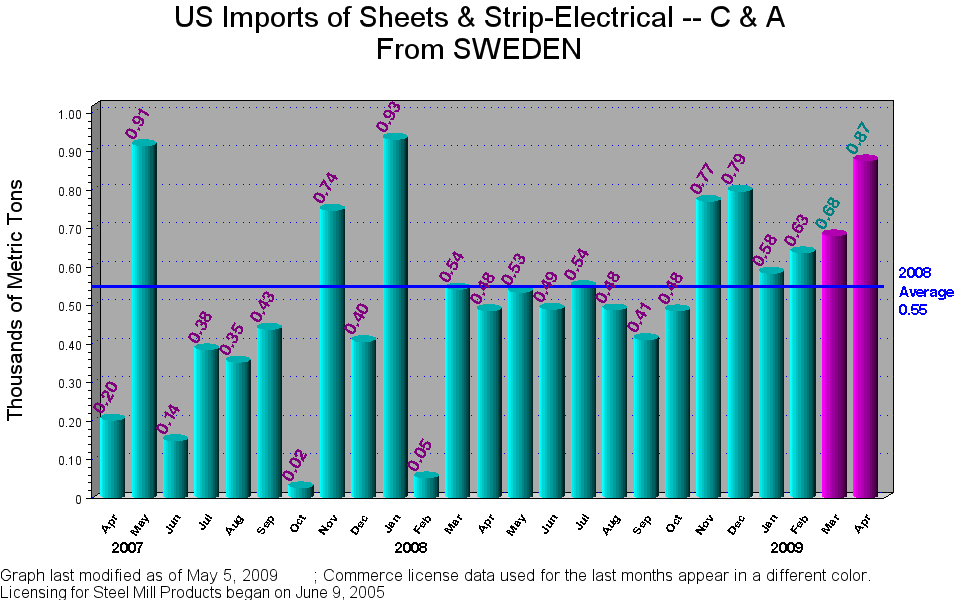
Sheets & Strip-Electrical -- C & A |
53.1 |
543.1 |
487.5 |
535.6 |
490.7 |
549.9 |
489.3 |
412.4 |
487.1 |
771.3 |
797.4 |
584.8 |
637.9 |
761.2 |
681.9 |
876.6 |
| M |
Plates in Coils -- C & A |
. |
9.54 |
38.5 |
610.2 |
371.6 |
. |
1,409 |
86.4 |
. |
760.5 |
. |
1,485 |
710.4 |
. |
. |
3,545 |
| M |
Mechanical Tubing -- C & A |
504.0 |
711.4 |
458.9 |
502.3 |
354.7 |
322.0 |
273.9 |
460.9 |
408.9 |
172.6 |
417.4 |
308.6 |
322.7 |
68.3 |
129.1 |
179.0 |
| M |
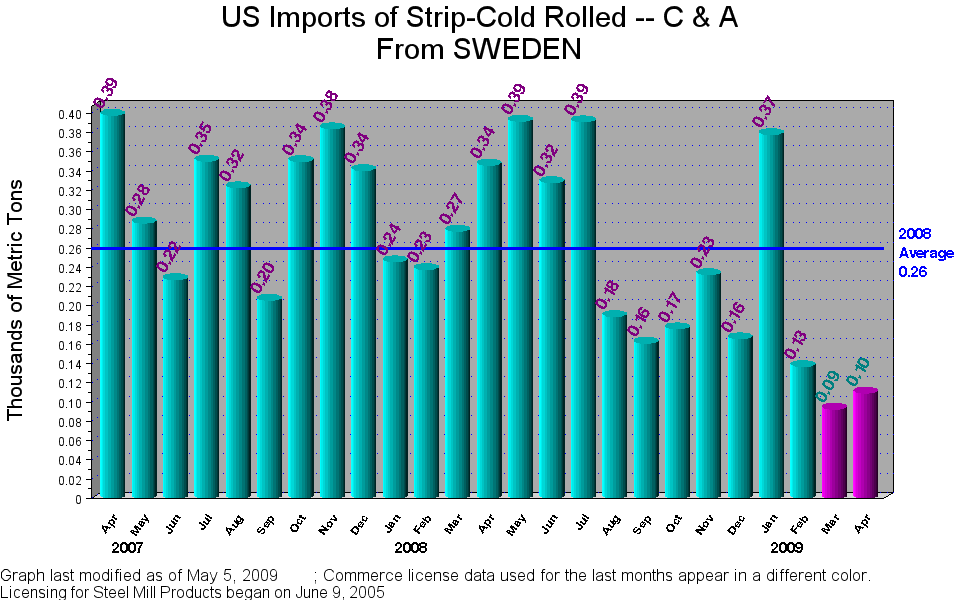
Strip-Cold Rolled -- C & A |
237.7 |
277.5 |
346.2 |
391.7 |
327.9 |
391.1 |
188.9 |
161.0 |
176.0 |
232.3 |
165.6 |
378.0 |
136.9 |
88.0 |
92.6 |
109.3 |
| M |
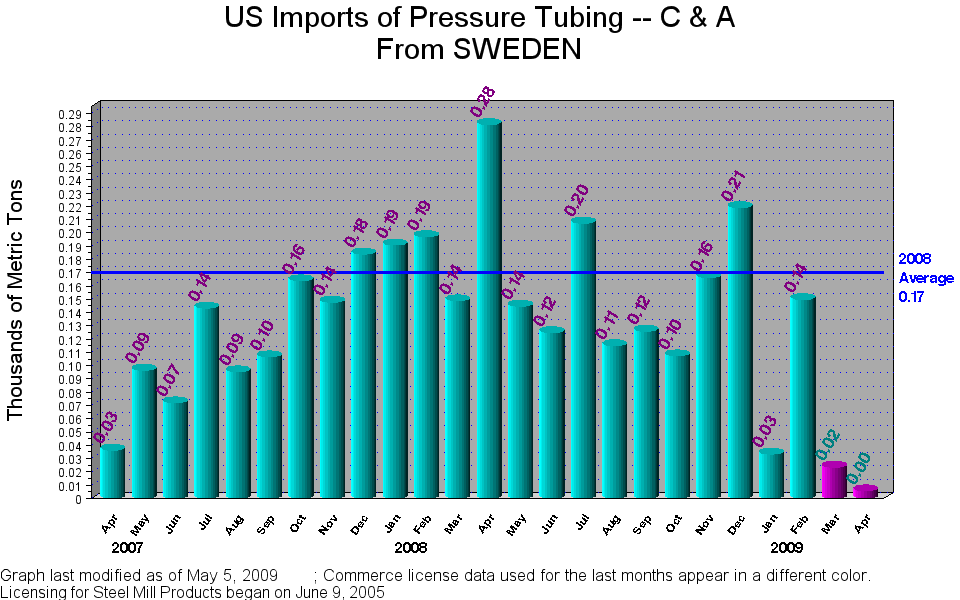
Pressure Tubing -- C & A |
197.1 |
148.7 |
281.6 |
144.7 |
124.8 |
207.3 |
115.0 |
125.9 |
107.3 |
166.1 |
219.0 |
33.3 |
149.7 |
22.7 |
23.3 |
5.54 |
| M |
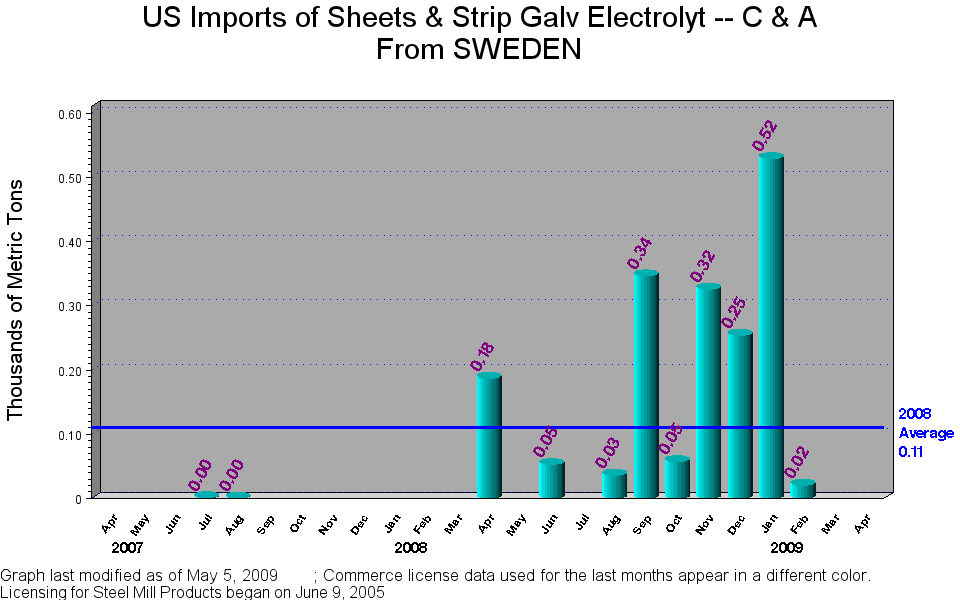
Sheets & Strip Galv Electrolyt -- C & A |
. |
. |
187.2 |
. |
52.7 |
. |
35.7 |
346.7 |
57.3 |
326.2 |
254.1 |
529.6 |
20.3 |
. |
. |
. |
| M |
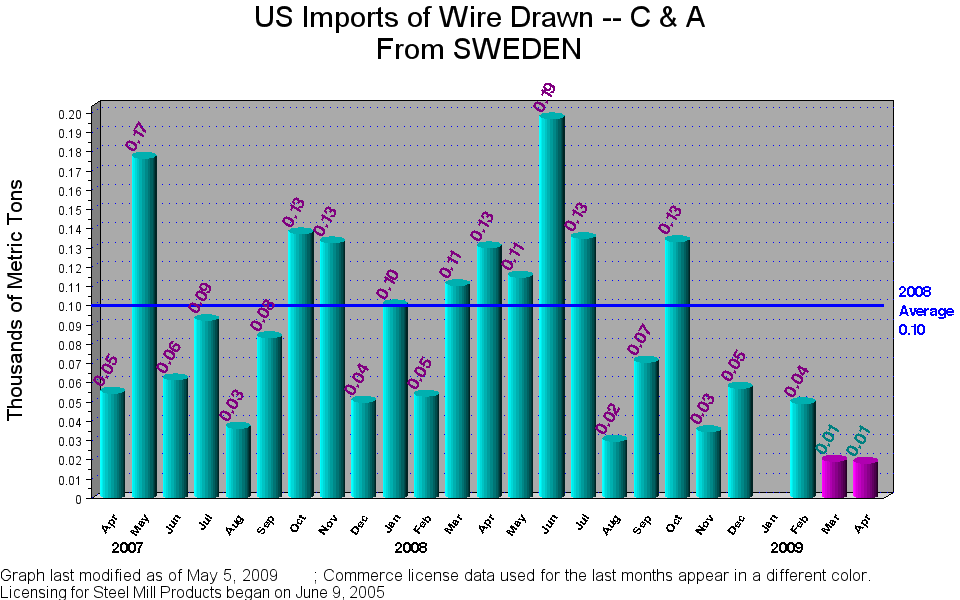
Wire Drawn -- C & A |
53.1 |
110.5 |
130.1 |
114.9 |
197.2 |
135.0 |
29.6 |
70.6 |
133.4 |
34.6 |
57.1 |
. |
49.2 |
18.9 |
19.2 |
18.2 |
| M |
Sheets & Strip Galv Hot Dipped -- C & A |
43.0 |
63.4 |
6.99 |
20.1 |
40.5 |
100.5 |
27.2 |
25.1 |
256.0 |
133.5 |
7.36 |
. |
. |
. |
. |
. |
| M |
Bars-Cold Finished -- C & A |
55.6 |
35.9 |
46.6 |
81.8 |
98.5 |
96.0 |
5.45 |
. |
12.3 |
107.3 |
18.8 |
17.8 |
20.8 |
29.3 |
31.0 |
27.4 |
| M |
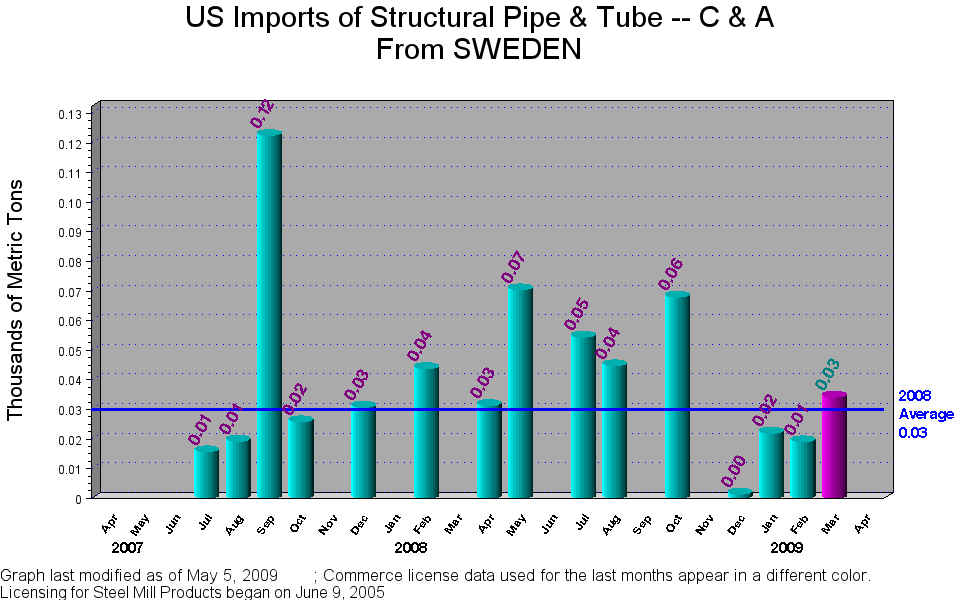
Structural Pipe & Tube -- C & A |
43.8 |
. |
31.3 |
70.4 |
. |
54.4 |
44.7 |
. |
67.9 |
. |
1.40 |
22.0 |
19.0 |
36.1 |
34.2 |
. |
| M |
Standard Pipe -- C & A |
0.05 |
4.34 |
13.9 |
13.6 |
8.44 |
. |
0.06 |
0.86 |
108.5 |
11.8 |
10.1 |
108.5 |
4.55 |
36.1 |
36.1 |
0.45 |
| M |
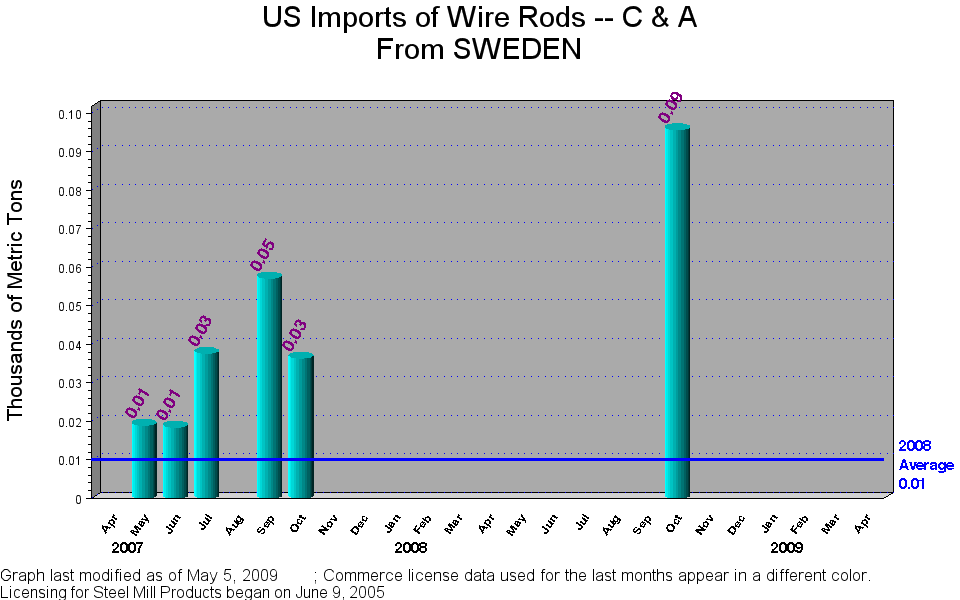
Wire Rods -- C & A |
. |
. |
. |
. |
. |
. |
. |
. |
95.7 |
. |
. |
. |
. |
. |
. |
. |
| M |
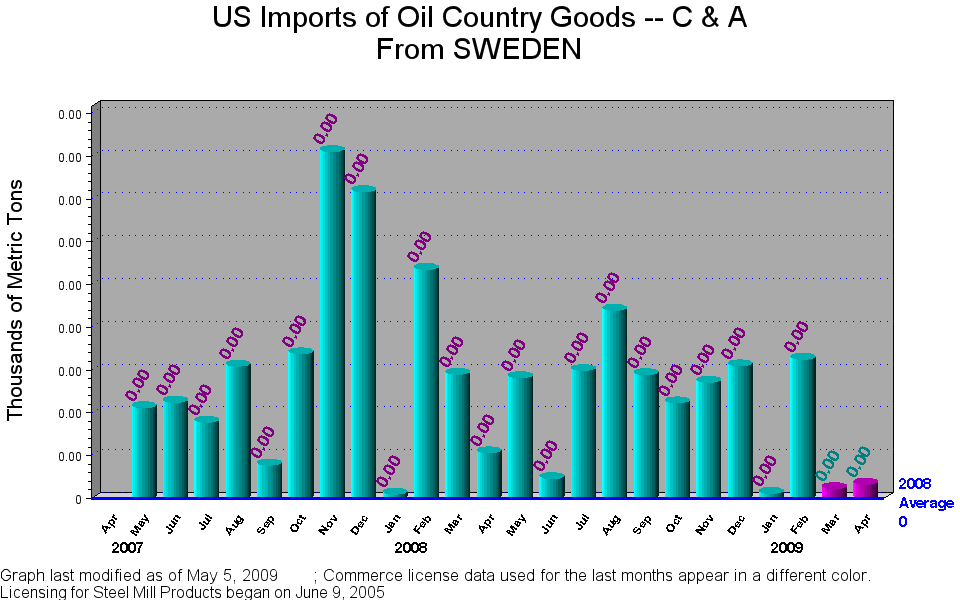
Oil Country Goods -- C & A |
5.35 |
2.90 |
1.06 |
2.82 |
0.46 |
2.99 |
4.39 |
2.89 |
2.23 |
2.71 |
3.09 |
0.11 |
3.25 |
. |
0.22 |
0.32 |
| M |
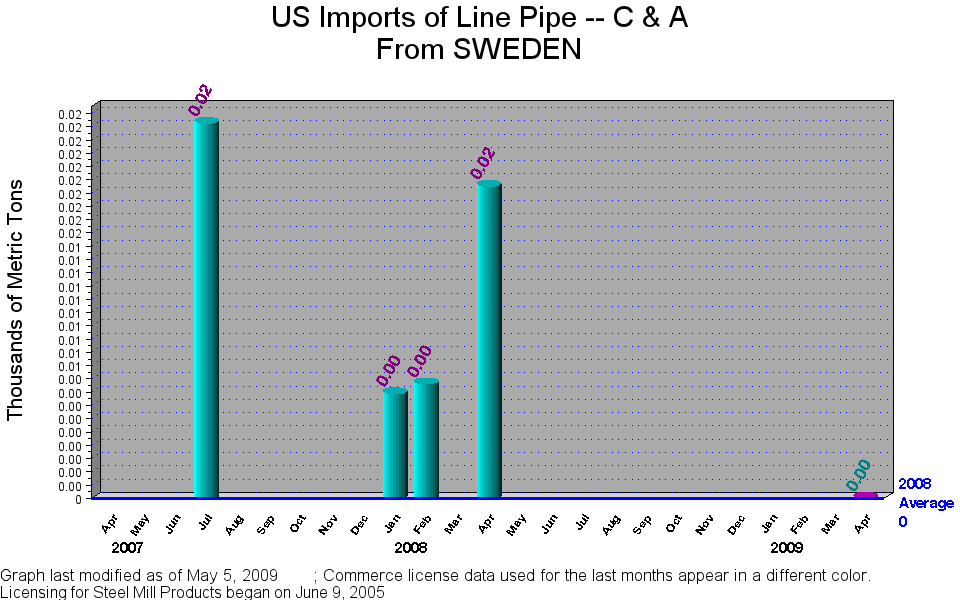
Line Pipe -- C & A |
8.61 |
. |
23.5 |
. |
. |
. |
. |
. |
. |
. |
. |
. |
. |
. |
. |
0.00 |
| M |
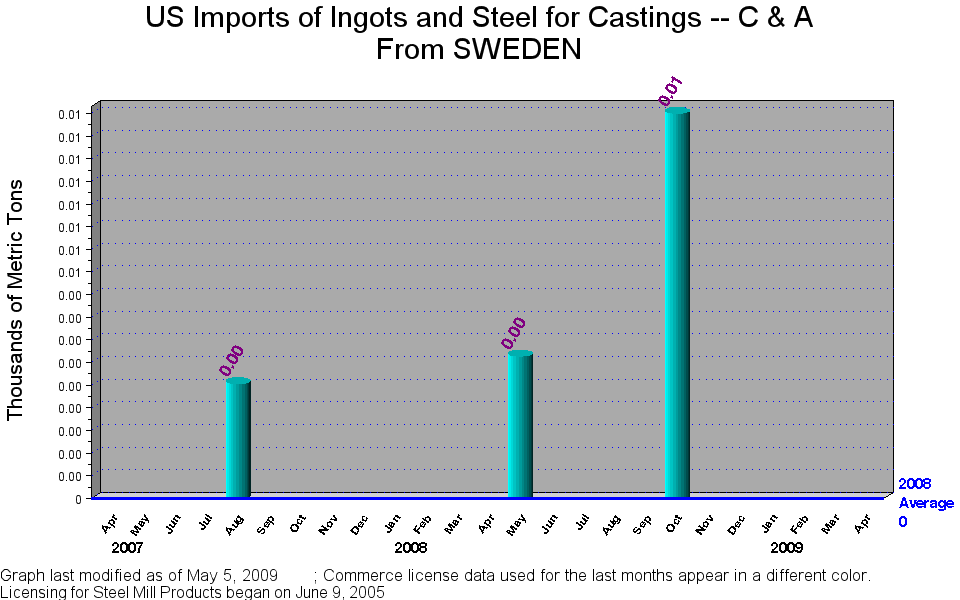
Ingots and Steel for Castings -- C & A |
. |
. |
. |
6.28 |
. |
. |
. |
. |
17.0 |
. |
. |
. |
. |
. |
. |
. |
| M |
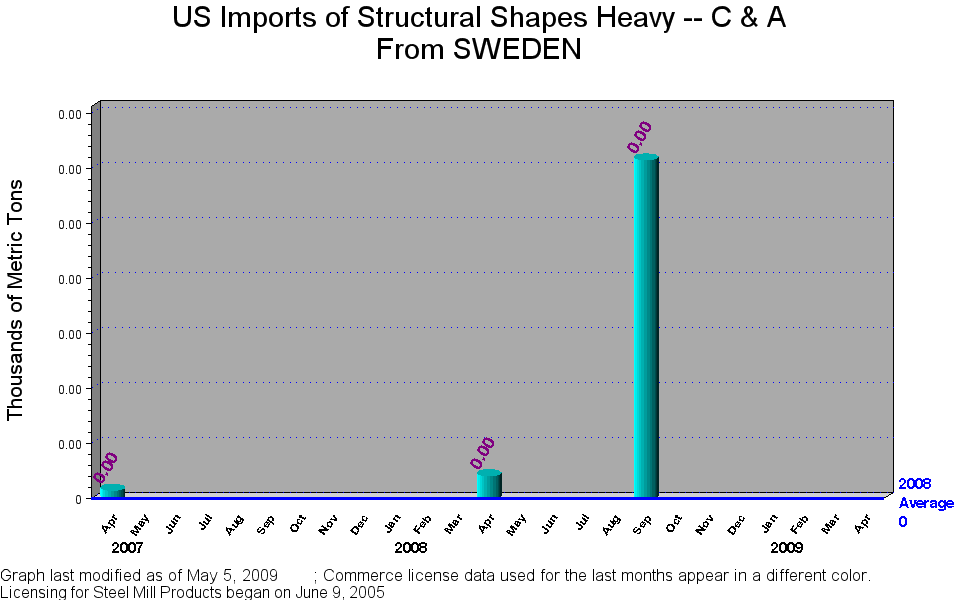
Structural Shapes Heavy -- C & A |
. |
. |
0.41 |
. |
. |
. |
. |
6.15 |
. |
. |
. |
. |
. |
. |
. |
. |
| M |
Pipe & Tubing Nonclassified -- C & A |
. |
. |
. |
. |
. |
. |
. |
1.19 |
. |
. |
. |
0.78 |
. |
. |
0.07 |
. |
| M |
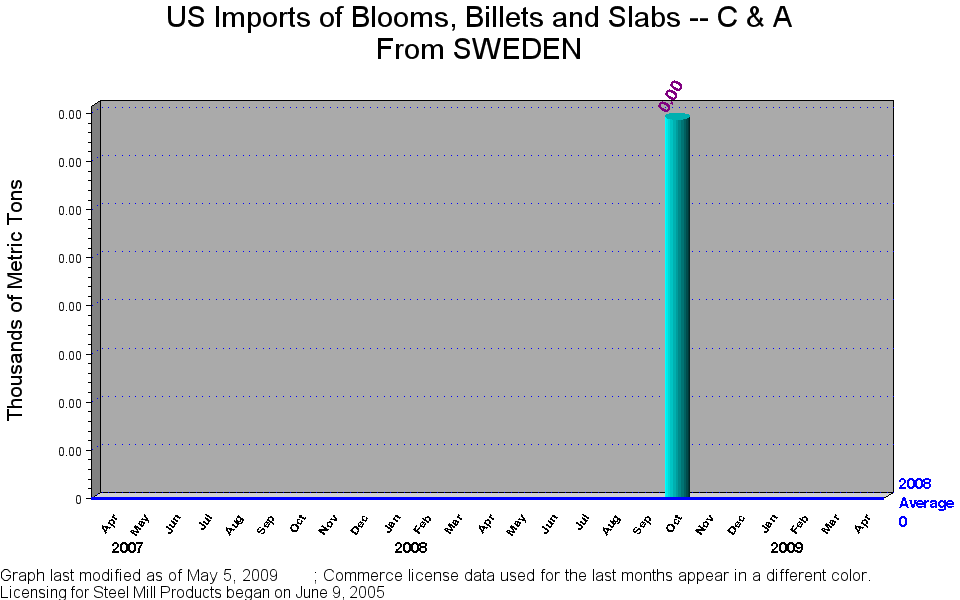
Blooms, Billets and Slabs -- C & A |
. |
. |
. |
. |
. |
. |
. |
. |
0.78 |
. |
. |
. |
. |
. |
. |
. |
| M |
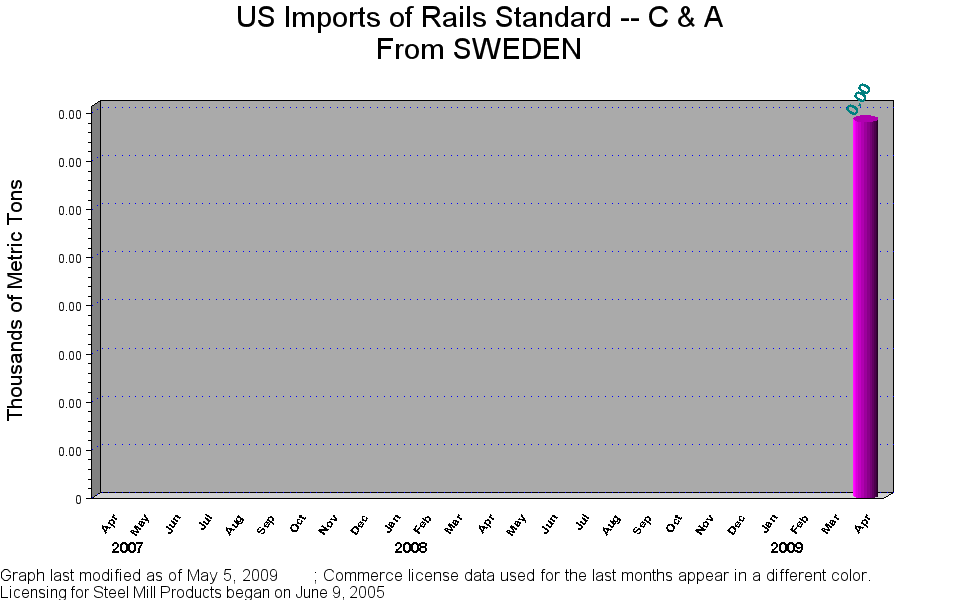
Rails Standard -- C & A |
. |
. |
. |
. |
. |
. |
. |
. |
. |
. |
. |
. |
. |
. |
. |
0.78 |
| Stainless Products |
| M |
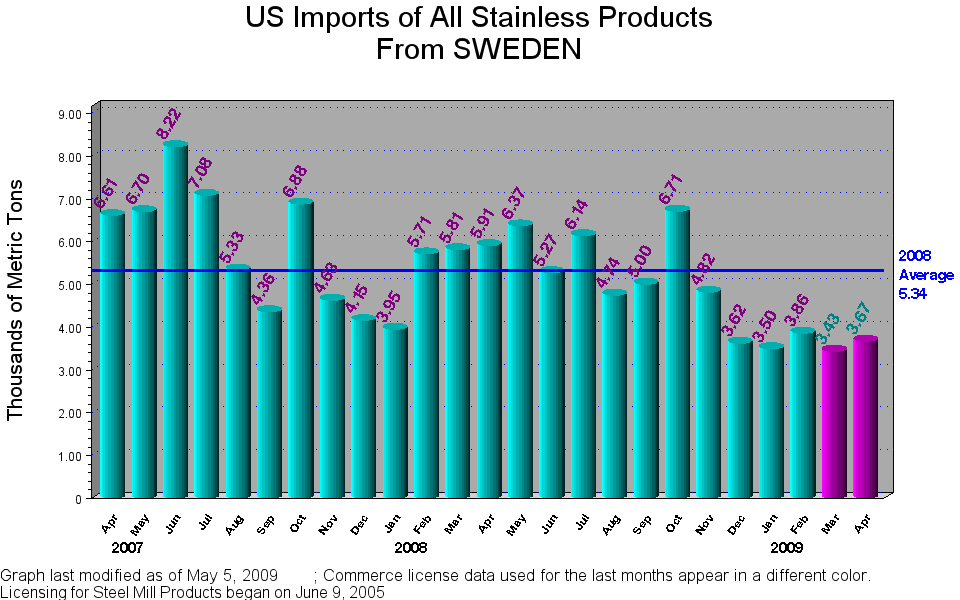
All Stainless Products |
5,716 |
5,814 |
5,911 |
6,371 |
5,273 |
6,143 |
4,747 |
5,008 |
6,710 |
4,820 |
3,627 |
3,500 |
3,860 |
3,108 |
3,437 |
3,678 |
| M |
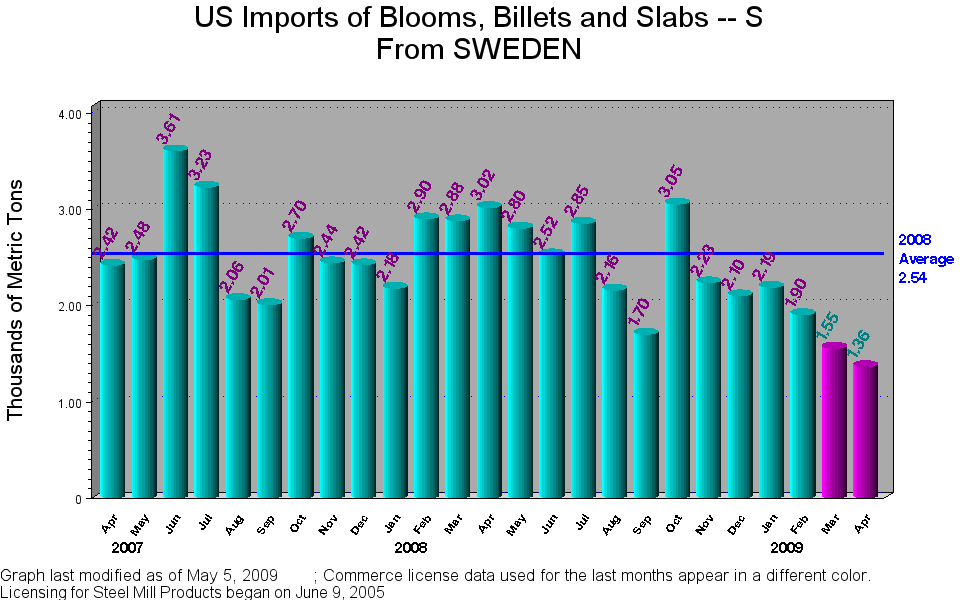
Blooms, Billets and Slabs -- S |
2,904 |
2,883 |
3,022 |
2,806 |
2,529 |
2,857 |
2,165 |
1,703 |
3,059 |
2,239 |
2,103 |
2,191 |
1,908 |
1,585 |
1,558 |
1,369 |
| M |
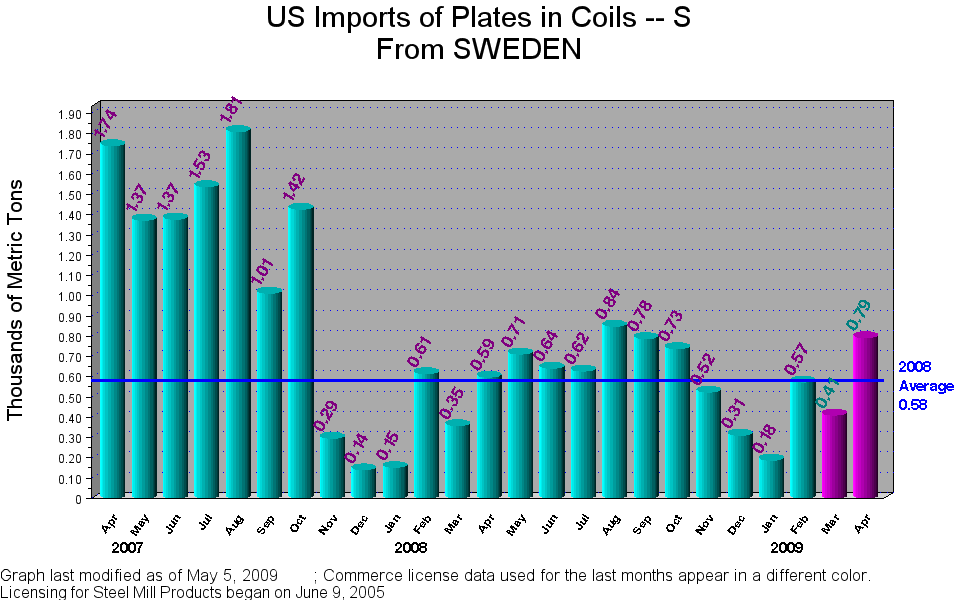
Plates in Coils -- S |
615.5 |
358.5 |
598.8 |
712.1 |
641.1 |
628.4 |
848.7 |
788.6 |
739.0 |
524.5 |
310.8 |
188.3 |
573.5 |
97.4 |
410.5 |
793.4 |
| M |
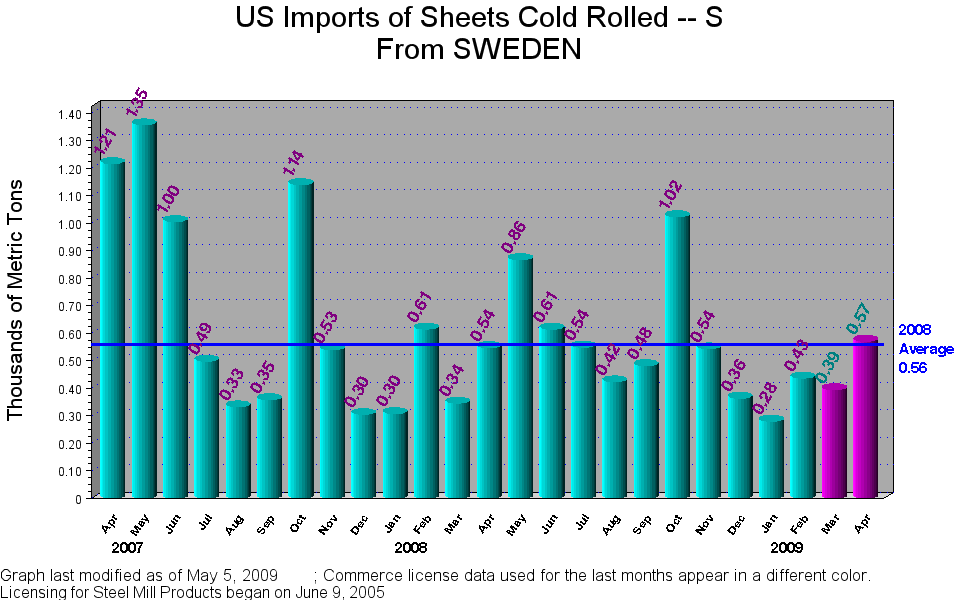
Sheets Cold Rolled -- S |
615.8 |
346.5 |
547.8 |
868.0 |
615.0 |
549.2 |
423.4 |
482.2 |
1,024 |
543.6 |
364.0 |
280.3 |
437.1 |
397.7 |
395.2 |
570.9 |
| M |
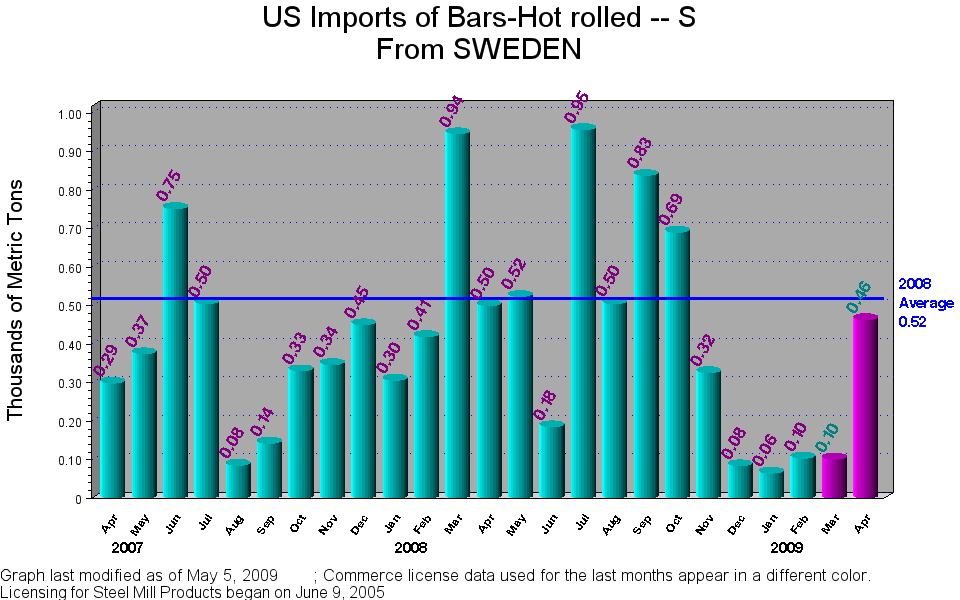
Bars-Hot rolled -- S |
419.9 |
947.0 |
500.3 |
524.4 |
185.6 |
957.9 |
505.9 |
838.8 |
691.3 |
326.3 |
84.2 |
65.4 |
104.2 |
103.0 |
101.8 |
464.2 |
| M |
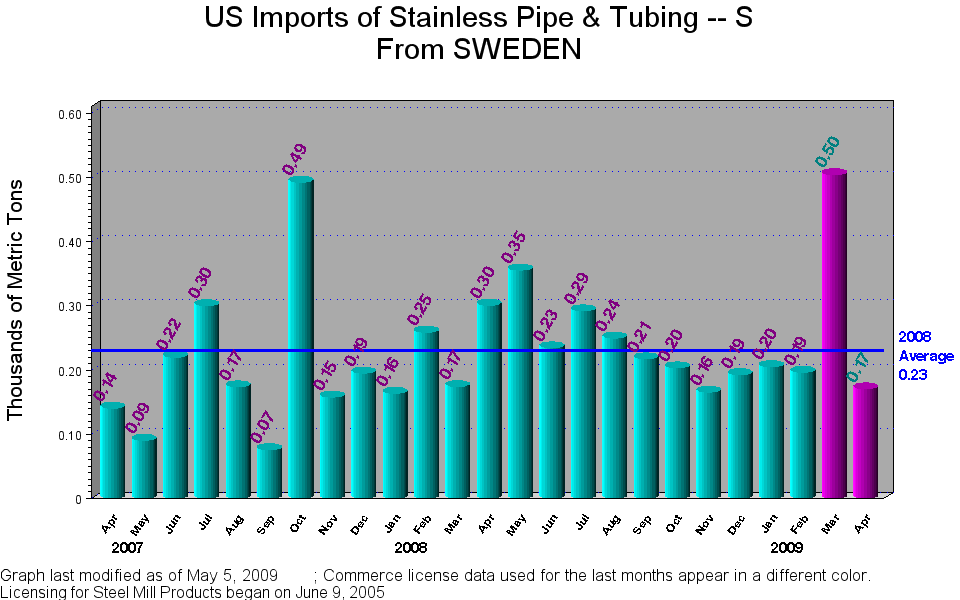
Stainless Pipe & Tubing -- S |
258.8 |
174.3 |
301.0 |
355.8 |
234.4 |
292.1 |
249.8 |
217.2 |
203.3 |
165.7 |
192.5 |
205.3 |
196.2 |
449.8 |
504.7 |
170.7 |
| M |
Strip-Cold Rolled -- S |
204.6 |
175.6 |
231.0 |
269.2 |
432.8 |
234.3 |
198.1 |
179.4 |
287.0 |
388.6 |
123.7 |
187.3 |
151.4 |
182.7 |
186.3 |
108.6 |
| M |
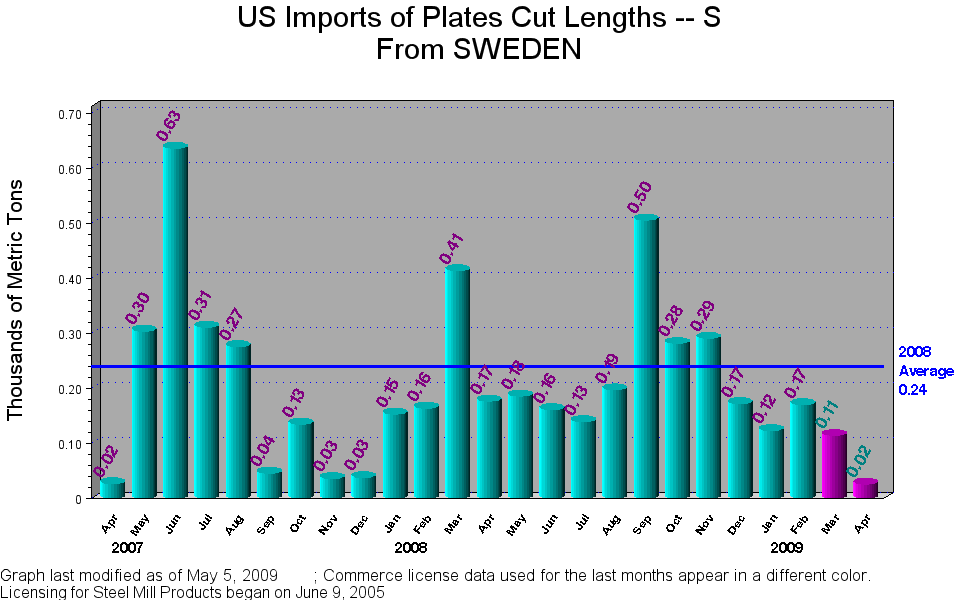
Plates Cut Lengths -- S |
163.9 |
413.9 |
176.8 |
186.0 |
161.1 |
139.4 |
197.2 |
506.0 |
281.5 |
290.8 |
172.0 |
123.3 |
170.1 |
113.4 |
114.2 |
25.9 |
| M |
Wire Rods -- S |
210.9 |
215.9 |
231.8 |
212.9 |
188.6 |
286.9 |
21.9 |
122.4 |
184.3 |
125.0 |
139.4 |
148.9 |
97.8 |
106.6 |
106.7 |
115.0 |
| M |
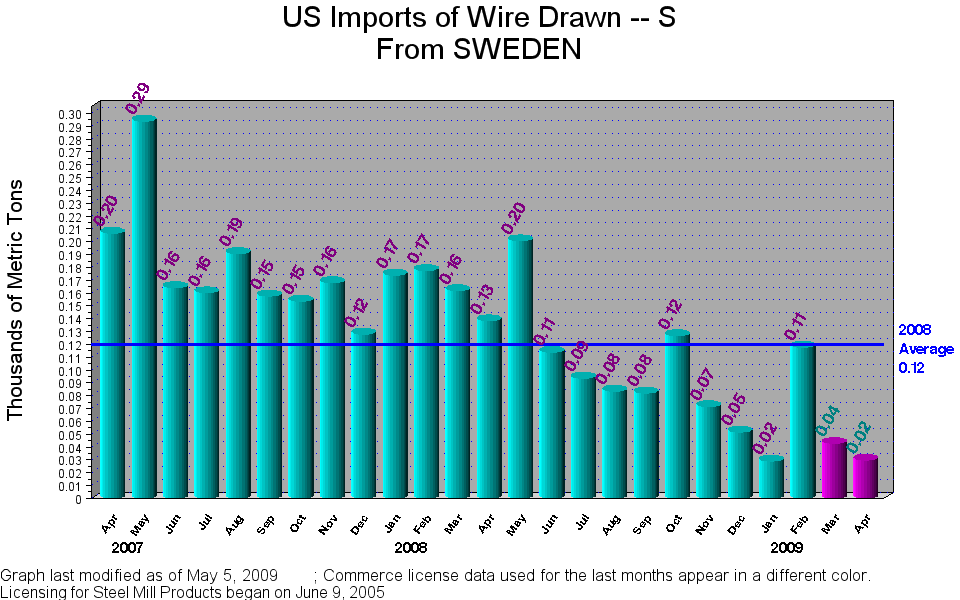
Wire Drawn -- S |
177.5 |
161.7 |
138.3 |
200.7 |
113.7 |
93.5 |
83.3 |
81.9 |
126.7 |
71.4 |
51.6 |
29.0 |
117.7 |
53.3 |
42.7 |
29.8 |
| M |
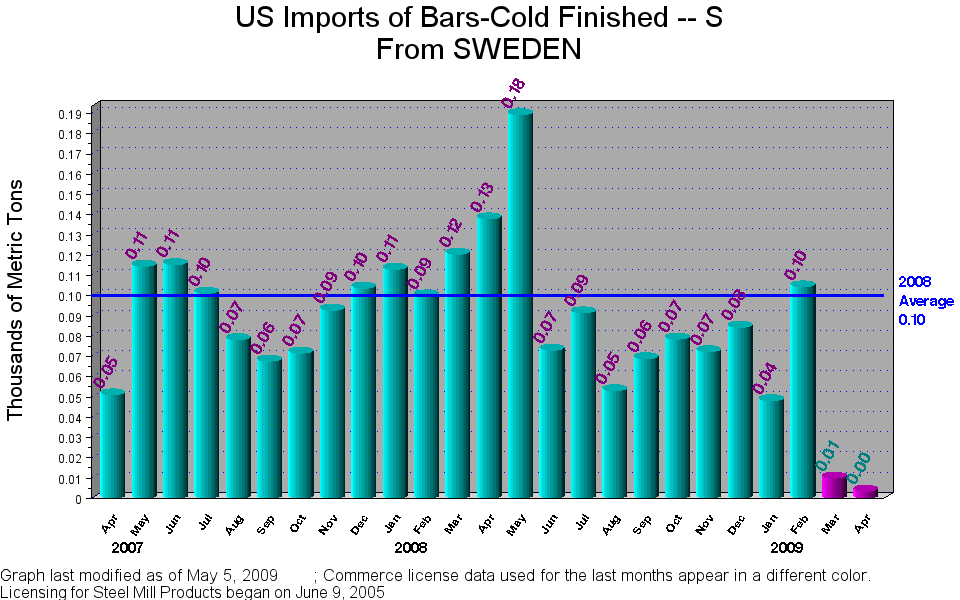
Bars-Cold Finished -- S |
99.9 |
120.5 |
137.9 |
189.4 |
73.1 |
91.5 |
53.1 |
68.9 |
78.6 |
72.3 |
84.4 |
48.2 |
104.3 |
12.5 |
10.0 |
3.52 |
| M |
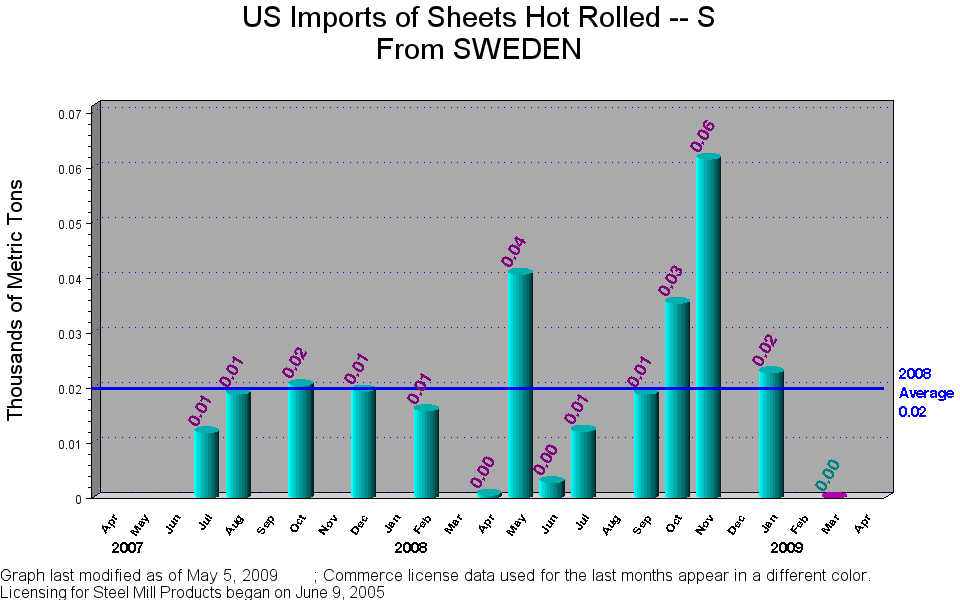
Sheets Hot Rolled -- S |
15.9 |
. |
0.56 |
40.7 |
2.87 |
12.1 |
. |
18.9 |
35.4 |
61.7 |
. |
22.8 |
. |
. |
0.01 |
. |
| M |
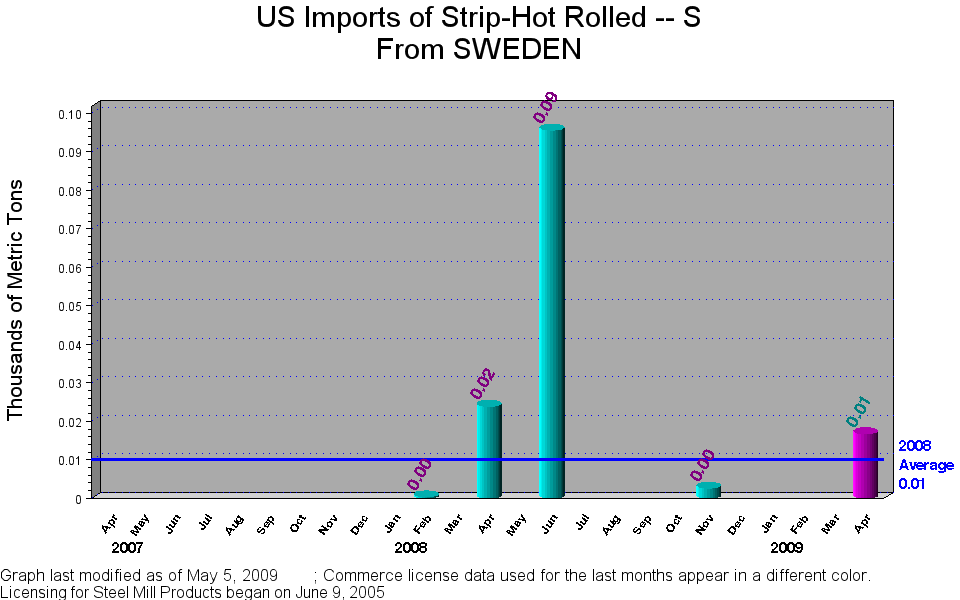
Strip-Hot Rolled -- S |
0.38 |
. |
23.9 |
. |
95.6 |
. |
. |
. |
. |
2.65 |
. |
. |
. |
. |
. |
16.7 |
| M |
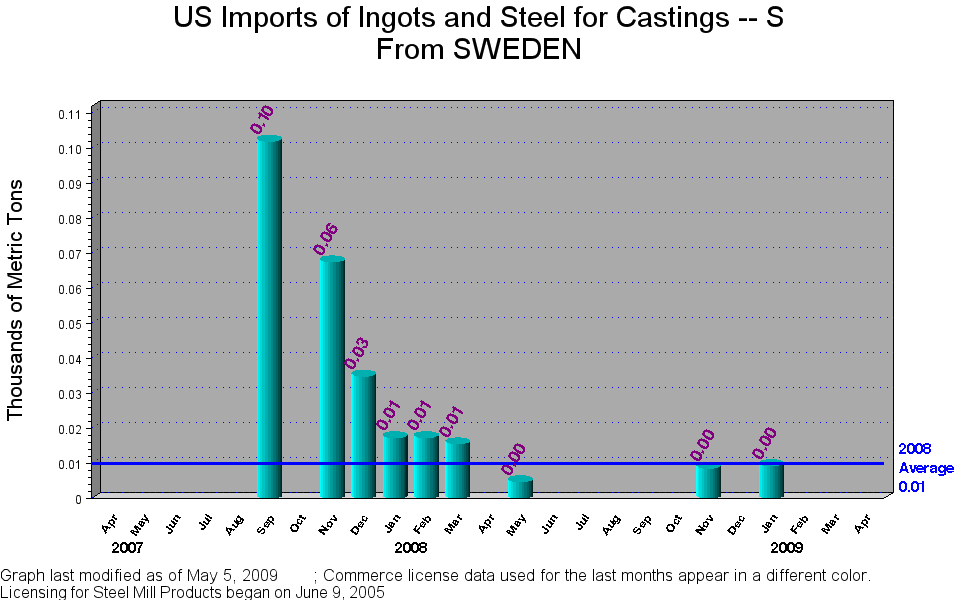
Ingots and Steel for Castings -- S |
17.3 |
15.5 |
. |
4.75 |
. |
. |
. |
. |
. |
8.60 |
. |
9.31 |
. |
. |
. |
. |
| M |
Oil Country Goods -- S |
11.7 |
. |
. |
. |
0.18 |
. |
. |
. |
. |
. |
. |
. |
. |
6.07 |
6.07 |
10.1 |
| M |
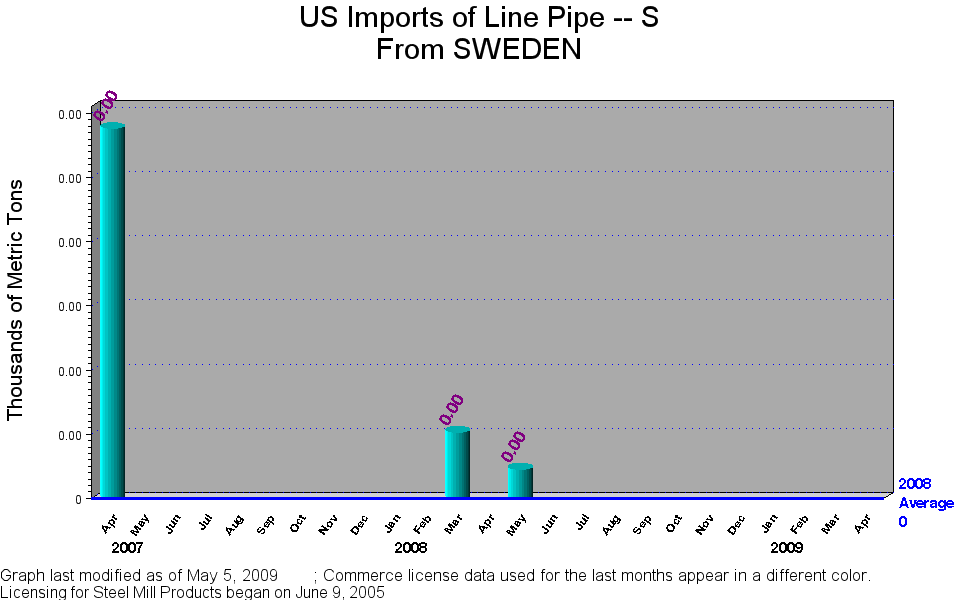
Line Pipe -- S |
. |
1.02 |
. |
0.45 |
. |
. |
. |
. |
. |
. |
. |
. |
. |
. |
. |
. |
| M |
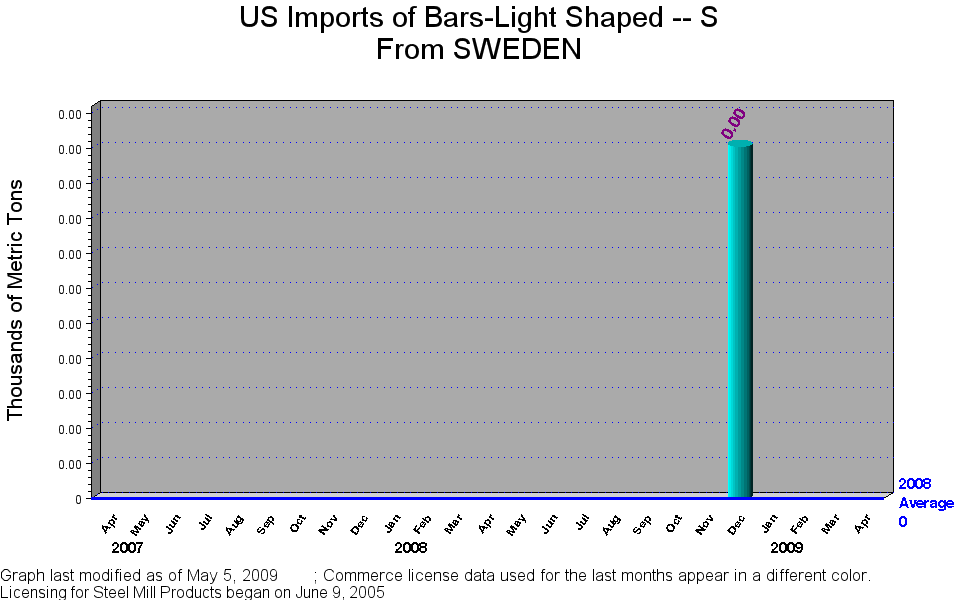
Bars-Light Shaped -- S |
. |
. |
. |
. |
. |
. |
. |
. |
. |
. |
1.00 |
. |
. |
. |
. |
. |