| All Steel Mill Products |
| M |
All Steel Mill Products |
66.6 |
308.9 |
364.1 |
187.1 |
200.2 |
792.9 |
1,325 |
1,051 |
427.3 |
776.8 |
132.7 |
356.4 |
16.5 |
188.7 |
549.9 |
31.6 |
| Carbon and Alloy Products |
| M |
All Carbon and Alloy Products |
47.4 |
289.8 |
345.6 |
168.0 |
181.0 |
792.9 |
1,325 |
1,051 |
427.3 |
776.8 |
132.7 |
356.4 |
16.5 |
188.7 |
545.2 |
31.6 |
| M |
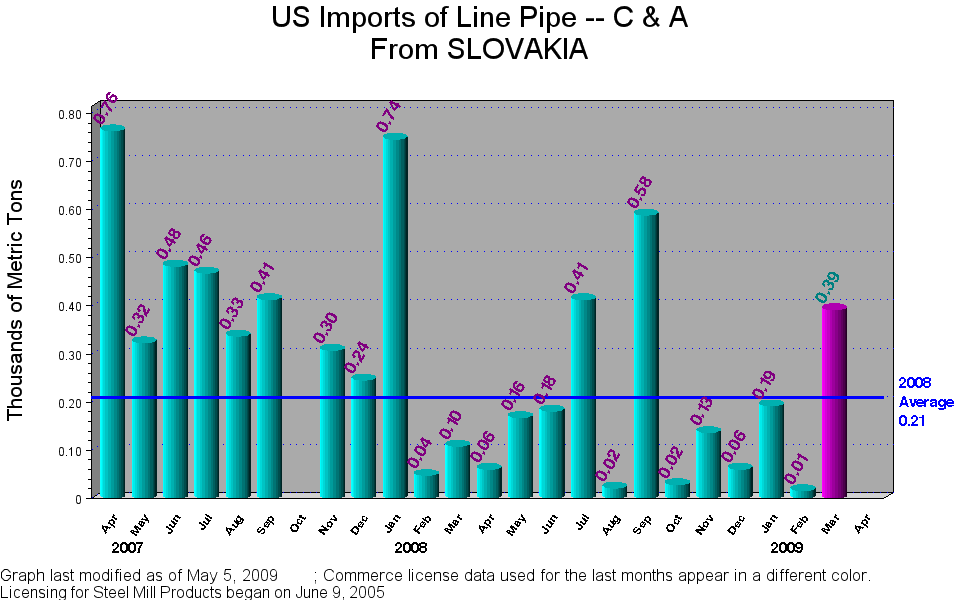
Line Pipe -- C & A |
47.4 |
108.0 |
60.1 |
168.0 |
181.0 |
412.6 |
21.1 |
588.6 |
28.3 |
136.7 |
60.6 |
191.9 |
16.0 |
75.5 |
391.9 |
. |
| M |
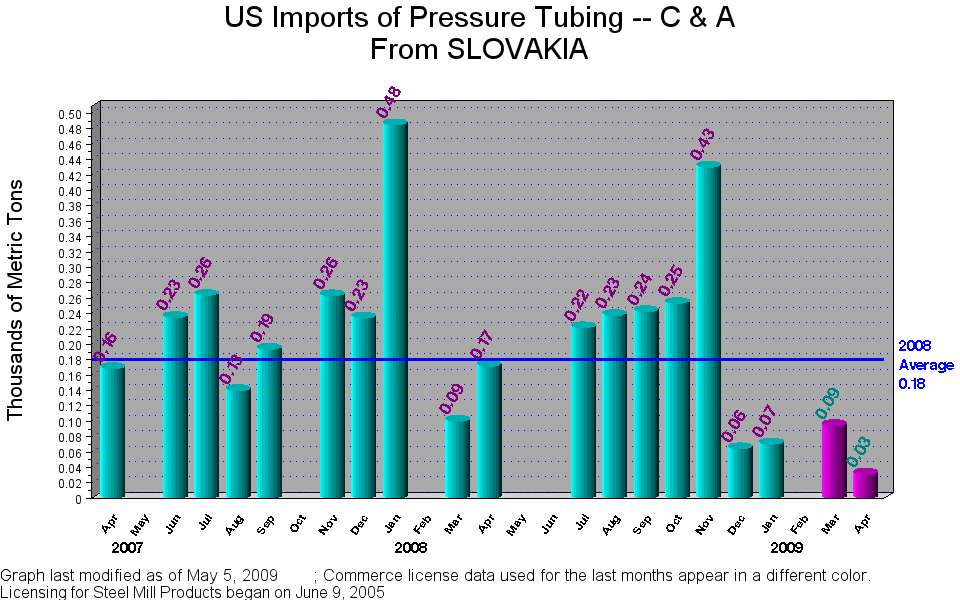
Pressure Tubing -- C & A |
. |
99.9 |
171.5 |
. |
. |
221.4 |
237.4 |
242.3 |
253.1 |
430.1 |
64.3 |
70.5 |
. |
94.2 |
94.2 |
31.1 |
| M |
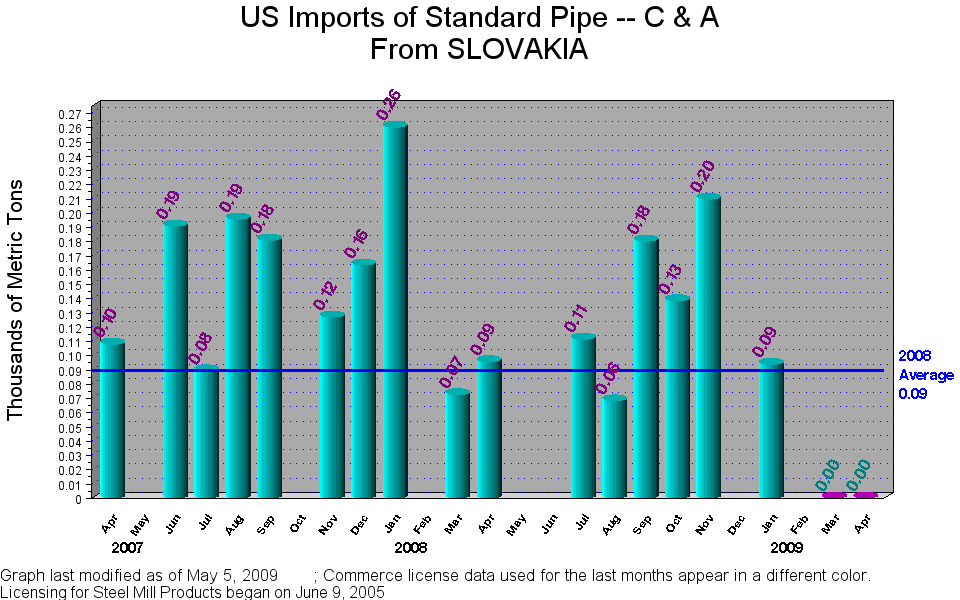
Standard Pipe -- C & A |
. |
72.7 |
95.8 |
. |
. |
111.5 |
68.3 |
180.4 |
138.6 |
209.9 |
. |
93.9 |
. |
. |
0.08 |
0.19 |
| M |
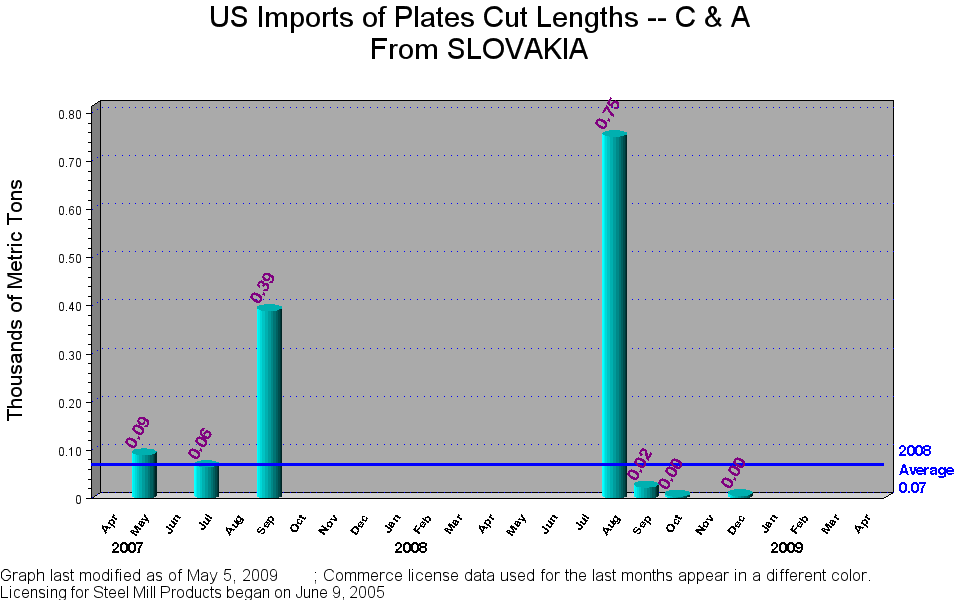
Plates Cut Lengths -- C & A |
. |
. |
. |
. |
. |
. |
752.1 |
23.3 |
4.17 |
. |
5.76 |
. |
. |
. |
. |
. |
| M |
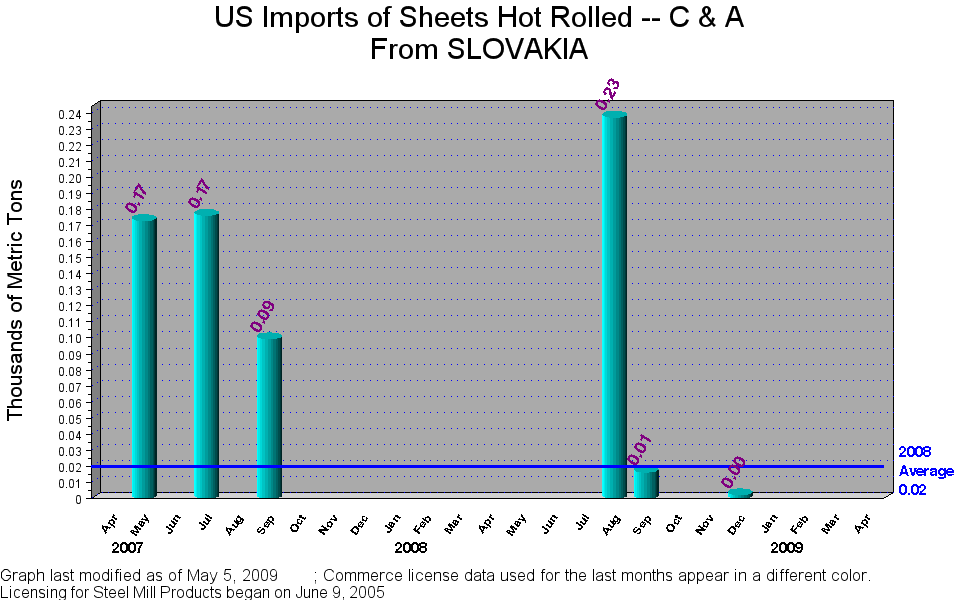
Sheets Hot Rolled -- C & A |
. |
. |
. |
. |
. |
. |
237.6 |
16.4 |
. |
. |
2.12 |
. |
. |
. |
. |
. |
| M |
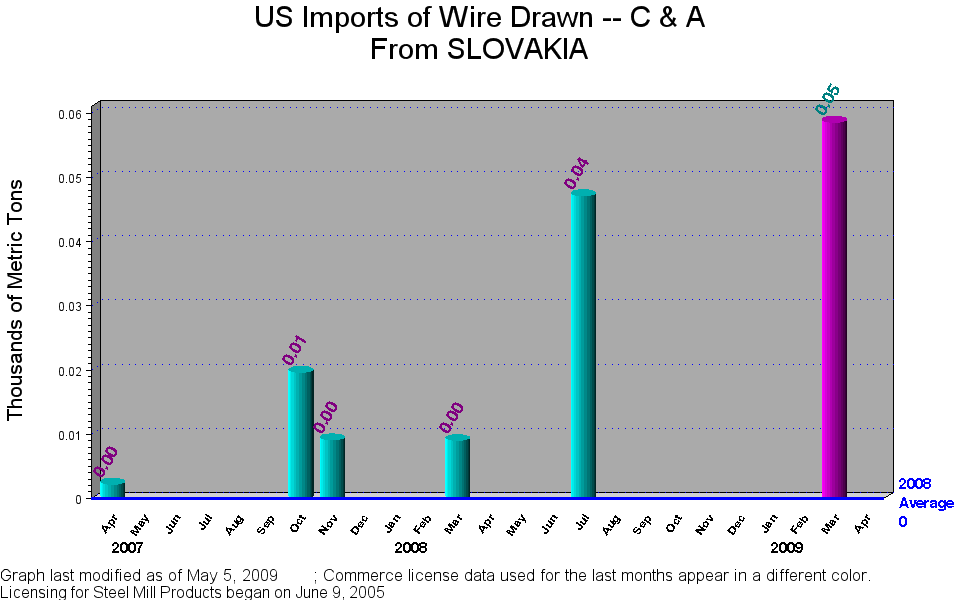
Wire Drawn -- C & A |
. |
9.01 |
. |
. |
. |
47.1 |
. |
. |
. |
. |
. |
. |
. |
18.9 |
58.6 |
. |
| M |
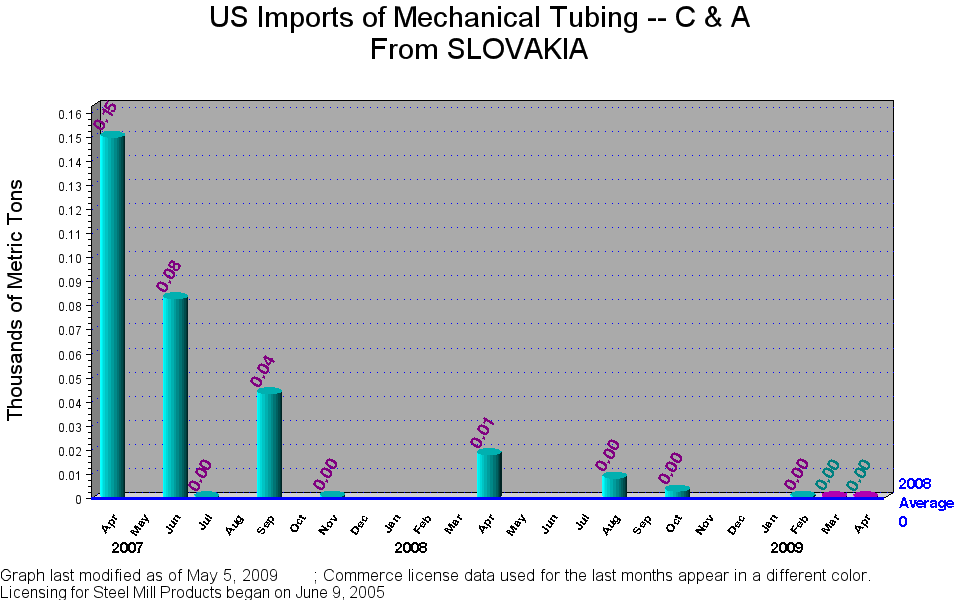
Mechanical Tubing -- C & A |
. |
. |
18.1 |
. |
. |
. |
8.34 |
. |
3.01 |
. |
. |
. |
0.54 |
. |
0.30 |
0.24 |
| M |
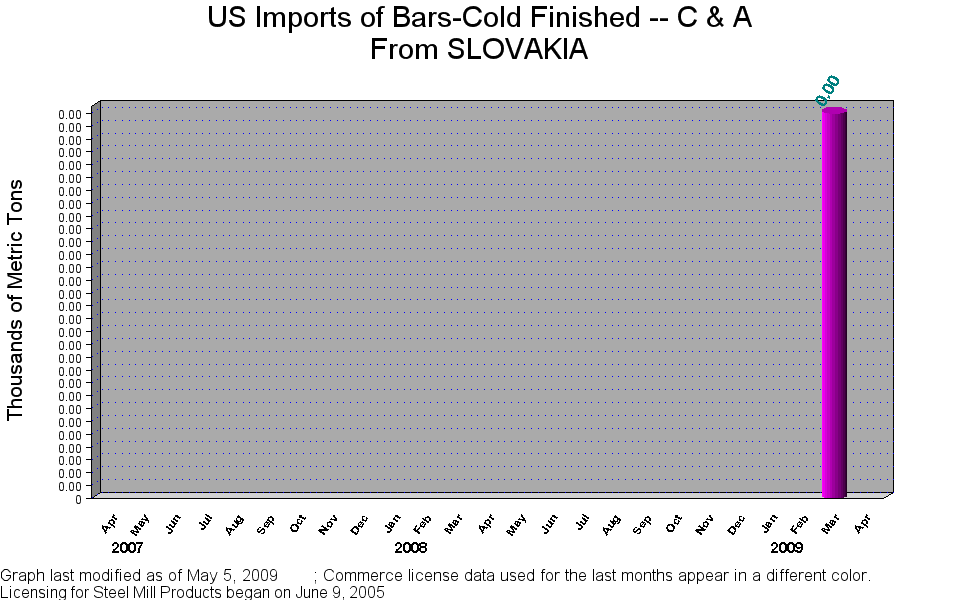
Bars-Cold Finished -- C & A |
. |
. |
. |
. |
. |
. |
. |
. |
. |
. |
. |
. |
. |
. |
0.00 |
. |
| Stainless Products |
| M |
All Stainless Products |
19.1 |
19.0 |
18.4 |
19.1 |
19.1 |
. |
. |
. |
. |
. |
. |
. |
. |
. |
4.73 |
. |
| M |
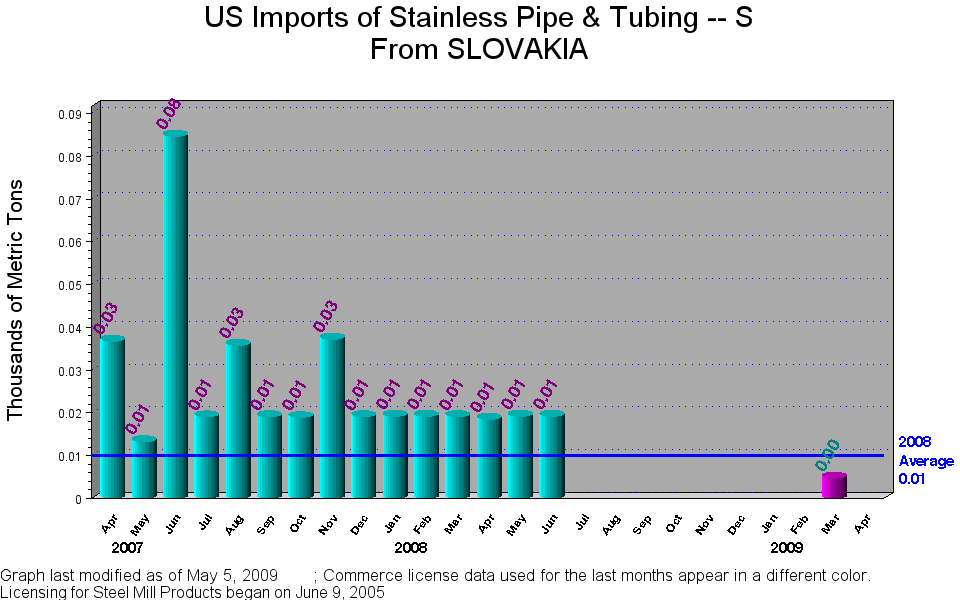
Stainless Pipe & Tubing -- S |
19.1 |
19.0 |
18.4 |
19.1 |
19.1 |
. |
. |
. |
. |
. |
. |
. |
. |
. |
4.73 |
. |