FRIDAY, OCTOBER 13, 2006, AT 8:30 A.M. EDT
| Special Notice – Beginning with the December 13, 2006 release for November 2006, data will be based on a new sample. In addition, a special release providing historic data on a new sample basis will be provided in November after the November 14, 2006 release covering October 2006 data. A new sample for the Advance Monthly Retail Trade Survey is selected about once every two and a half years. For further information on the sample revision, see our website at http://www.census.gov/retail. |
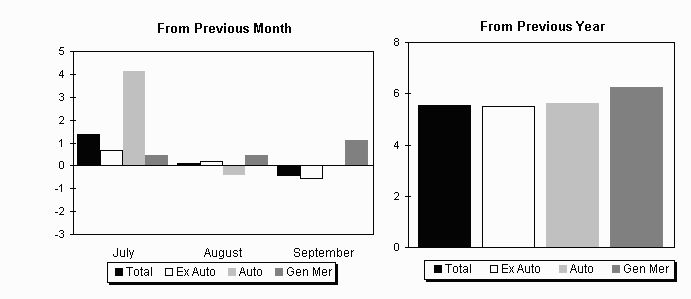
The U.S. Census Bureau announced today that advance estimates of U.S. retail and food services sales for September, adjusted for seasonal variation and holiday and trading-day differences, but not for price changes, were $366.2 billion, a decrease of 0.4 percent (±0.7%)* from the previous month, but up 5.5 percent (±0.7%) from September 2005. Total sales for the July through September 2006 period were up 5.6 percent (±0.5%) from the same period a year ago. The July to August 2006 percent change was revised from +0.2 percent (± 0.7%)* to +0.1 percent (± 0.3%)*.
Retail trade sales were down 0.6 percent (±0.7%)* from August, but were 5.2 percent (±0.8%) above last year. Nonstore retailers were up 12.9 percent (±4.6%) from September 2005 and sales of clothing and clothing accessories stores were up 10.7 percent (±1.5%) from last year.
The advance estimates are based on a subsample of the Census Bureau's full retail and food services sample. A stratified random sampling method is used to select approximately 5,000 retail and food services firms whose sales are then weighted and benchmarked to represent the complete universe of over three million retail and food services firms. Responding firms account for approximately 65% of the MARTS dollar volume estimate. For an explanation of the measures of sampling variability included in this report, please see the Reliability of Estimates section on the last page of this publication.
Percent Change in Retail and Food Services Sales
(Estimates adjusted for seasonal variation, holiday, and trading-day differences, but not for price changes)
The Advance Monthly Retail Sales Report for October is scheduled to be released November 14, 2006 at 8:30 a.m. EST.
For information, visit the Census Bureau's Web site at <http://www.census.gov/retail>. This report is also available the day of issue through the Department of Commerce's STAT-USA (202-482-1986).
* The 90 percent confidence interval includes zero. The Census Bureau does not have sufficient statistical evidence to conclude that the actual change is different than zero.
TABLE 1A. ESTIMATED MONTHLY SALES FOR RETAIL AND FOOD SERVICES, BY KIND OF BUSINESS--September 2006
(Total sales estimates are shown in millions of dollars and are based on data from the Advance Monthly Retail Trade Survey, Monthly Retail Trade Survey, and administrative records.)(2) (In Millions of dollars) 2006 2006 2006 2005 2005 NAICS(1) Kind of Business Sep(3) Aug Jul Sep Aug Code (a) (p) (r) (r) (r) Retail & food services, total.................... 366,166 367,736 367,415 346,955 345,648 Total (excl. motor vehicle & parts)............ 290,438 292,032 291,424 275,259 271,609 Retail ....................................... 329,950 331,870 331,988 313,518 312,485 GAFO(4).......................................... (*) 94,078 93,905 89,081 89,041 441 Motor vehicle & parts dealers.................... 75,728 75,704 75,991 71,696 74,039 4411,4412 Auto & other motor veh. dealers................. 69,309 69,372 69,644 65,614 67,905 442 Furniture & home furnishings stores.............. 10,056 10,033 10,044 9,619 9,377 443 Electronics & appliance stores.................... 8,851 8,835 8,825 8,470 8,381 44311,13 Appl., T.V. & camera........................... (*) 7,261 7,284 6,858 6,735 44312 Computer & software stores...................... (*) 1,574 1,541 1,612 1,646 444 Building material & garden eq. & supplies dealers 30,163 29,980 29,808 27,846 27,452 4441 Building mat. & supplies dealers................ (*) 26,427 26,239 24,542 24,200 445 Food & beverage stores........................... 45,584 45,737 45,555 43,771 43,429 4451 Grocery stores.................................. 40,384 40,580 40,442 39,045 38,811 4453 Beer, wine & liquor stores...................... (*) 3,231 3,225 2,961 2,931 446 Health & personal care stores.................... 18,918 18,878 18,676 17,623 17,378 44611 Pharmacies & drug stores........................ (*) 15,854 15,708 14,653 14,561 447 Gasoline stations................................ 34,024 37,530 38,010 36,313 34,018 448 Clothing & clothing accessories stores........... 18,481 17,937 17,980 16,689 16,826 44811 Men's clothing stores........................... (*) 772 777 775 788 44812 Women's clothing stores......................... (*) 3,256 3,319 3,085 3,086 4482 Shoe stores..................................... (*) 2,190 2,144 2,034 2,025 451 Sporting goods, hobby, book & music stores....... 7,312 7,236 7,250 6,760 6,918 452 General merchandise stores....................... 46,870 46,366 46,151 44,110 44,120 4521 Department stores (ex. L.D.).................... 17,854 17,682 17,674 17,458 17,840 4521 Department stores (incl. L.D.)(5)............... (*) (NA) (NA) (NA) (NA) 4529 Other general merchandise stores................ (*) 28,684 28,477 26,652 26,280 45291 Warehouse clubs & supercenters................. (*) 25,184 24,981 23,239 22,902 45299 All other gen. merchandise stores.............. (*) 3,500 3,496 3,413 3,378 453 Miscellaneous store retailers.................... 9,998 9,919 9,929 9,391 9,264 454 Nonstore retailers............................... 23,965 23,715 23,769 21,230 21,283 4541 Electronic shopping & mail-order houses......... (*) 15,550 15,310 13,554 13,835 722 Food services & drinking places.................. 36,216 35,866 35,427 33,437 33,163 (*) Advance estimates are not available for this kind of business. (NA) Not available (a) Advance estimate (p) Preliminary estimate (r) Revised estimate (1) For a full description of the NAICS codes used in this table, see http://www.census.gov/epcd/www/naics.html (2) Estimates are concurrently adjusted for seasonal variation and for holiday and trading day differences, but not for price changes. Concurrent seasonal adjustment uses all available unadjusted estimates as input to the X-12 ARIMA program. The factors derived from the program are used in calculating all seasonally adjusted estimates shown in this table. Year-to-date seasonally adjusted sales estimates are not tabulated. Adjustment factors and explanatory material can be found on the Internet at http://www.census.gov/mrts/www/mrts.html (3) Advance estimates are based on early reports obtained from a small sample of firms selected from the larger Monthly Retail Trade Survey (MRTS) sample. All other estimates are from the MRTS sample. (4) GAFO represents firms which specialize in department store types of merchandise and is comprised of furniture & home furnishings (442), electronics & appliances (443), clothing & accessories(448), sporting goods, hobby, book, and music (451), general merchandise(452), office supply, stationery, and gift stores(4532). (5) Estimates include data for leased departments operated within department stores. Data for this line are not included in broader kind-of-business totals.TABLE 1B. ESTIMATED MONTHLY SALES FOR RETAIL AND FOOD SERVICES, BY KIND OF BUSINESS--September 2006
Data not adjusted for seasonal variations, holiday, trading-day differences, and price changes. (In Millions of dollars and Annual Percent Change) 9 month total % Chg. 2006 2006 2006 2005 2005 NAICS(1) Kind of Business 2006 from Sep(2) Aug Jul Sep Aug Code 2005 (a) (p) (r) (r) (r) Retail & food services, total.................... 3,222,864 6.7 353,750 382,410 368,611 336,696 358,936 Total (excl. motor vehicle & parts)............ 2,525,214 8.6 280,804 298,563 286,903 266,658 276,998 Retail ....................................... 2,903,400 6.6 317,824 345,181 331,696 303,761 324,612 GAFO(3).......................................... (*) (*) (*) 94,236 88,105 82,063 88,966 441 Motor vehicle & parts dealers.................... 697,650 0.4 72,946 83,847 81,708 70,038 81,938 4411,4412 Auto & other motor veh. dealers................. 640,338 0.1 66,675 76,933 75,215 63,974 75,307 44111 New car dealers................................ (*) (*) (*) 62,954 61,067 52,130 61,325 4413 Auto parts, acc. & tire stores.................. (*) (*) (*) 6,914 6,493 6,064 6,631 442 Furniture & home furnishings stores.............. 86,748 8.6 9,895 10,515 9,843 9,446 9,808 4421 Furniture stores................................ (*) (*) (*) 5,457 5,145 5,051 5,181 4422 Home furnishings stores......................... (*) (*) (*) 5,058 4,698 4,395 4,627 443 Electronics & appliance stores.................... 73,450 6.0 8,152 8,776 8,185 7,807 8,362 44311,13 Appl., T.V. & camera........................... (*) (*) (*) 7,123 6,767 6,179 6,668 44312 Computer & software stores...................... (*) (*) (*) 1,653 1,418 1,628 1,694 444 Building material & garden eq. & supplies dealers 274,373 11.9 29,883 31,672 30,262 28,193 29,133 4441 Building mat. & supplies dealers................ (*) (*) (*) 28,620 26,764 25,646 26,330 445 Food & beverage stores........................... 401,658 5.0 45,065 46,599 46,674 43,050 43,824 4451 Grocery stores.................................. 358,014 4.2 40,021 41,473 41,453 38,498 39,238 4453 Beer, wine & liquor stores...................... (*) (*) (*) 3,231 3,322 2,914 2,916 446 Health & personal care stores.................... 164,665 7.2 18,161 18,859 18,060 16,971 17,448 44611 Pharmacies & drug stores........................ (*) (*) (*) 15,822 15,174 14,184 14,561 447 Gasoline stations................................ 327,797 14.4 35,283 41,170 40,785 37,330 37,284 448 Clothing & clothing accessories stores........... 145,878 7.1 16,809 17,995 16,360 15,015 16,757 44811 Men's clothing stores........................... (*) (*) (*) 790 685 687 800 44812 Women's clothing stores......................... (*) (*) (*) 2,999 2,957 2,940 2,845 44814 Family clothing stores.......................... (*) (*) (*) 7,143 6,610 5,775 6,592 4482 Shoe stores..................................... (*) (*) (*) 2,589 2,058 1,879 2,393 451 Sporting goods, hobby, book & music stores....... 59,972 7.0 6,888 7,786 6,525 6,314 7,464 452 General merchandise stores....................... 386,968 5.9 42,681 45,133 43,881 40,059 42,843 4521 Department stores (ex. L.D.).................... 144,445 -0.5 15,858 16,963 15,985 15,460 17,155 4521 Department stores (incl. L.D.)(4)............... (*) (*) (*) 17,370 16,374 15,867 17,601 4529 Other general merchandise stores................ (*) (*) (*) 28,170 27,896 24,599 25,688 45291 Warehouse clubs & supercenters................. (*) (*) (*) 24,831 24,631 21,473 22,513 45299 All other gen. merchandise stores.............. (*) (*) (*) 3,339 3,265 3,126 3,175 453 Miscellaneous store retailers.................... 86,817 8.1 9,692 10,201 9,435 9,272 9,511 454 Nonstore retailers............................... 197,424 12.8 22,369 22,628 19,978 20,266 20,240 4541 Electronic shopping & mail-order houses......... (*) (*) (*) 15,301 13,350 13,066 13,641 722 Food services & drinking places.................. 319,464 8.2 35,926 37,229 36,915 32,935 34,324 (*) Advance estimates are not available for this kind of business. (NA) Not available (a) Advance estimate (p) Preliminary estimate (r) Revised estimate (1) For a full description of the NAICS codes used in this table, see http://www.census.gov/epcd/www/naics.html (2) Advance estimates are based on early reports obtained from a small sample of firms selected from the larger Monthly Retail Trade Survey (MRTS) sample. All other estimates are from the MRTS sample. (3) GAFO represents firms which specialize in department store types of merchandise and is comprised of furniture & home furnishings (442), electronics & appliances (443), clothing & accessories(448), sporting goods, hobby, book, and music (451), general merchandise(452), office supply, stationery, and gift stores(4532). (4) Estimates include data for leased departments operated within department stores. Data for this line are not included in broader kind-of-business totals.TABLE 2. ESTIMATED CHANGE IN SALES FOR RETAIL AND FOOD SERVICES, BY KIND OF BUSINESS--September 2006
(Estimates are shown as percents and are based on data from the Advance Monthly Retail Trade Survey, Monthly Retail Trade Survey, and administrative records.) Sep Aug 2006 2006 adv. prel. from-- from-- NAICS Kind of Business Aug Sep Jul Aug Code 2006 2005 2006 2005 (p) (r) (r) (r) Retail & food Services, total.................... -0.4 +5.5 +0.1 +6.4 Total (excl. motor vehicle & parts ).......... -0.5 +5.5 +0.2 +7.5 Retail .................................. -0.6 +5.2 0.0 +6.2 441 Motor vehicle & parts dealers.................... 0.0 +5.6 -0.4 +2.2 4411,4412 Auto & other motor veh. dealers............... -0.1 +5.6 -0.4 +2.2 442 Furniture & home furnishings stores.............. +0.2 +4.5 -0.1 +7.0 443 Electronics & appliance stores................... +0.2 +4.5 +0.1 +5.4 444 Building material & garden eq. & supplies dealers +0.6 +8.3 +0.6 +9.2 445 Food & beverage stores........................... -0.3 +4.1 +0.4 +5.3 4451 Grocery stores.................................. -0.5 +3.4 +0.3 +4.6 446 Health & personal care stores.................... +0.2 +7.3 +1.1 +8.6 447 Gasoline stations................................ -9.3 -6.3 -1.3 +10.3 448 Clothing & clothing accessories stores........... +3.0 +10.7 -0.2 +6.6 451 Sporting goods, hobby, book & music stores........ +1.1 +8.2 -0.2 +4.6 452 General merchandise stores....................... +1.1 +6.3 +0.5 +5.1 4521 Department stores (ex. L.D.).................... +1.0 +2.3 0.0 -0.9 453 Miscellaneous stores retailers................... +0.8 +6.5 -0.1 +7.1 454 Nonstore retailers............................... +1.1 +12.9 -0.2 +11.4 722 Food services & drinking places.................. +1.0 +8.3 +1.2 +8.2 (p) Preliminary estimate (r) Revised estimate (*) Estimates shown in this table are derived from adjusted estimates provided in Table 1 of this report. Data not adjusted for seasonal variations, holiday, trading-day differences, and price changes. Sep Aug 2006 2006 adv. prel. from-- from-- NAICS Kind of Business Aug Sep Jul Aug Code 2006 2005 2006 2005 (p) (r) (r) (r) Retail & food Services, total.................... -7.5 +5.1 +3.7 +6.5 Total (excl. motor vehicle & parts ).......... -5.9 +5.3 +4.1 +7.8 Retail .................................. -7.9 +4.6 +4.1 +6.3 441 Motor vehicle & parts dealers.................... -13.0 +4.2 +2.6 +2.3 4411,4412 Auto & other motor veh. dealers................ -13.3 +4.2 +2.3 +2.2 442 Furniture & home furnishings stores.............. -5.9 +4.8 +6.8 +7.2 443 Electronics & appliance stores................... -7.1 +4.4 +7.2 +5.0 444 Building material & garden eq. & supplies dealers -5.6 +6.0 +4.7 +8.7 445 Food & beverage stores........................... -3.3 +4.7 -0.2 +6.3 4451 Grocery stores.................................. -3.5 +4.0 0.0 +5.7 446 Health & personal care stores.................... -3.7 +7.0 +4.4 +8.1 447 Gasoline stations................................ -14.3 -5.5 +0.9 +10.4 448 Clothing & clothing accessories stores........... -6.6 +11.9 +10.0 +7.4 451 Sporting goods, hobby, book & music stores........ -11.5 +9.1 +19.3 +4.3 452 General merchandise stores....................... -5.4 +6.5 +2.9 +5.3 4521 Department stores (ex. L.D.).................... -6.5 +2.6 +6.1 -1.1 453 Miscellaneous stores retailers................... -5.0 +4.5 +8.1 +7.3 454 Nonstore retailers............................... -1.1 +10.4 +13.3 +11.8 722 Food services & drinking places.................. -3.5 +9.1 +0.9 +8.5 (p) Preliminary estimate (r) Revised estimate (*) Estimates shown in this table are derived from adjusted estimates provided in Table 1 of this report. Note: Table 3 provides estimated measures of sampling variability. Additional information on confidentiality protection, sampling error, nonsampling error, sample design, and definitions may be found at http://www.census.gov/mrts/www/mrts.html SOURCE: Advance Monthly Sales for Retail Trade and Food Services--SEPTEMBER 2006 (Press Release available without charge from Public Information Office, Bureau of the Census Washington, D.C. 20233). Survey methodology and measures of sampling variability are documented in the Advance Press Release. Questions concerning this report should be directed to Mr. Scott Scheleur (301) 763-2713.
The U.S. Census Bureau conducts the Advance Monthly Retail Trade and Food Services Survey (MARTS) to provide an early estimate of
monthly sales by kind of business for retail and food service firms located in the United States.  Each month, questionnaires
are mailed to a probability sample of approximately 5,000 employer firms selected from the larger Monthly Retail Trade Survey
(MRTS).  Firms responding to MARTS account for approximately 65% of the total national sales estimate.  Advance sales estimates
are computed using a link relative estimator.  The change in sales from the previous month is estimated using only units that
have reported data for both the current and previous month.  There is no imputation or adjustment for nonrespondents in MARTS.
The total sales estimate is derived by multiplying this ratio by the preliminary sales estimate for the previous month (derived
from the larger MRTS sample).  Detailed industry estimates are summed to derive total estimates at broad industry levels.
The monthly estimates are adjusted using annual survey estimates and for seasonal variation and holiday and trading-day
differences.  Additional information on MARTS and MRTS can be found on the Census Bureau website at:
http://www.census.gov/mrts/www/mrts.html.
Because the estimates presented in this report are based on a sample survey, they contain sampling error
and nonsampling error.

Sampling error is the difference between the estimate and the result that would be obtained from a complete
enumeration of the sampling frame conducted under the same survey conditions.  This error occurs
because only a subset of the entire sampling frame is measured in a sample survey.  Standard errors and
coefficients of variation (CV), as given in Table 3 of this report, are estimated measures of
sampling variation.

The margin of sampling error, as used on page 1, gives a range about the estimate which is 90-percent
confidence interval.  If, for example, the percent change estimate is +1.2 percent and its
estimated standard error is 0.9 percent, then the margin of sampling error is ±1.65 x 0.9 percent or
±1.5 percent, and the 90 percent confidence interval is -0.3 percent to +2.7 percent.

If the interval contains 0, then one does not have sufficient statistical evidence to conclude at the 90 percent
confidence level that the change is different from zero and therefore the change is not statistically
significant. Estimated changes shown in the text are statistically significant unless otherwise noted.
For a monthly total, the median estimated coefficient of variation is given.  The resulting confidence interval
is the estimated value ±1.65 x CV x (the estimated monthly total).  The Census Bureau recommends that individuals
using estimates in this report incorporate this information into their analyses, as sampling error could affect
the conclusions drawn from the estimates.

Nonsampling error encompasses all other factors that contribute to the total error of a sample survey
estimate.  This type of error can occur because of nonresponse, insufficient coverage of the
universe of retail businesses, mistakes in the recording and coding of data, and other errors of collection,
response, coverage, or processing.  Although nonsampling error is not measured directly, the Census Bureau
employs quality control procedures throughout the process to minimize this type of error.

 Current Quarter Retail E-Commerce Sales


Source: U. S. Census Bureau
        Service Sector Statistics Division