
CB-04-17
|
Intention to Revise Retail Estimates: Monthly retail sales estimates will be revised based on the results of the 2002 Annual Retail Trade Survey.
|
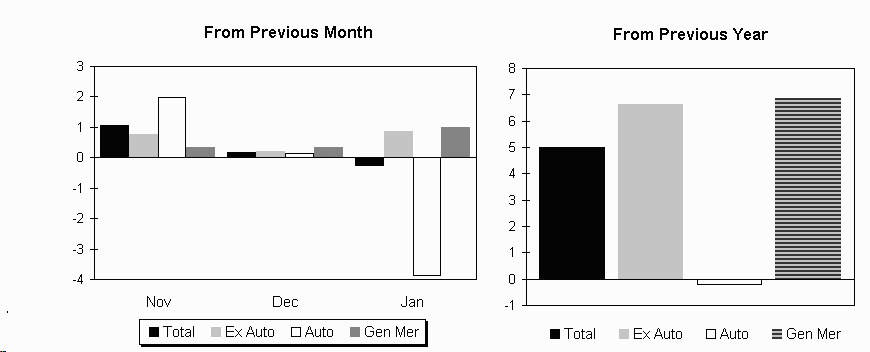
The Census Bureau of the Department of Commerce announced today that advance estimates of U.S. retail and food services sales for January, adjusted for seasonal, holiday, and trading-day differences, but not for price changes, were $322.9 billion, a decrease of 0.3 percent (±0.8%) from the previous month, but up 5.0 percent (±1.0%) from January 2003. Total sales for the November 2003 through January 2004 period were up 6.2 percent (±0.5%) from the same period a year ago. The November to December 2003 percent change was revised from 0.5 percent (±0.8%) to 0.2 percent (±0.3%).
Retail trade sales were down 0.4 percent (±0.8%) from December 2003, but were 4.5 percent (±1.0%) above last year. Electronics and appliance stores were up 11.5 percent (±2.5%) from January 2003 and sales of food services and drinking places were up 10.4 percent (±2.6%) from last year.
The advance estimates are based on a subsample of the Bureau's full retail and food services sample. A stratified random sampling method is used to select approximately 5,000 retail and food services firms whose sales are then weighted and benchmarked to represent the complete universe of over three million retail and food services firms. Responding firms account for approximately 65% of the MARTS dollar volume estimate. For an explanation of the measures of sampling variability included in this report, please see the Reliability of Estimates section at the end of this page.
This report is available the day of issue through the Department of Commerce's online Economic Bulletin Board. For information call (202) 482-1986.
TABLE 1A. ESTIMATED ADVANCE MONTHLY SALES FOR RETAIL AND FOOD SERVICES, BY KIND OF BUSINESS--January 2004
(In Millions of dollars) 2004 2003 2003 2003 2002 NAICS Kind of Business Jan Dec Nov Code adv. prel. final Jan(r) Dec(r) Retail & food services, total.................... 322,867 323,699 323,076 307,456 304,537 Total (excl. motor vehicle & parts)............ 248,920 246,777 246,271 233,472 231,043 Retail ....................................... 291,223 292,400 291,921 278,798 275,763 GAFO............................................. (*) 82,901 82,718 78,745 78,689 441 Motor vehicle & parts dealers.................... 73,947 76,922 76,805 73,984 73,494 4411,4412 Auto & other motor veh. dealers................. 67,249 70,165 70,100 67,641 67,242 442 Furniture & home furnishings stores.............. 8,502 8,578 8,574 8,078 7,987 443 Electronics & appliance stores.................... 8,319 8,309 8,295 7,462 7,522 44311,13 Appl., T.V. & camera........................... (*) 5,935 5,948 5,467 5,460 44312 Computer & software stores...................... (*) 2,374 2,347 1,995 2,062 444 Building material & garden eq. & supplies dealers 28,170 28,413 28,244 25,868 24,875 4441 Building mat. & supplies dealers................ (*) 24,822 24,806 22,728 21,806 445 Food & beverage stores........................... 43,552 42,792 42,962 41,866 41,327 4451 Grocery stores.................................. 39,180 38,476 38,609 37,809 37,248 4453 Beer, wine & liquor stores...................... (*) 2,753 2,759 2,608 2,649 446 Health & personal care stores.................... 16,591 16,515 16,483 15,469 15,124 44611 Pharmacies & drug stores........................ (*) 14,146 14,110 13,191 12,849 447 Gasoline stations................................ 22,890 22,505 22,465 21,832 21,331 448 Clothing & clothing accessories stores........... 15,680 15,245 15,269 14,698 14,525 44811 Men's clothing stores........................... (*) 883 867 814 814 44812 Women's clothing stores......................... (*) 3,094 3,083 2,911 2,929 4482 Shoe stores..................................... (*) 1,877 1,888 1,776 1,802 451 Sporting goods, hobby, book & music stores....... 6,945 6,834 6,796 6,803 6,818 452 General merchandise stores....................... 40,966 40,569 40,434 38,339 38,437 4521 Department stores (ex. L.D.).................... 18,114 18,017 18,018 18,175 18,336 4521 Department stores (incl. L.D.).................. (*) (NA) (NA) (NA) (NA) 4529 Other general merchandise stores................ (*) 22,552 22,416 20,164 20,101 45291 Warehouse clubs & superstores.................. (*) 19,113 19,022 17,080 17,024 45299 All other gen. merchandise stores.............. (*) 3,439 3,394 3,084 3,077 453 Miscellaneous store retailers.................... 8,905 8,906 8,940 8,745 8,681 454 Nonstore retailers............................... 16,756 16,812 16,654 15,654 15,642 4541 Electronic shopping & mail-order houses......... (*) 10,657 10,494 9,992 9,862 722 Food services & drinking places.................. 31,644 31,299 31,155 28,658 28,774 (*) Advance estimates are not available from the subsample panel for these business classifications. (NA) Not available. (r) Revised.
Data adjusted for seasonal variations, holiday, and trading-day differences, but not for price changes.TABLE 1B. ESTIMATED ADVANCE MONTHLY SALES FOR RETAIL AND FOOD SERVICES, BY KIND OF BUSINESS--January 2004 Data not adjusted for seasonal variations, holiday, trading-day differences, and price changes. (In Millions of dollars and Annual Percent Change)
1 month total % Chg. 2004 2003 2003 2003 2002 NAICS Kind of Business 2004 from Jan Dec Nov Code 2003 adv. prel. final Jan Dec Retail & food services, total.................... 292,970 5.0 292,970 374,457 316,209 279,009 348,445 Total (excl. motor vehicle & parts)............ 227,709 6.8 227,709 301,869 249,246 213,172 281,503 Retail ....................................... 263,351 4.3 263,351 343,377 286,269 252,558 319,815 GAFO............................................. (*) (*) (*) 129,846 91,358 67,077 123,179 441 Motor vehicle & parts dealers.................... 65,261 -0.9 65,261 72,588 66,963 65,837 66,942 4411,4412 Auto & other motor veh. dealers................. 59,246 -1.4 59,246 66,236 60,707 60,065 61,190 44111 New car dealers................................ (*) (*) (*) 57,328 51,982 51,561 53,540 4413 Auto parts, acc. & tire stores.................. (*) (*) (*) 6,352 6,256 5,772 5,752 442 Furniture & home furnishings stores.............. 7,703 4.9 7,703 10,396 9,328 7,343 9,481 4421 Furniture stores................................ (*) (*) (*) 5,157 4,923 4,181 4,678 4422 Home furnishings stores......................... (*) (*) (*) 5,239 4,405 3,162 4,803 443 Electronics & appliance stores.................... 7,921 11.2 7,921 13,563 9,096 7,121 12,144 44311,13 Appl., T.V. & camera........................... (*) (*) (*) 10,375 6,787 5,128 9,429 44312 Computer & software stores...................... (*) (*) (*) 3,188 2,309 1,993 2,715 444 Building material & garden eq. & supplies dealers 22,533 6.9 22,533 25,542 25,671 21,085 21,814 4441 Building mat. & supplies dealers................ (*) (*) (*) 22,985 23,268 19,160 19,669 445 Food & beverage stores........................... 43,132 5.0 43,132 46,655 42,914 41,068 44,693 4451 Grocery stores.................................. 39,337 4.7 39,337 40,554 38,532 37,582 38,999 4453 Beer, wine & liquor stores...................... (*) (*) (*) 3,882 2,834 2,253 3,682 446 Health & personal care stores.................... 16,475 6.8 16,475 18,959 15,741 15,423 17,120 44611 Pharmacies & drug stores........................ (*) (*) (*) 16,211 13,546 13,323 14,584 447 Gasoline stations................................ 21,356 5.1 21,356 21,335 20,892 20,326 20,030 448 Clothing & clothing accessories stores........... 11,856 9.5 11,856 26,835 16,540 10,825 25,296 44811 Men's clothing stores........................... (*) (*) (*) 1,477 974 659 1,364 44812 Women's clothing stores......................... (*) (*) (*) 4,687 3,194 2,244 4,373 44814 Family clothing stores.......................... (*) (*) (*) 8,889 6,208 3,601 8,637 4482 Shoe stores..................................... (*) (*) (*) 2,450 1,828 1,334 2,326 451 Sporting goods, hobby, book & music stores....... 6,653 3.7 6,653 12,418 7,550 6,415 12,232 452 General merchandise stores....................... 34,420 7.3 34,420 61,470 45,473 32,071 58,883 4521 Department stores (ex. L.D.).................... 14,201 -0.3 14,201 31,243 21,082 14,247 31,854 4521 Department stores (incl. L.D.).................. (*) (*) (*) 31,760 21,404 14,471 32,359 4529 Other general merchandise stores................ (*) (*) (*) 30,227 24,391 17,824 27,029 45291 Warehouse clubs & superstores.................. (*) (*) (*) 25,038 20,620 15,304 22,352 45299 All other gen. merchandise stores.............. (*) (*) (*) 5,189 3,771 2,520 4,677 453 Miscellaneous store retailers.................... 8,236 1.5 8,236 11,378 8,681 8,118 10,944 454 Nonstore retailers............................... 17,805 5.2 17,805 22,238 17,420 16,926 20,236 4541 Electronic shopping & mail-order houses......... (*) (*) (*) 14,813 11,166 9,902 13,471 722 Food services & drinking places.................. 29,619 12.0 29,619 31,080 29,940 26,451 28,630 (*) Advance estimates are not available from the subsample panel for these business classifications. (r) Revised.TABLE 2. PERCENT CHANGE IN ESTIMATED ADVANCE MONTHLY SALES FOR RETAIL AND FOOD SERVICES, BY KIND OF BUSINESS--January 2004
Data adjusted for seasonal variatons, holiday, and trading-day differences, but not for price changes. (Percent Change)
Jan Dec 2004 2003 adv. prel. from-- from-- NAICS Kind of Business Dec Jan Nov Dec Code 2003 2003 2003 2002 Prel. Final Final Final Retail & food Services, total.................... -0.3 +5.0 +0.2 +6.3 Total (excl. motor vehicle & parts ).......... +0.9 +6.6 +0.2 +6.8 Retail .................................. -0.4 +4.5 +0.2 +6.0 441 Motor vehicle & parts dealers.................... -3.9 -0.1 +0.2 +4.7 4411,4412 Auto & other motor veh. dealers............... -4.2 -0.6 +0.1 +4.3 442 Furniture & home furnishings stores.............. -0.9 +5.2 0.0 +7.4 443 Electronics & appliance stores................... +0.1 +11.5 +0.2 +10.5 444 Building material & garden eq. & supplies dealers -0.9 +8.9 +0.6 +14.2 445 Food & beverage stores........................... +1.8 +4.0 -0.4 +3.5 4451 Grocery stores.................................. +1.8 +3.6 -0.3 +3.3 446 Health & personal care stores.................... +0.5 +7.3 +0.2 +9.2 447 Gasoline stations................................ +1.7 +4.8 +0.2 +5.5 448 Clothing & clothing accessories stores........... +2.9 +6.7 -0.2 +5.0 451 Sporting goods, hobby, book & music stores........ +1.6 +2.1 +0.6 +0.2 452 General merchandise stores....................... +1.0 +6.9 +0.3 +5.5 4521 Department stores (ex. L.D.).................... +0.5 -0.3 0.0 -1.7 453 Miscellaneous stores retailers................... 0.0 +1.8 -0.4 +2.6 454 Nonstore retailers............................... -0.3 +7.0 +0.9 +7.5 722 Food services & drinking places.................. +1.1 +10.4 +0.5 +8.8Data not adjusted for seasonal variations, holiday, trading-day differences, and price changes. (Percent Change)
Jan Dec 2004 2003 adv. prel. from-- from-- NAICS Kind of Business Dec Jan Nov Dec Code 2003 2003 2003 2002 Prel. Final Final Final Retail & food Services, total.................... -21.8 +5.0 +18.4 +7.5 Total (excl. motor vehicle & parts ).......... -24.6 +6.8 +21.1 +7.2 Retail .................................. -23.3 +4.3 +19.9 +7.4 441 Motor vehicle & parts dealers.................... -10.1 -0.9 +8.4 +8.4 4411,4412 Auto & other motor veh. dealers................ -10.6 -1.4 +9.1 +8.2 442 Furniture & home furnishings stores.............. -25.9 +4.9 +11.4 +9.7 443 Electronics & appliance stores................... -41.6 +11.2 +49.1 +11.7 444 Building material & garden eq. & supplies dealers -11.8 +6.9 -0.5 +17.1 445 Food & beverage stores........................... -7.6 +5.0 +8.7 +4.4 4451 Grocery stores.................................. -3.0 +4.7 +5.2 +4.0 446 Health & personal care stores.................... -13.1 +6.8 +20.4 +10.7 447 Gasoline stations................................ +0.1 +5.1 +2.1 +6.5 448 Clothing & clothing accessories stores........... -55.8 +9.5 +62.2 +6.1 451 Sporting goods, hobby, book & music stores........ -46.4 +3.7 +64.5 +1.5 452 General merchandise stores....................... -44.0 +7.3 +35.2 +4.4 4521 Department stores (ex. L.D.).................... -54.5 -0.3 +48.2 -1.9 453 Miscellaneous stores retailers................... -27.6 +1.5 +31.1 +4.0 454 Nonstore retailers............................... -19.9 +5.2 +27.7 +9.9 722 Food services & drinking places.................. -4.7 +12.0 +3.8 +8.6 (NA) Not Available. SOURCE: Advance Monthly Sales for Retail Trade and Food Services--JANUARY 2004 (Press Release available without charge from Public Information Office, Bureau of the Census Washington, D.C. 20233). Survey methodology and measures of sampling variability are documented in the Advance Press Release. Questions concerning this report should be directed to Mr. Scott Scheleur (301) 763-2713.
Source of Data: The Census Bureau conducts the Advance Monthly Retail Trade Survey each month to
provide an early indication of sales of retail and food service companies.  The Advance Monthly Retail
Survey is a voluntary survey of a sub-sample of about 5,000 firms selected from the Monthly Retail Trade Survey.
Firms responding to this survey account for approximately 65% of the dollar volume estimate.

Reliability of Estimates: The reliability of the estimates is a function of sampling and nonsampling
errors.  The margin of sampling error, as included on page 1, gives a range about the estimate which is
a 90% confidence interval.  If, for example, the trend estimate is +1.2% and the standard error is 0.9%,
then the margin of sampling error is ±1.65 x 0.9% or ±1.5%, and the 90% confidence interval is -0.3% to +2.7%.
If the interval contains 0, it is uncertain whether there was an increase or decrease.  For monthly level,
the coefficient of variation (CV) is given.  The resulting confidence interval is the estimated value
± 1.65 x CV x (the estimated value). Estimates of sampling variability are given in Table 3.  Nonsampling error,
on the other hand, can occur because of nonresponse,insufficient coverage of the universe of retail businesses,
and response errors.  Although not directly measured, precautionary steps are taken to minimize nonsampling error.
Additional survey information is available at www.census.gov/retail.
(2) Medians are based on estimates from the 12 most recent months.
 4th Quarter 2003 Retail E-Commerce Sales


Source: U. S. Census Bureau
        Service Sector Statistics Division