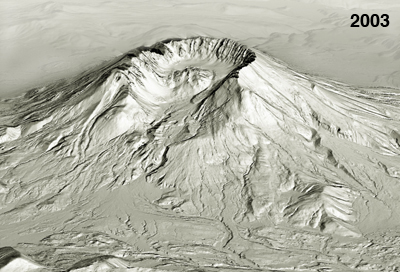
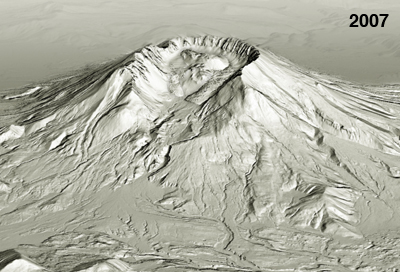
 The figure on the left is a digital perspective view of Mount St. Helens as it appeared on September 22, 2003, one year before the start of its latest eruption, showing the 1980-86 lava dome and Crater Glacier. The figure on the right is a digital perspective view of Mount St. Helens on July 5, 2007 showing the new lava dome, 1980-86 lava dome, and deformed Crater Glacier.
Frequently Asked Questions (FAQs) Regarding the Eruption at Mount St. HelensFebruary 20, 2008
What is the current status of the eruption at Mount St. Helens?
Lava-dome growth at Mount St. Helens has stopped after more than three years of continuous growth. Lava-dome growth began in October 2004 and since then it has been gradually slowing. The eruption is considered to be in a pause of unknown duration.
What is the evidence that the lava dome is no longer growing?
All of the indicators of dome growth have gradually declined to pre-eruption levels, where they have remained since late January 2008. These indicators include seismicity, ground deformation, and volcanic gas emissions. The most direct evidence is that, since late January, repeat photographs from cameras on the crater rim and floor show little or no change in the shape of the new dome, except for a small amount of sagging that would be expected even if lava extrusion has stopped. That observation was confirmed recently by placing a GPS spider on the part of the new dome that had been growing for the past year. Data from the spider indicate that it has moved downwards and away from the center of the dome by less than an inch per day since February 15, motion that is consistent with gravitational settling of the dome and strong evidence that dome growth has stopped or slowed dramatically.
Why is this considered to be a pause? Why is the Alert Level being lowered to Advisory (Color Code Yellow) instead of Alert Level Normal (Color Code Green)?
Our experiences with lava-dome-building eruptions at Mount St. Helens and other volcanoes around the world have taught us that lava-dome extrusion can start anew after pauses of weeks, months, or even years. During such pauses, levels of seismicity, deformation, and gas emission sometimes decline to pre-eruption levels, then increase again prior to renewed eruptive activity. It is too soon for us to say whether the current Mount St. Helens eruption has ended.
Because lava-dome growth has stopped, we are no longer in alert level Watch and aviation color code Orange, as that combination signifies an eruption underway that poses limited hazards and has no to minor ash emissions. Our experience has shown us that many lava-dome eruptions are episodic, and we are continuing to monitor the volcano closely. We have reduced the alert level to Advisory, and the aviation color code to Yellow, to signify that volcanic activity has decreased significantly, but continues to be closely monitored for signs of renewed activity. For information about the alert levels see: http://pubs.usgs.gov/fs/2006/3139/fs2006-3139.pdf
If the eruption resumes, what kinds of precursors are likely to provide warning?
If dome growth were to resume, we would expect it to be preceded by several days or more of seismicity, ground deformation, and perhaps increased volcanic gas emissions as magma again rises up the conduit toward the surface. However, small explosions of steam or volcanic gas, capable of ejecting rocks inside the crater and minor amounts of ash above the crater rim, could occur without warning. Six such explosions occurred between 1989-1991 at St. Helens, a period when the volcano was not erupting. Other types of non-eruptive activity that may occur include rockfalls from the dome or crater walls and small mudflows triggered by rapid snow melt or heavy rainfall.
Is the current situation hazardous? What types of activity could occur in the coming months?
Despite the pause in dome growth, some hazards remain. Small explosions could occur at any time without warning, producing hazardous conditions on the crater floor and upper flanks. Such explosions could be caused by the accumulation of steam (produced when water from rainfall or melting snow/ice comes into contact with still-hot dome rock) in subterranean spaces, with pressure building until the steam is released in an explosion. Rockfalls and small mudflows are also possible, especially during the spring thaw and periods of heavy rainfall. A larger explosion that would pose hazards beyond the volcano itself is unlikely in the absence of new precursory activity. An exception is the hazard to aviation from ash plumes that could be lofted above and downwind from the volcano by small, unheralded explosions or large rockfalls.
How large is the new dome, and how does it compare to the 1980–1986 dome?
In July 2007, the volume of the new dome was 93 million cubic meters (121 million cubic yards). This is slightly larger than the volume of the 1980–1986 dome. The new dome grew a small additional amount from August 2007 to January 2008, but a thick winter snowpack in the crater this winter prevents us from measuring that value accurately.
Is the glacier in the crater still moving, and what will happen to it in the future?
Repeat photographs from a camera on the crater floor show that the east and west arms of the glacier are continuing to advance northward. We are also seeing “glacier quakes” on several seismic stations that are close to the glacier termini, particularly on station VALT (accessible on PNSN webicorder page - http://www.pnsn.org/WEBICORDER/VOLC/welcome.html). Such quakes give us a real-time ability to detect signs of glacier movement. The motion is induced by two factors: continued response of glacier ice to being squeezed by the new lava dome over the last several years, and relatively steep ground slope beneath parts of both arms. This motion will eventually cease unless dome growth resumes, and the lower parts of both arms of the glacier might then shrink to new equilibrium positions.
How does dome growth during 2004-2008 compare to 1980–1986?
Dome growth during 2004-2008 lasted half as long (3 years) as the 1980-1986 eruption (6 years) while adding approximately the same amount of lava to the crater. The combined volume of the 1980-86 and 2004-08 lava domes is about 7 percent of the volume that was removed by the landslide on May 18, 1980, and 11 percent of the volume of the present horseshoe-shaped crater. The most obvious difference between the two periods is that dome growth during 1980–1986 was episodic, with growth spurts that lasted from a few days to nearly a year, interspersed with periods of no growth that lasted from several weeks to almost a year. In contrast, dome growth during 2004–2008 was continuous from October 2004 to January 2008.
What are some of the lessons that scientists have learned from the eruption so far?
There have been many lessons learned from the eruption already, and the learning process is still ongoing. Lessons include:
1) We now know that dome growth can resume, even after a long hiatus, without a long period of obvious precursory activity. The earthquake swarm that signaled the start of renewed eruptive activity in 2004 began on September 23, just eight days before the first small explosion on October 1 and eighteen days before lava extrusion began on October 11. For the first 2 days, the swarm resembled several others that had occurred beneath the volcano in preceding years. There is no evidence that the volcano was inflating when the September 2004 earthquake swarm began, as might be expected if magma was accumulating at shallow depth.
2) Once extrusion started, we learned that dome growth can occur continuously for more than 3 years with relatively little seismicity, ground deformation, and volcanic gas emission. The persistence of the eruption was all the more remarkable given that the erupted lava was almost entirely solid. These observations will serve as fodder for models that attempt to explain mechanics of this and similar eruptions.
3) The nature of the eruption prompted scientists to develop new monitoring tools and techniques, including helicopter-deployable sensor packages (spiders).
4) This was an unusual opportunity to observe the extrusion of a dacite lava dome through glacier ice, and the glacier’s response to the severe disruption it experienced as the dome grew.
Lava-Dome Statistics as of July 5, 2007
Dome Dimensions:
Length (northwest-southeast): 3,725 feet
Width (northeast-southwest): 1,900 feet
High point on dome: 7,585 feet above sea level
Low point on crater rim (Shoestring Notch): 7,780 feet
Elevation difference between high point on dome and Shoestring Notch on the crater rim: 195 feet
Area: 487,000 square meters; 5.2 million square feet (0.19 square miles)
Volume: 122 million cubic yards (volume is equivalent to 150 to 200 large sports stadiums)
Extrusion rate on February 21, 2008: zero
Average extrusion rate between April 20, 2007 and July 5, 2007: 0.14 cubic yards/s (nearly equivalent to filling four Olympic-sized swimming pools every day)
Extrusion rate between October 21, 2006 and December 12, 2006: 0.88 cubic yards/s (nearly equivalent to filling 25 Olympic-sized swimming pools every day)
Glacier Dimensions:
Glacier advance between September 2003 and July 5, 2007 -
West Arm of glacier: 370 feet north and 590 feet east, measured at two different places on the terminus
East Arm of glacier: 1,215 feet northwest
East crater wall rock glacier: 150 feet northwest
Glacier thickness: In September 2007, glacier thickness in the upper section of the east arm exceeded 500 feet. Ice thickness at the terminus of each arm is approximately 60 to 130 feet.
Crater Glacier exceeds area of established nearby glaciers: In September 2007, the area of Crater Glacier was approximately one-fifth the area of glaciated terrain that existed on Mount St. Helens prior to the catastrophic eruption of May 18, 1980. Crater Glacier is approximately 0.33 square miles in area, which is more than twice the area of White River Glacier on the south side of Oregon’s Mount Hood. Crater Glacier is the newest glacier to form in North America. It is one of the most rapidly advancing and one of the lowest-elevation glaciers in the lower 48 states.
Seismicity
Seismicity is at its lowest level since before the eruption began in 2004, and has been so since late January, 2008. There have been very few detectable earthquakes, and most that have occurred have been so small that they can only be seen on seismometers inside the crater. Only three earthquakes have been located so far in February. The very low seismicity levels are one of the primary indicators that the lava-dome building eruption has paused.
In addition, since mid-January most earthquakes have had higher frequency contents than those that have typically occurred in association with the 2004-2008 eruption, and those earthquakes big enough to be located have had slightly greater depths (2-3 km, instead of 0-1 km; see http://www.pnsn.org/HELENS/helenstd_yr.html). These characteristics are similar to those of earthquakes that were occurring as part of the normal background seismicity in the years before the eruption began in 2004. We expect such events to occur as long as the pause persists, and would expect earthquake rates to significantly increase prior to any renewal of lava extrusion. Other types of expected seismicity include rockfalls, avalanches, and glacier quakes, with each occurring more frequently in the spring and summer as temperatures warm.
It is also possible that we may see future seismic sequences similar to one that occurred January 13, 2008. The tremor signal is similar to 28 seismic sequences recorded in 1989-1991, at least six of which were associated with small steam explosions. Such explosions may still occur at St. Helens despite the pause in lava-dome extrusion, and are likely to not be heralded by precursory seismicity.
Figure 1 - Plot of automatically detected events at station SEP (located on the 1980-86 lava dome) between March 1, 2006, and February 19, 2008. Event rates were ~1000/day through September 2006, then dropped to hundreds per day through September 2007, then gradually declined to near zero by late January 2008. Most other temporary drops in event rates were short-lived and due to temporary station outages.
Figure 2 - SEP 12-hour seismicity plot (“webicorder”) from September 23, 2004, showing start of seismic swarm that heralded the reawakening of St. Helens. This and other webicorder records are courtesy of the Pacific Northwest Seismograph Network (PNSN)
Figure 3 - SEP webicorder record from March 20, 2005, showing “drumbeat” seismicity. During this time events were occurring at a rate of ~1 per minute.
Figure 4 - SEP webicorder record from April 22, 2006, showing occasional “drumbeat” earthquakes as well as several larger earthquakes and occasional rockfalls (low-amplitude events with 1-2-minute-long durations).
Figure 5 - SEP webicorder record from December 16, 2007, showing only occasional small earthquakes along with a mini-swarm of earthquakes occurring between 13:30-13:33 PST. During such mini-swarms tiltmeters on the 1980-86 lava dome commonly recorded short-duration and very small-amplitude (< 1 cm) upward-and-downward motions of the old dome.
Figure 6 - SEP webicorder record from January 13, 2008, showing ~1.5 hours of tremor starting at 13:55 PST mixed with a number of earthquakes including two with magnitudes of 2.7 and 2.9. “Drumbeat” events began occurring before the tremor, and gradually dissipated afterwards. The tremor signal is similar to 28 sequences recorded in 1989-1991, at least six of which were associated with small steam explosions.
Figure 7 - SEP webicorder record from February 8, 2008, showing occasional noise glitches and one or two very small earthquakes. This has been the state of seismicity since late January 2008
Gas Emissions
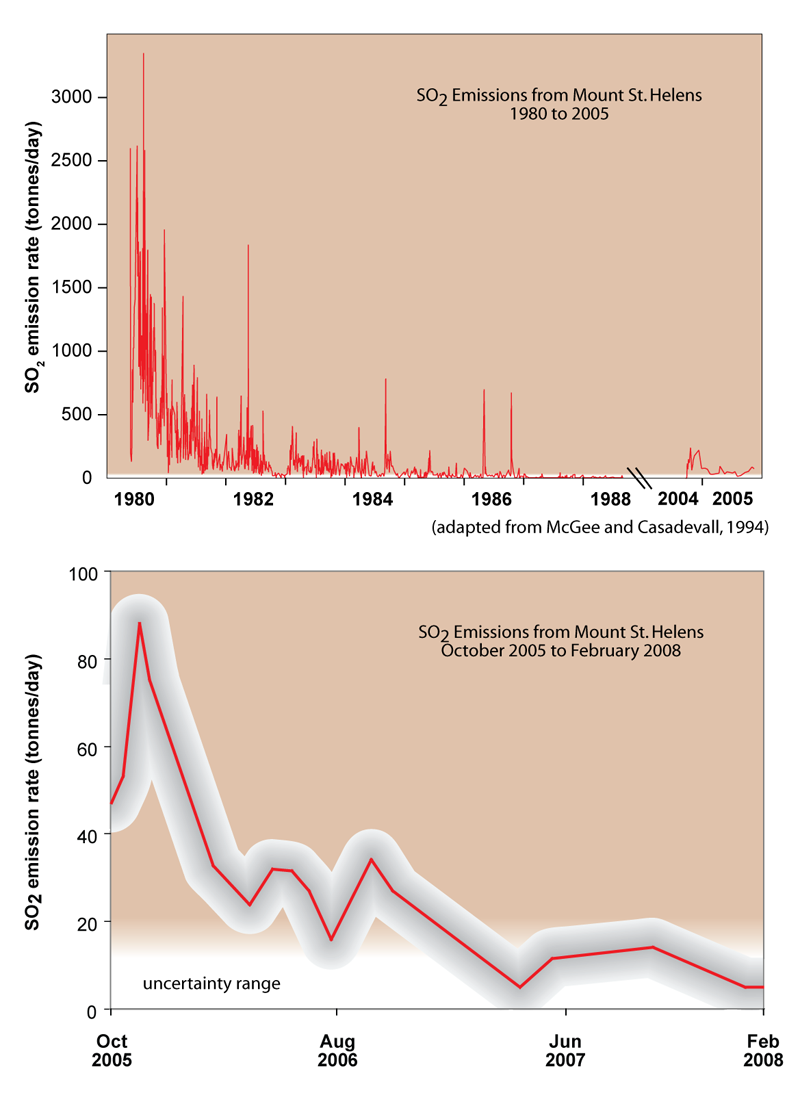
Below are the SO2 gas emissions from the 1980 eruption of MSH through to 1988, and at the end of the graph the latest October 2004 eruption emissions for comparison. The salmon colored shaded region indicates the region where there is high confidence in the data. The second graph shows a more detailed view of SO2 gas emissions from October 2005 to the present. Gas emissions have been declining and in the last 6 months have fallen to very low levels and into the range of uncertainty. The grey shading indicates the level of general uncertainty in the measurements.
Deformation (GPS)
Inward and downward displacement of the ground around Mount St. Helens was most rapid in the weeks following the first seismic swarm on September 23, 2004, and had decayed to nearly background rates by the summer of 2006. This type of motion is expected if magma supplying the eruption is being drawn from an underground reservoir deep beneath the volcano. Total movement of a few cm is seen in the stacked daily tangential (N. 76.5° E., top), radial (N. 13.5° W., middle), and vertical (bottom) displacements of a GPS station at Johnston Ridge Observatory. The time series extends from shortly before the start of the current dome-building eruption through 2006. Error bars are ±1 standard deviation. Heavy, horizontal black line represents projection of long-term trend in radial displacement, red vertical line marks start of unrest (seismic swarm beginning September 23, 2004), and orange vertical lines show start and end times of a series of phreatic explosions between October 1 and 5, 2004,
and the time of last explosion on March 8, 2005. Vertical displacement appears to have ceased shortly after the March 8, 2005, explosion, whereas radial displacement has decayed more slowly. The inset shows a 23-day period at the start of unrest. Winter months show periods of anomalous displacements because of snow and ice accumulation on the GPS-antenna radome.

September 2004 - July 2007 DEM showing dome growth
This movie, a sequence of vertical views into the crater, shows shaded relief images illustrating dome growth and accompanying glacier deformation at Mount St. Helens, 2004-2007. These images were produced from digital elevation models (DEMs) constructed from stereoscopic aerial photographs taken roughly once a month. North it to the top of each image. (.wmv movie, click to play)

|