Satellite Technologies Detect Uplift in the Yellowstone Caldera
 This image of ground deformation was created using data from several satellite passes from 1996 through 2000. The image shows 125 mm (about 5 in) of uplift centered within the northern end of Yellowstone caldera (black dotted line), about 10 km (6.2 miles) south of Norris. Each full spectrum of color (from red to purple) represents about 28 mm (1 inch) of uplift. The uplift is approximately 35 km x 40 km (22 miles x 25 miles) in size.
Yellowstone and other caldera systems are well-known for their continual ups and downs (see our Fact Sheet Tracking Changes in Yellowstone's Restless Volcanic System). The ground surface can rise for decades, and then switch to a period of subsidence. At Yellowstone, scientists measured over two feet of uplift during the period 1923-1985, followed by a shorter period of subsidence. Until the 1990s, it was thought that all the ups and downs occurred in the central part of the Yellowstone caldera, near its two resurgent domes (see second image in the Fact Sheet Tracking Changes in Yellowstone's Restless Volcanic System).
This March 2006, the journal Nature published a paper by YVO scientist Charles Wicks and colleagues about a period of uplift in the northern part of the Yellowstone caldera (Wicks, et al., 2006). It describes an uplift of 12 cm (~5 inches) that occurred between 1997 and 2003, at a time when other changes were occurring in the vicinity (see Notable Changes in Thermal Activity at Norris Geyser Basin Provide Opportunity to Study Hydrothermal System). Since that time, the area, including the Norris Geyser Basin, has stopped moving, while uplift has returned to the central part of the caldera and the resurgent domes (see the YVO activity update and the Horizontal Ground Motion and Time Series page for the most recent information).
This article discusses the 1997-2003 uplift, how we continue to monitor the ever-changing Yellowstone caldera, and what may have caused this and other uplifts.
Using InSAR and GPS to look at ground deformation
 A satellite passes over an area and records data about it. Two or more passes are needed to create the InSAR images we use to examine changes in ground height.
We use two primary techniques to measure ground movement from space,
Interferometric Synthetic Aperture Radar (InSAR) and Global Position System (GPS). These techniques are highly complementary, with one giving a view of a wide area over a long period of time and the other providing a detailed time series for specific localities.
InSAR provides infrequent (annual to semi-annual) but highly detailed images of the amount of movement of the ground relative to a satellite. The technique is very useful for monitoring ground movements or ground deformation at volcanoes because detailed data can be collected for a relatively large area from space. By aiming a pulse of radar energy at the ground and then recording information about the return signal, such as the time traveled by the radar waves, InSAR quickly provides data for an entire area. By returning to the same area at different times, we can gain information about relative ground movements over time. The InSAR data are processed into images, called interferograms. Ground movement, either up or down, is shown by the changes in color on the processed images (see the 1996-2000 InSAR image of the Yellowstone caldera). InSAR data can be combined to produce very high-resolution images that compare changes from one year to the next or multiple passes can be combined to show changes over a few years of time. Although InSAR is a powerful new technique, it is still expensive and often difficult to get time on a satellite for data collection. All of the data shown on this page is from the European Space Agency's ERS-2 satellite. There are currently no U.S. satellites collecting radar data that can be used for InSAR, which makes collecting data even more difficult.
GPS provides detailed time series information about a specific locality. Monitoring ground movement with GPS requires an instrument on the ground (a ground-based receiver) that "listens to" a network of Earth-orbiting satellites. The satellites continuously transmit information to ground-based receivers that are a more precise version of those found in some cars and hand-held units. Some of the benefits of GPS are the ability to continuously monitor a site, for example to take a measurement every few minutes, and to record information about movement along the surface of the earth (in a north-south or east-west direction instead of just a vertical direction). Because we only obtain InSAR images every year or so, our day-to-day understanding of ground movement at Yellowstone comes from the GPS stations (antennas firmly attached to the ground) located around Yellowstone National Park (see the GPS station image). At the present time (January 2006), we have 12 stations at Yellowstone, six of them were installed in summer 2005 by the Plate Boundary Observatory(PBO)/EarthScope project. The network currently reveals an entirely new uplift within the central part of the Yellowstone caldera that can be seen in the GPS data for the WLWY, HVWY, OFWY2 and LKWY stations.
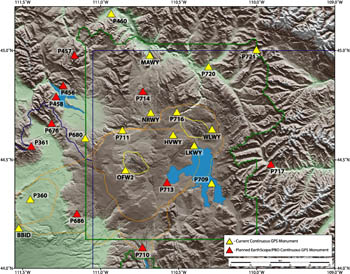 GPS stations at Yellowstone (yellow triangles) and planned stations (red). The green outline is the park boundary and the orange outlines are the 2.1, 1.3 and 0.64 million-year old calderas. The yellow lines show the locations of the two active resurgent domes within the 0.64 million-year old Yellowstone caldera.
 Relative movement of the LKWY GPS station from 1997 to 2006 (there was no Norris station until 2003; this one sits at the north end of Yellowstone Lake). The top image shows north-south movement, the middle image shows east-west movement, and the bottom image shows vertical movement. During the period of uplift in the northern part of the caldera, the LKWY station was subsiding. Recently, this and other stations have moved upwards.
A timeline of the 1997-2003 uplift using pictures created from the satellite data
We can use the following three InSAR images as a timeline for the uplift observed from 1997 through 2003. In the images, each full spectrum of color (from red to purple) represents about 28 mm (1 inch) of uplift. In the first image, rings of color indicate an uplifted area (approximately 35 km by 40 km or 22 x 25 miles) centered on the northern caldera rim. The uplift is in a different location from previously observed deformation episodes at Yellowstone (Wicks, et al., 1998). In the second image, from the fall of 2001, we see a smaller area (approximately 30 km by 20 km) with rings of color indicating that the uplift event is continuing. This image shows the rest of the caldera to be subsiding. In the third image from 2002-2003, the rings of color are absent from where we had previously seen them indicating that the uplift may have ended in late 2002 or early 2003. Instead of uplift in the northern caldera rim, we see continued slight subsidence of the southwest caldera (the purple-red-yellow area of the map southwest of Yellowstone Lake), amounting to less than 1 cm of movement.
The InSAR data for the central caldera agrees with the GPS record as seen on a plot for the Yellowstone Lake GPS station during the same time period. Between 1997 and 2003, that station experienced about 4 cm of subsidence and a general southwestern movement (see the image from the Yellowstone Lake GPS station).
1996-2000 InSAR image, uplift in black box
|
2000-2001 InSAR image, continuing uplift
|
2002-2003 InSAR image, no uplift
|
What caused the uplift?
Once the GPS and InSAR data reveal a pattern of ground movement, scientists try to re-create similar patterns using mathematical models. This allows them to estimate possible depths and volumes of the deformation source. Scientists agree that a fluid has moved into the region, causing an increase in volume within the upper 15 km of the crust. Wicks et al. (2006) propose the idea that a small amount of basaltic magma (molten rock) has moved out of the main caldera (causing the ground to subside) and into the area north of the caldera (causing the ground to move upwards). They discern that the magma moved along a northward-dipping sill (sub-horizontal crack) located about 12-15 km beneath the ground surface. In the past, some scientists have preferred models where deformation at Yellowstone is caused by movement of hydrothermal fluid (hot water) or gas, rather than magma. For example, Waite et al. (2002) discussed a swarm of earthquakes that occurred in the western part of the caldera, that coincided with a change from uplift to subsidence in the caldera. They suggested the swarm was caused by movement of hydrothermal fluids (hot waters and gases) from inside the caldera to the northwest. Both types of fluids (magmatic and hydrothermal) may occasionally cause the observed deformation at Yellowstone. Scientists will continue to collect information that can help discriminate among the various possibilities.
Yellowstone is one of the largest hydrothermal systems in the world and the Norris Geyser Basin is the hottest, most active, area in the park. Yellowstone most likely stays thermally active due to repeated injections of magma miles beneath the surface of the earth. But multiple injections of magma at depth does not mean there will be a magmatic eruption at the surface. There are many examples of magma injections within the crust that never reach the surface. Although there is no evidence that the fluid (or magma) will move to the surface, intrusions at depth can cause disturbances on the surface such as ground swelling and increased discharge of steam and hot water (see the additional questions section for more information).
How does the uplift from 1997 to 2003 compare to earlier activity?
 Leveling data record a cycle of caldera uplift and subsidence from 1976 to 1992. The top curve shows uplift of about 18 cm (7 inches) from 1976 to 1984, the flat line shows no movement from 1984 to 1985, and the bottom curve shows subsidence of about 14 cm (5.5 inches) from 1985 to 1992 (Dzurisin, et al., 1995). The 1997 to 2003 uplift in the northern part of Yellowstone caldera is about 12-13 cm (4.7-5.1 inches).
Over the history of the Yellowstone caldera we see evidence for multiple cycles of uplift and subsidence. Scientists have been studying the timing of these movements using a variety of methods. For information about pre-historic times we use field studies from around the Yellowstone Lake and Yellowstone River. These studies show that the Yellowstone caldera floor has experienced many episodes of uplift and subsidence over the last 15,000 years (Pierce, et al., 2002), some with several meters (> 10 feet) of up and down movement!
Early monitoring studies using leveling surveys show the northeast
caldera floor experienced about 180 mm (7 inches) of uplift from 1976
through 1984, no measurable deformation in 1984-1985, and then
subsidence of about 140 mm (5.5 inches) from 1985 through 1995 (see
figure Dzurisin, et al., 1995). Starting in 1987, GPS
was added to the Yellowstone monitoring system and corroborated the
results from the leveling surveys (Meertens, et al., 1991).
An InSAR study from 1992 through 1997 (just prior to the study we are focusing on in this article) showed subsidence of about 60 mm (2 inches) from 1992-1995 in the northeast and then northwest half of the caldera. From 1995-1997 the same areas showed uplift of 30 mm (1 inch) (Wicks, et al., 1998).
Are there any connections between the uplift and the thermal disturbances?
A previous article on the
thermal disturbances in the Norris Geyser Basin describes recently increased geyser activity and increased temperatures in some areas around Norris. Some of the increased thermal activity is similar to the periodic "disturbances" that have long-been recognized at Norris. Scientists have generally concluded that the leading contributor to the disturbances is variation in the pressure within the hydrothermal system or perhaps the permeability of the rocks hosting the fluids (permeability is a measure of the ability of fluids to migrate through rocks). The recent uplift centered 10 km (6.2 mi) south of the Norris Geyser Basin could have changed the pressure or permeability of the hydrothermal system, contributing to the increased activity at Steamboat Geyser and increased ground temperatures within the Back Basin at Norris. We look forward to future opportunities to study possible connections between uplift and thermal disturbances.
A summary of our findings
-
The Yellowstone caldera appears to be in a constant state of movement and with new monitoring techniques we were able to observe uplift in the northern part of the Yellowstone Caldera, in a region where it had not been previously recorded.
-
The uplift began in late 1997 or early 1998 and ended in late 2002 or early 2003. The total uplift during this time was approximately 125 mm (a little under 5 inches).
-
The uplift was likely due to movement of fluid beneath the northern part of the Yellowstone caldera. The fluid may have been magma, hot water or gas and the source was likely shallower than about 15 km (approximately 9 miles).
-
The increased thermal activity at the Norris Geyser Basin, observed in 2003, may be partly related to the uplift detected by InSAR and GPS. Whatever caused the uplift may have also affected the pressure of deep fluids or the permeability of the rocks near Norris.
- Currently, deformation has returned to the central caldera, with a maximum of about 8 cm of uplift recorded over the past year.
Do you have additional questions? We try to answer them here.
Where can I find additional information about InSAR?
Have uplift and subsidence been seen on other volcanoes? Does uplift mean that an eruption is coming?
What techniques does YVO use to measure ground deformation?
Where can I find more about the new instruments from the EarthScope Project?
Where can I find the latest data on ground deformation at Yellowstone?
References
D. Dzurisin, R.L. Christiansen, and K.L. Pierce, 1995,
Yellowstone: Restless Volcanic Giant, U. S. Geological Survey Open-File Report 95-59.
R.L.Helz, 2005,
Monitoring Ground Deformation from Space, U.S. Geological Survey Fact Sheet 2005-3025.
Meertens, C. M. and R. B. Smith, 1991, Crustal deformation of the
Yellowstone caldera from first GPS measurements: 1987-1989, Geoph. Res.
Letters, 18, 1763-1766.
Pierce, K.L., Cannon, K.P., Meyer, G.A., Trebesch, M.J., and Watts, R., 2002,
Post-glacial inflation-deflation cycles, tilting and faulting in the Yellowstone caldera based on Yellowstone Lake shorelines, U.S. Geological Survey Open-File Report 02-0142.
Puskas, C.M, R. B. Smith, C. M. Meertens, and W. L. Chang, 2006, Crustal
deformation of the Yellowstone-Snake River Plain Volcanic System: campaign
and continuous GPS observations, 1987-2003, J. Geophys. Res., submitted.
Smith, R. B, W. L. Chang, C. Puskas, J. Farrell, and G. Waite, 2005,
Tectonic and magmatic stress interaction of the Yellowstone volcanic
system, Eos, Trans. Amer. Geoph. Un., 86(52), Fall Suppl. Abstract T51D-13
V14B-07.
Waite, G.P., and R.B. Smith, 2002, Seismic evidence for fluid migration
accompanying subsidence of the Yellowstone caldera, J. Geophys. Res.,
107(B9), 2177, doi:10.1029/2001JB000586.
Wicks, C., Thatcher, W. and Dzurisin, D., 1998,
Migration of fluids beneath Yellowstone Caldera inferred from satellite radar interferometry, Science, v. 282, pp. 458-462.
Wicks, C., Thatcher, W. and Dzurisin, D., 2003,
Stress transfer, thermal unrest, and implications for seismic hazards associated with the Norris Uplift Anomaly in Yellowstone National Park, Eos Trans. AGU, 84(46), Fall Meet. Suppl., Abstract G31B-0714.
Wicks, C., Thatcher, W., Dzurisin, D., and Svarc, J.,
2006,
Uplift, Thermal Unrest, and Magma Intrusion at Yellowstone
Caldera, 440, 72-75, Nature.
 This image of ground deformation was created using data from several satellite passes from 1996 through 2000. The image shows 125 mm (about 5 in) of uplift centered within the northern end of Yellowstone caldera (black dotted line), about 10 km (6.2 miles) south of Norris. Each full spectrum of color (from red to purple) represents about 28 mm (1 inch) of uplift. The uplift is approximately 35 km x 40 km (22 miles x 25 miles) in size.


