


| Geography |
-
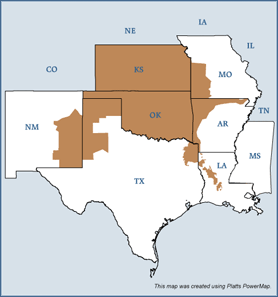
States covered: Kansas, Oklahoma and parts of New Mexico, Texas, Louisiana, Missouri, Mississippi and Arkansas
Reliability region: Southwest Power Pool (SPP) [NERC regions map
Balancing authorities: [NERC balancing authority map
American Electric Power (CSWS), Board of Public Utilities (Kansas City, KS) (KACY), City of Lafayette, LA (LAFA), City Power & Light (Independence, MO) (INDN), Cleco Power, LLC (CLEC), Empire District Electric Company (EDE), Grand River Dam Authority (GRDA), Kansas City Power & Light Company (KCPL), Louisiana Energy & Power Authority (LEPA), Missouri Public Service (MPS), OG+E Electric Services (OGE), Southwestern Power Administration (SPA), Southwestern Public Service Company (SWPS), Sunflower Electric Power Corp. (SECI), West Plains Energy (WPEK), Westar Energy, Inc. (WR), Western Farmers Electric Coop.(WFEC)
Load Zones: American Electric Power (CSWS), Empire District Electric Company (EDE), Grand River Dam Authority (GRDA), Kansas City Board of Public Utilities (KACY), Kansas City P&L Power Supply (KCPL), Oklahoma Gas & Electric Trans. (OKGE), Southwest Public Service (SPS), Sunflower Electric Power Corp. (SECI), West Plains Trans. (WPEK), Westar Energy Generation (WR), Western Farmers Electric Coop. (WFEC)
| RTO/ISO |
-
Southwest Power Pool (SPP) (granted RTO status in 2004) provides transmission service on the transmission facilities owned by its members and operates the region's real-time energy imbalance service (EIS) market.
SPP 2006 State of the Markets Report
Market Monitor:
Richard Dillon – Director, Market Development & Analysis
Boston Pacific Company, Inc. – External Market Advisor
Market participants trade physical electricity bilaterally, either directly or through brokers, and through the EIS market.
| Generation/Supply |
-
Marginal fuel type: Coal and natural gas
Generating capacity (summer 2006): 45,950 MW
Capacity reserve (summer 2006): 3,723 MW
Reserve margin (summer 2006): 9%
| Demand |
-
All time peak demand:
Reliability Footprint: 43.3 GW (set August 14, 2007)
Market Footprint: 35.9 GW (set August 14, 2007)
In summer of 2007, demand reached record levels on several occasions due to extremely hot weather.
Peak demand growth: 2.6% (2007–2006)
| 2005 | 2006 | 2007 | |
|---|---|---|---|
| Summer Peak Demand (GW) | 40.5 | 42.2 | 43.3 |
| Source: Derived from SPP Data | |||
| Prices |
-
Annual Average of Platts Daily Spot Price Index
SPP North
2004: $45.19/MWh
2005: $67.44/MWh
2006: $55.84/MWh
2007: $60.21/MWh