|
MARPLOT
MARPLOT is a mapping program. With MARPLOT's easy-to-use GIS interface, you can quickly view and modify maps, and you can create your own objects.
 |
|
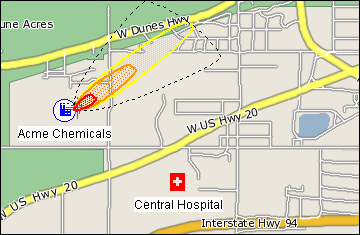
On this sample MARPLOT map, the basemap is set to the standard view, which includes items such as roads, cities, lakes, and national parks. Overlay objects (a chemical facility and a hospital) have been drawn on top of the map, and an ALOHA threat zone is also displayed.
|
Key Program Features
- Switch quickly between three basemaps: standard map files, aerial photos, and topographical maps.
- Get population estimates.
- Get information about basemap features.
- Link overlay objects to the CAMEO database program.
- Easily display ALOHA threat zones.
- Customize your view by drawing your own objects on the map and specifying which basemap layers are shown.
MARPLOT was developed jointly by NOAA and the Environmental Protection Agency (EPA), and it runs on both Windows and Macintosh computers.
MARPLOT and Environmental Sensitivity Index (ESI) Maps
ESI maps show areas and resources that are sensitive to oil:
- Biological resources (such as nesting birds),
- Human-use resources (such as a tourist beach or a commercial fishing area), and
- Sensitive shorelines (such as coral reefs).
 |
|
On ESI maps, colors and icons are used to mark the sensitive areas along the shoreline. During an oil spill, these maps can be used to prioritize and protect the shoreline environment.
|
ESI maps are available in a variety of formats (including MARPLOT maps) on regional ESI CD/DVDs. To use the MARPLOT ESI maps, you need an ESI Viewer, which will allow you to view, print, and run simple searches on ESI data for a specific region.
|