|
 |
 |
| Home | News | Organization |
|
|
Station List Observations Observations via Google Maps Classic Maps Recent Historical DART® MMS ADCP Obs Search Ship Obs Report APEX TAO DODS HF Radar OSMC Dial-A-Buoy RSS Feeds Email Access Station Status NDBC Maintenance NDBC Platforms Partner Platforms Program Info About NDBC Met/Ocean Moored Buoy C-MAN TAO DART® VOS CSP IOOS® DAC Publications Hurricane Data Plots Mariners Weather Log Observing Handbook No. 1 Science Education FAQ Contact Us Links |
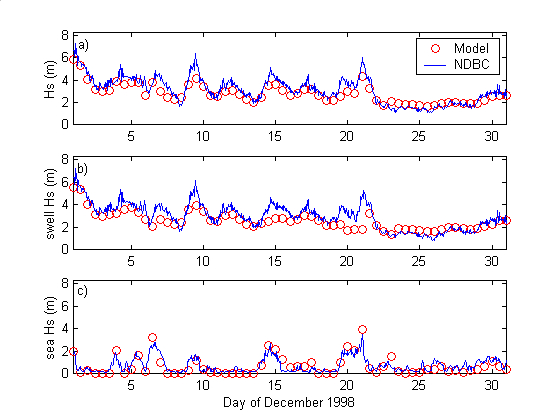
How are estimates of wind-seas and swell made from NDBC wave data?Estimates of wind-sea and swell are made by selecting a separation frequency that partitions the wave spectrum into its wind-sea and swell parts. The respective parts of the spectrum are then used to compute significant wave height, peak frequency (or period), and mean direction of the swell and wind-seas portions of the spectrum. Figure 1 depicts this process on a plot of a typical wave spectrum showing the distribution of wave energy with frequency. NDBC has been using the wave steepness method to estimate wind-seas and swell on its web site since 1997. This method determines a separation frequency by assuming that wind-seas are steeper than swell and that maximum steepness, or ratio of wave height to length, occurs in the wave spectrum near the peak of wind-seas energy. The steepness method performs well under conditions of building or sustained wind-seas, but the method often overestimates wind-seas under conditions of abating winds and seas, or under light winds when significant swell is present. To improve performance, the steepness method was modified to limit the minimum allowable separation frequency based on the observed wind speed. This is possible because sustained winds can build waves with increasing heights and periods only up to a certain point. If the winds are sustained long enough, and since wave propagation speed increases proportionally with wave period, a point will be reached where wind and wave propagation speeds are approximately equal. The wind can exert no further force on the waves, and wind-seas are said to have become fully-developed. Since peak frequencies of fully-developed seas generated by a given wind speed are well known, this relationship can be used to set a lower limit on the separation frequency. Positive results were obtained in tests of the modified method using measurements from directional buoys where swell and wind-seas can be easily identified by differences in propagation direction. Improved results were also obtained when the modified method was compared with wind-sea and swell estimates from the Navy's operational wave model (WAM), shown in Figure 2. While the modification presents a slight disadvantage in that it requires wind speed information, satisfactory results are obtained without knowledge of wave direction.
Gilhousen, D.B. and R. Hervey, 2001. Improved Estimates of Swell from Moored Buoys, Proceedings of the Fourth International Symposium WAVES 2001, ASCE: Alexandria, VA, pp. 387-393.
|
 Figure 1. A typical wave spectrum showing the separation frequency and the distribution of
swell and wind-seas energy with frequency.
Figure 1. A typical wave spectrum showing the separation frequency and the distribution of
swell and wind-seas energy with frequency.