SurvCost Example--full size
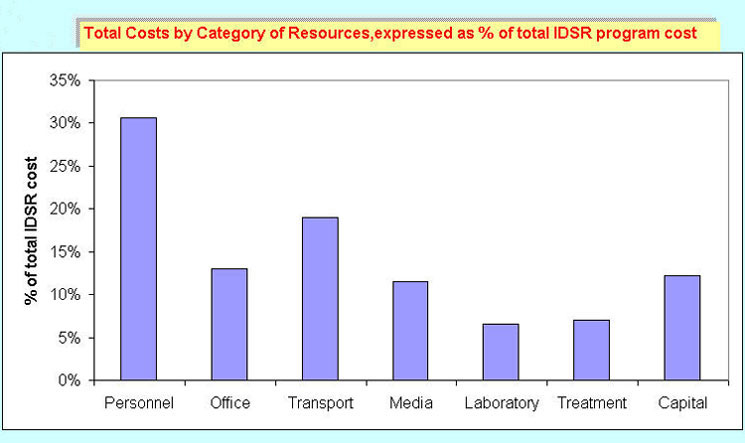
The graph above is an example of the summary data that can be produced by SurvCost. The graph depicts an example of a “cost profile” of IDSR, showing the percent that each category of resource contributes to the total cost of IDSR. < Back |